

Kevin Brine
This article was coproduced with Dividend Sensei.
Financial markets are in turmoil, the Fed is on the inflation-fighting warpath, and most economists (and 80% of CEOs) are convinced that a recession is coming in 2023.
In these dark times, when it seems like there is nowhere to hide, many investors are desperate for the pain to stop, but it looks like we MIGHT have a few more months before the market finally bottoms.
In times like these, it’s hard to believe that in 2021 the market was in FOMO (fear of missing out) mode and hitting all-time highs.
But times like these are EXACTLY when blue-chip bargains are just screaming to be bought. Why?
-
since 1950, whenever the market has hit -25% the average 12-month gain is +22%
-
the average 3-year gain is almost 100%
-
the average 10-year gain is 213% (more than triple your money).
These are NOT the returns from market bottoms; just the first time the S&P hit -25%. Stocks often keep falling a bit more in the coming weeks, but it won’t matter to you in the long-term.
In other words, no long-term buy-and-hold blue-chip investor in history has ever regretted buying during a bear market like this.
And unless this is literally the apocalypse, this time won’t be any different.
So let me show you the three reasons I just recommended FedEx Corporation (NYSE:FDX) for DK members and why you might want to buy it too.
In fact, let me show you why it’s literally the best time in 14 years to buy this fast-growing high-yield dividend blue-chip.
Reason One: FedEx Is The Complete High-Yield Deep Value Anti-Bubble Package
Here’s the bottom line upfront about why I’m recommending FedEx today.
FDX is 41% off its highs in a severe bear market.
The Lowest P/E Since The Great Recession
FAST Graphs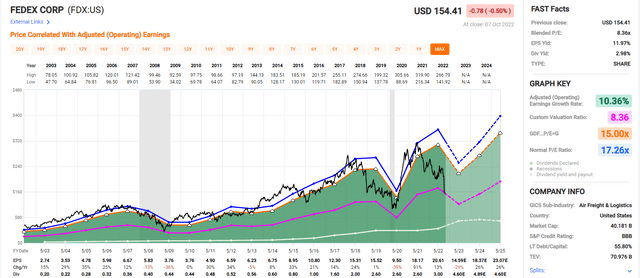
FDX bottomed at 8.42X earnings in the depths of the Great Recession. Today its blended trailing P/E is 8.36, even lower.
-
The best time in 14 years to buy FDX if you’re comfortable with the risk profile and like the business
The last time FDX was this undervalued, it delivered 21% annual returns for the next 10 years and 19% annual returns for the next 15 years.
-
6.7X return in 10 years
-
13.6X return in 15 years
Why The Market Hates FedEx Today
“Material labor constraints and wage inflation emerged in fiscal 2022, setting margins back, especially at ground. Additionally, package volumes are facing normalization of business-to-consumer volumes, retailer restocking, and air freight activity.
Thus, revenue growth and EBIT margins are easing, and execution uncertainty is high. On the other hand, we believe profitability can stabilize in the year ahead as new management shifts from a growth to an efficiency posture.” – Morningstar (emphasis added).
Management is dealing with very challenging macro and executional issues right now, with a strong effort on cost-cutting and optimizing margins after a massive growth spending campaign in recent years.
-
From 2017 through 2019, it generated -$1.3 billion in free cash flow while spending $16 billion on growth.
FDX is now planning on $2.4 billion in additional cost cuts on top of what was already planned for this fiscal year.
Within 3 years, FDX plans an additional $4 billion in cost savings on top of what it had already planned.
-
$1.4 billion in network efficiencies
-
$1.1 billion in logistical efficiencies
-
$1.5 billion from automation.
By fiscal 2025 (our 2024), FDX plans on boosting margins, improving the efficiency of its network by 10%, and providing a relatively safe 25% dividend payout ratio (based on operating earnings).
FDX has a stable and wide moat created by a very expensive-to-recreate and complex logistics chain, including
-
almost 700 aircraft
-
over 215,000 vehicles
-
550,000 employees
-
over 5,000 operating facilities
-
shipping over 16 million packages per day
In general, FedEx’s extensive international shipping network is extraordinarily difficult to duplicate and despite near-term normalization off pandemic highs, domestic/international e-commerce spending should remain a longer-term tailwind (outside a major recession).
Although Amazon has been insourcing more of its own U.S. last-mile package deliveries over the past several years, FedEx has bolstered its ground and express capabilities and is well positioned to serve the myriad other retail shippers pursuing e-commerce, not to mention its entrenched relationships in B2B delivery.
The TNT integration is wrapping up and we expect efforts to bear fruit in Europe.” – Morningstar (emphasis added).
Amazon is the only major threat. While they are taking more delivery in-house, FedEx is adapting by focusing on areas where Amazon.com (AMZN) has thus far shown no interest, such as business deliveries.
FedEx Balance Sheet
-
S&P credit rating: BBB stable = 7.5% 30-year bankruptcy risk
-
Moody’s credit rating: Baa2 (BBB stable equivalent) = 7.5% 30-year bankruptcy risk/
Rating agencies like to see 3.0X or less net debt/EBITDA, and FDX’s leverage is 1.92 over the last year, and next year is expected to be 1.6X.
The company has $10.4 billion in liquidity, almost 2 years’ worth of growth spending, and 95% unsecured bonds with well-staggered debt maturities.
-
no debt coming due until 2025.
The bond market is so confident in FDX’s long-term survival that it’s willing to lend to FDX for 75 years at 7.6% and 42 years at 4.5% interest rates.
-
the “smart money” on Wall Street thinks AMZN won’t kill FDX.
Credit default swaps are insurance policies bond investors take out against potential defaults.
-
a real-time fundamental risk-assessment tool.
In the last six months, FDX’s fundamental risk has jumped, especially after its profit warning, but remains low on an absolute basis.
-
5.01% 30-year default risk is consistent with BBB+ stable credit ratings
-
higher than FDX’s actual credit ratings.
Reasons To Potentially Buy FDX Corp Today
|
Metric |
FedEx |
|
Quality |
79% 12/13 Super SWAN (Sleep Well At Night) Global Shipping Company |
|
Risk Rating |
Low Risk |
|
DK Master List Quality Ranking (Out Of 500 Companies) |
293 |
|
Quality Percentile |
42% |
|
Dividend Growth Streak (Years) |
2 years (but 20 years without a dividend cut, ever since it began paying a dividend) |
|
Dividend Yield |
3.0% |
|
Dividend Safety Score |
82% |
|
Average Recession Dividend Cut Risk |
0.5% |
|
Severe Recession Dividend Cut Risk |
1.95% |
|
S&P Credit Rating |
BBB stable |
|
30-Year Bankruptcy Risk |
7.50% |
|
Consensus LT Risk-Management Industry Percentile |
68% Above-Average |
|
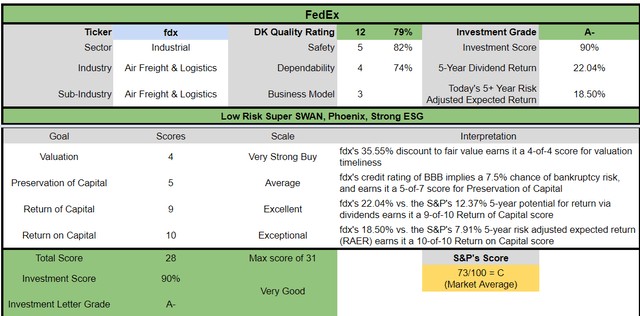
Fair Value |
$239.59 |
|
Current Price |
$154.41 |
|
Discount To Fair Value |
36% |
|
DK Rating |
Potentially Very Good Buy |
|
PE |
9.3 |
|
Cash-Adjusted PE |
6.9 |
|
Growth Priced In |
-3.2% |
|
Historical PE |
13 to 16 |
|
LT Growth Consensus/Management Guidance |
14.6% |
|
PEG Ratio |
0.47 (growth at a wonderful price) |
|
5-year consensus total return potential |
24% to 29% CAGR |
|
Base Case 5-year consensus return potential |
27% CAGR (5X the S&P 500) |
|
Consensus 12-month total return forecast |
32% |
|
Fundamentally Justified 12-Month Return Potential |
58% |
|
LT Consensus Total Return Potential |
17.6% |
|
Inflation-Adjusted Consensus LT Return Potential |
15.3% |
|
Consensus 10-Year Inflation-Adjusted Total Return Potential (Ignoring Valuation) |
4.16 |
|
LT Risk-Adjusted Expected Return |
11.40% |
|
LT Risk-And Inflation-Adjusted Return Potential |
9.11% |
|
Conservative Years To Double |
7.91 |
(Source: Dividend Kings Zen Research Terminal).
FedEx 2025 Consensus Total Return Potential
FAST Graphs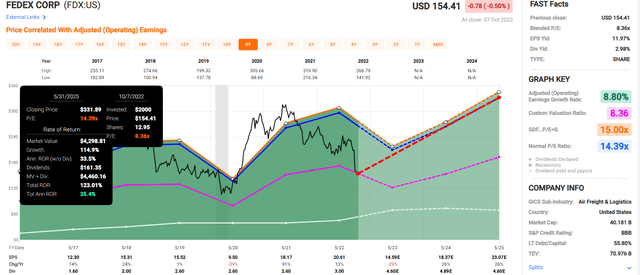
Analysts think FDX could deliver 35% annual returns through May 2025, a 123% total return.
-
3X more than the S&P 500
-
Buffett-like return potential from an anti-bubble fast-growing blue-chip bargain hiding in plain sight.
FedEx 2028 Consensus Total Return Potential
FAST Graphs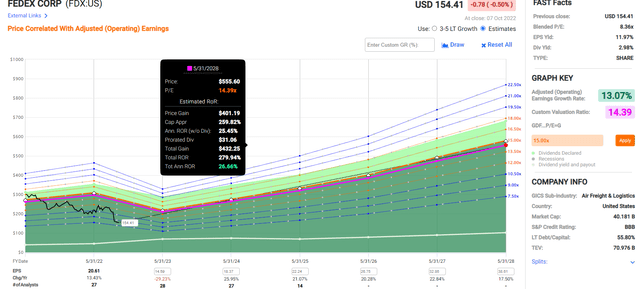
Analysts think FDX could deliver 27% annual returns through May 2025, a 280% total return.
-
5X more than the S&P 500
-
Buffett-like return potential from an anti-bubble fast-growing blue-chip bargain hiding in plain sight
-
almost 4X your money in five years.
FDX Corp Investment Decision Tool
Dividend Kings Dividend Kings 
FDX is a potentially very good fast-growing dividend blue-chip opportunity for anyone comfortable with its risk profile. Look at how it compares to the S&P 500.
-
36% discount to fair value Vs. 9% S&P = 27% better valuation
-
3.0% very safe yield vs. 1.9% S&P (50% higher and much safer yield)
-
75% higher annual long-term return potential
-
2X higher risk-adjusted expected returns
-
2X the consensus 5-year income.
Reason Two: Solid Growth Prospects As Far As The Eye Can See
FDX is priced for -3.2% CAGR growth based on its cash-adjusted 6.9 PE. It’s priced as if it’s a dying company, but here’s what analysts actually expect.
|
Metric |
2021 Growth Consensus |
2022 Growth Consensus |
2023 Growth Consensus |
2024 Growth Consensus |
2025 Growth Consensus |
2026 Growth Consensus |
2027 Growth Consensus |
|
Sales |
18% |
12% |
4% |
3% |
2% |
7% |
8% |
|
Dividend |
15% |
53% (Official) |
22% |
5% |
23% |
9% |
2% |
|
EPS |
91% |
13% |
-29% |
26% |
26% |
23% |
19% |
|
Operating Cash Flow |
94% |
-2% |
-17% |
21% |
10% |
NA |
NA |
|
Free Cash Flow |
668% |
-28% |
-56% |
117% |
38% |
NA |
NA |
|
EBITDA |
48% |
8% |
-10% |
14% |
16% |
NA |
NA |
|
EBIT (operating income) |
106 |
9% |
-20% |
23% |
19% |
NA |
NA |
(Source: FAST Graphs, FactSet)
Yes, FedEx is expected to suffer due to the recession temporarily, but it’s expected to recover with incredibly hyper-growth in the coming years.
-
12% CAGR dividend growth consensus through 2027
-
achieving a 25-year no-dividend-cut streak by 2027.
Long-Term Growth Outlook
-
8% to 14.6% CAGR growth consensus range (from four sources)
-
14.6% median-growth consensus from all 32 analysts.
Smoothing for outliers, analyst margins-of-error are 15% to the downside and 10% to the upside.
-
7% to 17% CAGR margin-of-error adjusted growth consensus range.
FDX’s growth rates have ranged from 8% to 47% CAGR over the last 20 years, with a 20-year growth rate of 11.4% CAGR.
Analysts expect in the future, FDX will grow at a similar rate as in the last 12 years.
|
Investment Strategy |
Yield |
LT Consensus Growth |
LT Consensus Total Return Potential |
Long-Term Risk-Adjusted Expected Return |
Long-Term Inflation And Risk-Adjusted Expected Returns |
Years To Double Your Inflation & Risk-Adjusted Wealth |
10-Year Inflation And Risk-Adjusted Expected Return |
|
FedEx |
3.0% |
14.6% |
17.6% |
12.3% |
10.1% |
7.1 |
2.62 |
|
Schwab US Dividend Equity ETF |
3.6% |
8.80% |
12.4% |
8.7% |
6.5% |
11.1 |
1.87 |
|
Dividend Aristocrats |
2.8% |
8.7% |
11.5% |
8.1% |
5.8% |
12.3 |
1.76 |
|
S&P 500 |
1.8% |
8.5% |
10.3% |
7.2% |
5.0% |
14.4 |
1.63 |
|
REITs |
3.9% |
6.1% |
10.0% |
7.0% |
4.8% |
15.1 |
1.60 |
(Sources: DK Research Terminal, FactSet, Morningstar, YCharts)
FDX has the potential to outperform almost any popular investment strategy in the coming years, including SCHD, REITs, dividend aristocrats, the S&P 500, and even the Nasdaq.
Inflation And Risk Adjusted Consensus Total Return Potential: $1,000 Initial Investment
|
Time Frame (Years) |
5.0% CAGR Inflation And Risk-Adjusted S&P 500 Consensus |
5.8% Inflation And Risk-Adjusted Dividend Aristocrats Consensus |
10.1% CAGR Inflation And Risk-Adjusted FDX Consensus |
Difference Between Inflation And Risk-Adjusted FDX Consensus And S&P Consensus |
|
5 |
$1,276.28 |
$1,325.65 |
$1,617.84 |
$341.56 |
|
10 |
$1,628.89 |
$1,757.34 |
$2,617.42 |
$988.52 |
|
15 |
$2,078.93 |
$2,329.62 |
$4,234.57 |
$2,155.65 |
|
20 |
$2,653.30 |
$3,088.26 |
$6,850.88 |
$4,197.58 |
|
25 |
$3,386.35 |
$4,093.94 |
$11,083.65 |
$7,697.30 |
|
30 (retirement time frame) |
$4,321.94 |
$5,427.13 |
$17,931.62 |
$13,609.68 |
|
35 |
$5,516.02 |
$7,194.46 |
$29,010.56 |
$23,494.55 |
|
40 |
$7,039.99 |
$9,537.33 |
$46,934.56 |
$39,894.57 |
|
45 |
$8,985.01 |
$12,643.14 |
$75,932.79 |
$66,947.78 |
|
50 |
$11,467.40 |
$16,760.36 |
$122,847.39 |
$111,379.99 |
|
55 |
$14,635.63 |
$22,218.35 |
$198,747.90 |
$184,112.27 |
|
60 (investing lifetime) |
$18,679.19 |
$29,453.71 |
$321,543.06 |
$302,863.87 |
|
100 (Institutional time frame, multi-generational wealth) |
$131,501.26 |
$280,909.72 |
$15,091,482.25 |
$14,959,980.99 |
(Source: DK Research Terminal, FactSet)
FDX’s risk and inflation-adjusted return potential are 18X over the next 30 years and 322X over an investing lifetime.
|
Time Frame (Years) |
Ratio Inflation And Risk-Adjusted FDX Consensus/Aristocrat Consensus |
Ratio Inflation And-Risk Adjusted FDX Consensus vs. S&P consensus |
|
5 |
1.22 |
1.27 |
|
10 |
1.49 |
1.61 |
|
15 |
1.82 |
2.04 |
|
20 |
2.22 |
2.58 |
|
25 |
2.71 |
3.27 |
|
30 |
3.30 |
4.15 |
|
35 |
4.03 |
5.26 |
|
40 |
4.92 |
6.67 |
|
45 |
6.01 |
8.45 |
|
50 |
7.33 |
10.71 |
|
55 |
8.95 |
13.58 |
|
60 |
10.92 |
17.21 |
|
100 |
53.72 |
114.76 |
(Source: DK Research Terminal, FactSet)
Over the long term, that could add up to far more wealth and income than the dividend aristocrats and S&P can offer.
Reason Three: A Lower P/E Than The Great Recession Lows
Over the past 15, millions of investors, outside of bear markets and bubbles, have consistently paid between 13X and 16X earnings for FDX.
-
90% statistical probability this range includes intrinsic value.
This P/E range includes the rise of Amazon as the largest threat to FDX’s moat in decades.
|
Metric |
Historical Fair Value Multiples (9-Years) |
2021 |
2022 |
2023 |
2024 |
2025 |
12-Month Forward Fair Value |
|
Earnings |
14.39 |
$282.04 |
$239.59 |
$239.59 |
$296.15 |
$358.02 |
|
|
Average |
$282.04 |
$239.59 |
$239.59 |
$296.15 |
$358.02 |
$239.59 |
|
|
Current Price |
$154.41 |
||||||
|
Discount To Fair Value |
45.25% |
35.55% |
35.55% |
47.86% |
56.87% |
35.55% |
|
|
Upside To Fair Value (including dividend) |
82.66% |
55.17% |
55.17% |
91.79% |
131.87% |
58.15% |
|
|
2022 EPS |
2023 EPS |
2022 Weighted EPS |
2023 Weighted EPS |
12-Month Forward EPS |
Historical Average Fair Value Forward PE |
Current Forward PE |
Current Forward Cash-Adjusted PE |
|
$16.65 |
$16.65 |
$3.20 |
$13.45 |
$16.65 |
14.4 |
9.3 |
6.9 |
FDX is historically worth about 14.4X earnings, and today trades at 9.3X trough 2023 earnings (recessionary earnings).
Its cash-adjusted P/E is just 6.9X, an anti-bubble private equity valuation pricing in -3.2% growth for a company growing closer to 15%.
|
Rating |
Margin Of Safety For Low Risk 12/13 Super SWAN Quality Companies |
2022 Fair Value Price |
2023 Fair Value Price |
12-Month Forward Fair Value |
|
Potentially Reasonable Buy |
0% |
$239.59 |
$239.59 |
$239.59 |
|
Potentially Good Buy |
10% |
$215.63 |
$215.63 |
$215.63 |
|
Potentially Strong Buy |
20% |
$191.67 |
$191.67 |
$191.67 |
|
Potentially Very Strong Buy |
30% |
$150.94 |
$167.72 |
$167.72 |
|
Potentially Ultra-Value Buy |
40% |
$143.76 |
$143.76 |
$143.76 |
|
Currently |
$154.41 |
35.55% |
35.55% |
35.55% |
|
Upside To Fair Value (Including Dividends) |
58.15% |
58.15% |
58.15% |
For anyone comfortable with its risk profile, FDX is a potentially very strong buy and not far above its Ultra-Value buy price.
-
Ultra value = Buffett-style “fat pitch” table pounding great buy.
Risk Profile: Why FedEx Isn’t Right For Everyone
There are no risk-free companies, and no company is right for everyone. You have to be comfortable with the fundamental risk profile.
FDX Corp Risk Profile
“FedEx is heavily exposed to the health of the U.S. and European economies, and domestic and intercontinental small-parcel delivery demand is influenced by both retail and industrial end markets. Along those lines, inflation’s threat to consumer spending (including e-commerce levels) poses risk to our fiscal 2023 and 2024 forecasts.
Further, FedEx’s ability to post economic profit on average over the next business cycle depends on its heavy network investment (partly aimed at lifting B2C margins) paying off and is a key reason for our High Morningstar Uncertainty Rating. Ignoring potential economic recession, we don’t anticipate an outsize direct impact from the Russia-Ukraine crisis.
In terms of environmental, social, and governance risk, we note that domestically, FedEx ground has mostly immunized itself against the threat of drivers—who are independent contractors—seeking to unionize and become classified as employees.
This has been accomplished by moving route owners to a multiple-route-owning model. We think FedEx freight (the LTL trucking unit) could organize more easily, although only a few terminals have voted to join the Teamsters and multiple terminals in recent years have voted against joining the union.
In the U.S., FedEx express pilots are unionized, but its other employees are not. This is because express falls under the purview of the Railway Labor Act. Thus, Express drivers must vote to organize on a national basis, creating a much higher threshold than local votes.
On a global basis other employees are unionized, and this increased with the TNT acquisition. More widespread unionization, such as among express drivers, would temper FedEx’s ability to flex shipping capacity and other costs to match demand.
We expect FedEx to continue to hedge fuel price changes via fuel surcharges across its operations. When fuel prices increase, fuel expenses and surcharges increase, albeit with a delay between the rise in prices and surcharge implementation.” – Morningstar
FDX’s Risk Profile Summary
-
economic cyclicality risk: sales can drop in recessions (not a long-term fundamental risk)
-
industry disruption risk: Amazon has overtaken it in market share in just a few years
-
talent retention risk in the tightest job market in 50 years
-
supply chain disruption risk (a major issue this year)
-
currency risk (31% of sales from overseas).
Amazon is on track to overtake FDX (it already has) and even UPS in U.S. deliveries.
-
Amazon is now delivering over 66% of its own packages
Business deliveries are, for now, a business AMZN hasn’t tried to get into, though it’s a potential future pivot for a company that largely has the infrastructure in place to make a go at it.
-
EU delivery giant DHL was the last company to challenge FDX and UPS, and it failed in the U.S. after spending billions over a decade and never gaining a significant market share
In terms of recession EPS declines, the Great Recession saw EPS decline 49%, and the Pandemic saw EPS decline 39%.
-
in the 2023 recession, analysts expect a 29% EPS decline
-
this is more than baked into the share price as seen by a P/E lower than the Great Recession
How do we quantify, monitor, and track such a complex risk profile? By doing what big institutions do.
Long-Term Risk Management Analysis: How Large Institutions Measure Total Risk Management
See the risk section of this video to get an in-depth view (and link to two reports) of how DK and big institutions measure long-term risk management by companies
FDX Corp Long-Term Risk-Management Consensus
|
Rating Agency |
Industry Percentile |
Rating Agency Classification |
|
MSCI 37 Metric Model |
56.0% |
BBB, Average |
|
Morningstar/Sustainalytics 20 Metric Model |
73.8% |
20.5/100 Medium Risk |
|
Reuters’/Refinitiv 500+ Metric Model |
91.6% |
Excellent |
|
S&P 1,000+ Metric Model |
35.0% |
Below-Average, Table Trend |
|
Just Capital 19 Metric Model |
88.0% |
Very Good |
|
FactSet |
30.0% |
Below-Average, Table Trend |
|
Morningstar Global Percentile (All 15,000 Rated Companies) |
73.7% |
Excellent |
|
Just Capital Global Percentile (All 954 Rated US Companies) |
94.1% |
Exceptional |
|
Consensus |
68% |
Low Risk, Above-Average Risk Management, Stable Trend |
(Sources: Morningstar, MSCI, S&P, Reuters, FactSet, Just Capital)
FDX’s Long-Term Risk Management Is The 185th Best In The Master List (63rd Percentile)
|
Classification |
Average Consensus LT Risk-Management Industry Percentile |
Risk-Management Rating |
|
S&P Global (SPGI) #1 Risk Management In The Master List |
94 |
Exceptional |
|
Foreign Dividend Stocks |
76 |
Good |
|
Strong ESG Stocks |
73 |
Good |
|
Ultra SWANs |
70 |
Good |
|
FedEx |
68 |
Above-Average |
|
Low Volatility Stocks |
68 |
Above-Average |
|
Dividend Aristocrats |
67 |
Above-Average |
|
Dividend Kings |
63 |
Above-Average |
|
Master List average |
62 |
Above-Average |
|
Hyper-Growth stocks |
61 |
Above-Average |
|
Monthly Dividend Stocks |
60 |
Above-Average |
|
Dividend Champions |
57 |
Average bordering on above-average |
(Source: DK Research Terminal)
FDX’s risk-management consensus is in the top 37% of the world’s highest quality companies and similar to that of such other blue-chips as
-
Abbott Labs (ABT): Ultra SWAN dividend king
-
Philip Morris International (PM): Ultra SWAN dividend king
-
Kimberly-Clark (KMB): Ultra SWAN dividend king
-
Stanley Black & Decker (SWK): Super SWAN dividend king
-
Honeywell (HON): Ultra SWAN
The bottom line is that all companies have risks, and FDX is above-average, bordering on good, at managing theirs.
How We Monitor FDX’s Risk Profile
-
32 analysts
-
2 credit rating agencies
-
7 total risk rating agencies
-
39 experts who collectively know this business better than anyone other than management
-
and the bond market for real-time fundamental risk assessment
“When the facts change, I change my mind. What do you do, sir?” – John Maynard Keynes
There are no sacred cows at iREIT or Dividend Kings. Wherever the fundamentals lead, we always follow. That’s the essence of disciplined financial science, the math behind retiring rich and staying rich in retirement.
Bottom Line: It’s The Best Time In 14 Years To Buy FedEx
Let me be clear: I’m NOT calling the bottom in FDX (I’m not a market-timer).
Sleep Well At Night doesn’t mean “can’t fall hard in a bear market.”
Fundamentals are all that determine safety and quality, and my recommendations.
-
over 30+ years, 97% of stock returns are a function of pure fundamentals, not luck
-
in the short term; luck is 25X as powerful as fundamentals
-
in the long term, fundamentals are 33X as powerful as luck.
While I can’t predict the market in the short term, here’s what I can tell you about FDX.
-
One of the highest quality, safest, and most dependable deep value, anti-bubble blue-chips on earth.
-
3.0% very safe yield, the company has never cut its dividend, 12% CAGR consensus dividend growth through 2027
-
10.1% CAGR long-term risk-and inflation-adjusted total return consensus, better than the Nasdaq, aristocrats, S&P 500, and SCHD.
-
36% historically undervalued, a potentially very strong buy
-
6.9X cash-adjusted earnings (slightly lower than the Great Recession, the lowest in 14 years, pricing in -3.2% growth)
-
280% consensus return potential over the next five years, 27% CAGR, about 5X more than the S&P 500
-
2X better risk-adjusted expected returns of the S&P 500 over the next five years.
-
2X better income potential over the next five years.
A lot of investors feel smart not buying anything right now.
“Stocks have to fall a lot further” seems like the prudent course doesn’t it?
But stocks never bottom when the bad news stops, only when the bad news is priced in. And you’ll never know how bad the bad news will ultimately get, or when the market actually bottoms.
-
in 1991’s bear market investor sentiment was worse than today
-
stocks bottomed at -21%
-
in 1953’s recession stocks bottomed at -15% (no bear market)
Individual blue-chips bottom on their own schedule.
-
MO bottomed 3 months before the market in 2008 (and was up 9% by the time stocks stopped falling)
-
AMZN bottomed 10 months before the market did, and was up 60% by the time the S&P stopped falling.
If you love a business and its valuation, then buying at least some today is how you minimize the regret of watching it hit bottom and then take off.
That’s especially true with FedEx which is literally trading at Great Recession low valuations.
You can only ever be 80% certain about a blue-chip on Wall Street. But I can say with 80% absolute certainty that today’s economy is better than in 2009’s, and FedEx today is in a lot better financial position than when the US economy was imploding.
If you believe, as I and the expert consensus do, that if Amazon isn’t going to kill FedEx, then today is a great time to buy some.
If you are willing to look past the horrors of 2022 and the 2023 recession, then FDX is an absolute bargain today.
If you are looking for a very safe 3% yield that’s growing at double-digits?
Then FedEx might be just what you’re looking for.
No long-term investor in history has ever regretted buying FedEx at Great Recession low-level valuations, and I’m 80% confident that today won’t be the first time.
Be the first to comment