

nespix/iStock via Getty Images
Thesis
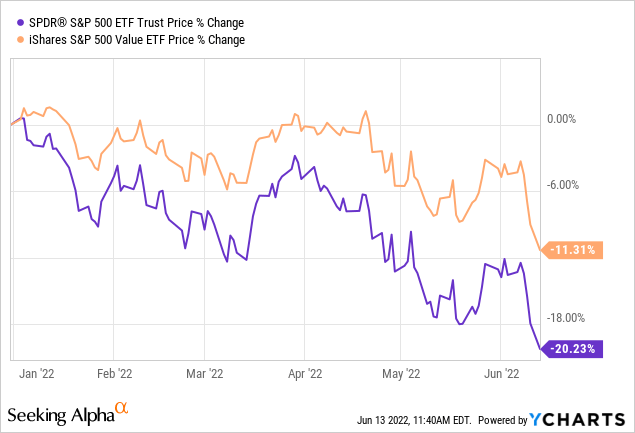
With the S&P entering bear market territory, Value is arguably the only factor in U.S. equities that is holding on, even helping to avoid a more disorderly broader-market decline. Less weighting towards technology and far more conservative valuation multiples seem to be the only reasonable theme at the moment.
Value factor ETFs have been popular for a while, and even more so now, as a hedge against an overheating stock market. In this analysis, one of the most popular funds in the space, iShares S&P 500 Value ETF (NYSEARCA:IVE) is analyzed in terms of structure, competitive attractiveness, and historical performance.
Fund Structure
iShares’ S&P 500 Value ETF aims to track the performance of the S&P 500 Value index, consisting of U.S companies that are potentially undervalued relative to comparable companies. – iShares.com
While avoiding high-multiple names, the fund invests in quality companies across a variety of sectors, including Financials, Industrials, Consumer Staples, Energy, and more. Top 10 holdings include Berkshire Hathaway (BRK.B), Johnson & Johnson (JNJ), Exxon Mobil (XOM), and others.
Total Assets Under Management amount to approximately $24B, while IVE charges a 0.18% expense ratio, which is, in all fairness, a bit pricey, compared to other broad market ETFs’ ratios of around 0.4-0.10%. IVE has been in existence since 2000, leaving an extensive record of performance available for examination (see segments below). Some key attributes of IVE, along with its top 10 holdings are available in the table below.
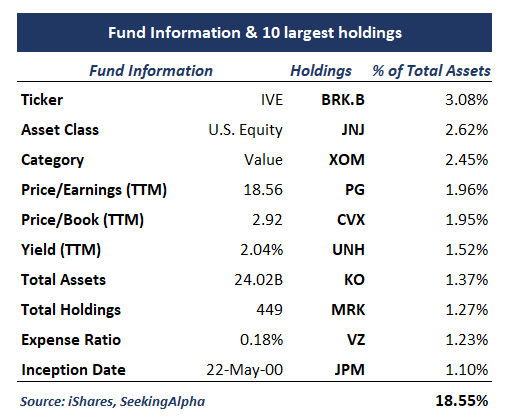
While the 2.04% yield the fund currently offers is by no means a huge jump from the average market dividend yield, it still provides some consolation during inflationary times, also assisting with total returns a bit. Considering the identity and philosophy of the companies the fund invests in, it is also important to note that dividend growth is another benefit for the potential investor.
IVE offers an alternative sector allocation, away from FAANG names and aggressive growth technology stocks, embracing more traditional sectors like Healthcare, Financials, and Industrials. Information technology stocks represent 11.22% of the total weighting, whereas, in an S&P 500 ETF, they would cover almost 27%.
In an economy that is according to many about to enter a recession, defensive exposure (16.6% weighting in Healthcare and 11.1% in Consumer Staples) can provide some reassuring downside protection for investors. Financials also have the potential to perform decently in a rising rate environment. IVE also offers 8.59% and 6.49% exposure towards the Energy and Communications sectors.
iShares
Value vs. Growth vs. Market
To examine performance and volatility metrics in an attempt to gauge the relative attractiveness of the value factor (through IVE), I employed the tools offered by Portfolio Visualizer. Three portfolios were constructed, Portfolio 1 was solely invested in the market (SPY ETF), Portfolio 2 divided its exposure equally between SPY and IVE (value factor), and Portfolio 3 invested 50% in SPY and 50% in IVW (growth factor). A $10,000 beginning balance, dividend reinvestment, and annual rebalancing were assumed, going back to late 2000 when IVE was incepted.
While all three portfolios seem to have performed almost identically between 2001 and 2018, it is in the last 4 years when the growth factor delivers elevated return levels. Despite the sharp drop in 2022, still overall the portfolio embracing the growth factor performs better overall, while value-investing delivers the worst returns. More specifically, Port. 3 record a CAGR of 7.74%, compared to 7.49% for the market and 7.02% for Port. 2. While the difference seems small, over time it accumulates, resulting in major differences, such that $10,000 invested in Port. 3 would have yielded $49,335, compared to 42,763 with Port. 2.
In terms of risk, the market allocation carries the lower standard deviation (15.00%), while Port. 3 (growth factor) records the smallest maximum drawdown (-48.13%) over the 20+ year period. Growth, also marginally offers the best risk-adjusted returns (Sharpe ratio of 0.48 and Sortino ratio of 0.70).
Portfolio Visualizer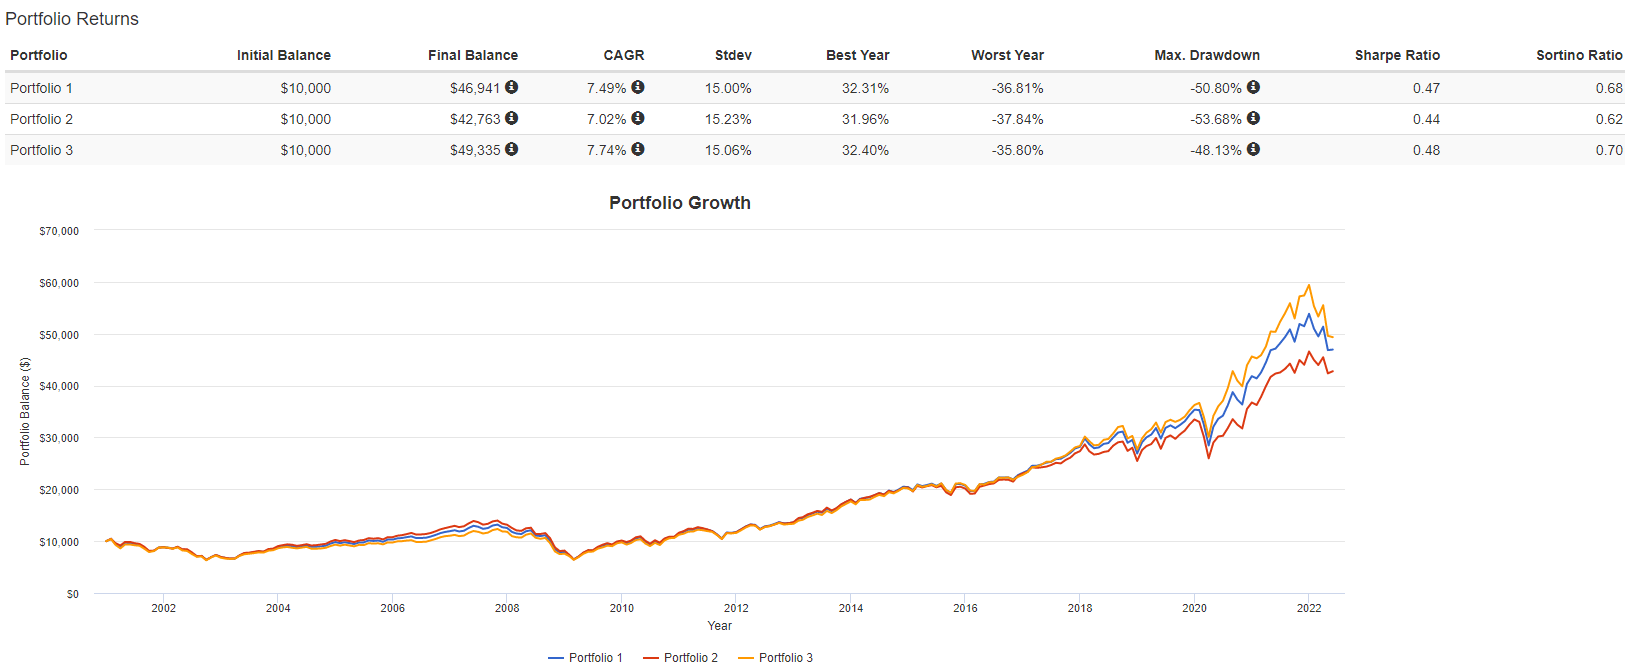
While someone could conclude that growth still wins over time and even go as far as to say that value exposure offers very few benefits, it is important to note that the current market is still in rerating mode. In my view, the value-growth premium that still remains is likely to suffer from mean reversion and therefore fade. As a result, I would argue that especially for mid-term-oriented investors, value is likely to outperform.
Value ETFs Showdown
Continuing with the use of Portfolio Visualizer, I examined risk and return metrics across IVE’s major competitors in the value space. The group of ETFs consists of Vanguard Value ETF (VTV), SPDR Portfolio S&P 500 Value ETF (SPYV), iShares Russell 1000 Value ETF (IWD), and, of course, IVE. Performance metrics since 2015 (a shorter time span this time) are presented below.
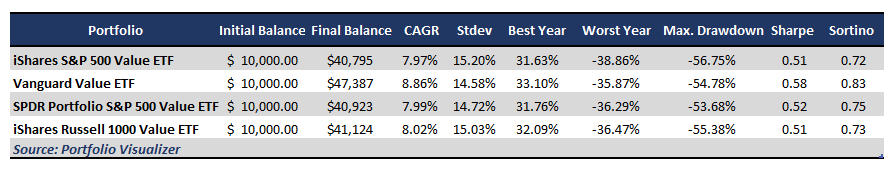
Vanguard’s Value ETF appears to be the clear winner in the group, both in terms of return and risk performance. Leading in both is rather rare and coupled with a very low 0.04% makes it arguably impossible to beat in the value space. VTV delivers an 8.86% CAGR return while recording 14.58% standard deviation, 0.58 Sharpe, and 0.83 Sortino ratios. IVE, on the other hand, underperforms its peers, delivering a 7.97% CAGR return while recording 15.30% standard deviation, 0.51 Sharpe, and 0.72 Sortino ratios.
Final Thoughts
After all things are considered, value-factor exposure is likely to prove beneficial for investors as more uncertainty lurks around the corner in the markets and the growth downturn is likely not over yet. However, despite IVE being a popular and trusted choice in the space, it appears that better-performing options are available for investors. For this reason, I would seek more exposure towards the value factor in the current economic environment by selecting, however, an ETF like VTV instead of IVE, given its relative advantages.
Be the first to comment