

alexsl/iStock via Getty Images
By Somya Sharma
Summary
We rate the iShares S&P 100 ETF (NYSEARCA:OEF) a Hold partly because of our concerns about the broad U.S. equity market. OEF has had a rough year and might go lower by the end of the year. Longer-term, in the next bull market, there is reason to believe that OEF can outperform the S&P 500. We just don’t know how long it will take to enter that next bull market cycle.
Strategy
OEF tracks the performance of the 100 largest stocks in the S&P 500. It is a subset of the S&P 500 and represents about 56% of the market capitalization of U.S. equities. In other words, those 100 largest stocks are valued at more than the rest of the thousands of U.S.-listed stocks.
As per iShares, the behemoth issuer of OEF and many other ETFs, OEF uses a representative sampling indexing strategy to manage the fund. “Representative sampling” is an indexing strategy involving investing in a representative sample of securities with an investment profile similar to an applicable underlying index. This means the securities selected are expected to represent the overall characteristics of the index.
Proprietary ETF Grades
- Offense/Defense: Offense
- Segment: Broad Equity
- Sub-Segment: Large Cap
- Correlation (vs. S&P 500): Very High
- Expected Volatility (vs. S&P 500): Moderate
Holding Analysis
OEF owns 102 stocks, due to the sampling method described above. A significant portion of the fund is in the Information technology sector, which makes up about 30% of the fund. This is not surprising, given the S&P 500’s high-tech weighting. However, when comparing the OEF with an S&P 500-tracking ETF, the difference between the 100-stock subset and the total 500 is clear. For example, Apple (AAPL), Microsoft (MSFT), Amazon (AMZN), and Alphabet, a.k.a. Google (GOOGL and GOOG) account for about 18% of the S&P 500, but roughly 30% of OEF. That means those stocks impact OEF much more than the broader S&P 500 Index.
Healthcare makes up 12% of OEF, highlighted by market leaders United Health and Johnson & Johnson (JNJ). As you can tell, this fund mainly consists of large-cap stocks. All 11 S&P 500 sectors are represented, but three of them (Basic Materials, REITs, and Utilities) add up to only about 3% of assets.
Strengths
For those looking for an S&P 500-like vehicle but with the opportunity to add alpha when the biggest of the big outperforms, OEF offers a slimmer version of that S&P 500 Index.
However, OEF only holds about 20% of the stock components of that larger index. However, investors in OEF get more than 20% of the S&P 500’s movement in this ETF. That’s because the U.S. stock market has elevated the values of the top 100 companies over the past decade’s bull market. As discussed below, that makes for an efficient S&P 500-like package but offers opportunities as well as threats.
Historically, OEF has performed similarly to SPY, an S&P 500 ETF. However, over the past 3 years, OEF has outperformed by a notable margin, thanks to the overwhelming performance of the mega stocks holdings.
Total YTD return comparison of OEF and SPY (YCharts)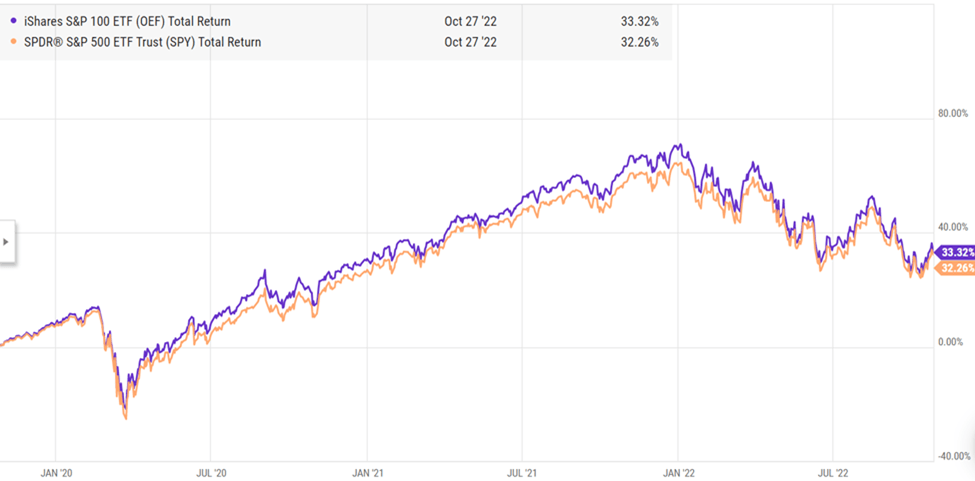
If we compare it to an ETF I wrote about recently, XLG (which contains the top 50 ETFs in S&P 500), OEF is more diversified because of its exposure to 100 stocks, however, the top holdings remain similar, with FAANG stocks dominating. OEF offers diversified exposure and provides a blend of growth and value stocks, showing characteristics of both types of investing. The fund is highly liquid, with a daily average volume of about $75M.
Weaknesses
The concentration of a fund is a double-edged sword. While focusing on a limited number of stocks can be less complex, a heavy weighting in one stock could affect the performance of the fund. This is particularly relevant in 2022 when the earnings and outlook of FAANG stocks are released, and stocks like Amazon and Meta Platforms Inc. (META) fall by 15% or more upon the release of quarterly reports.
OEF’s biggest holdings price change during earnings week (YCharts)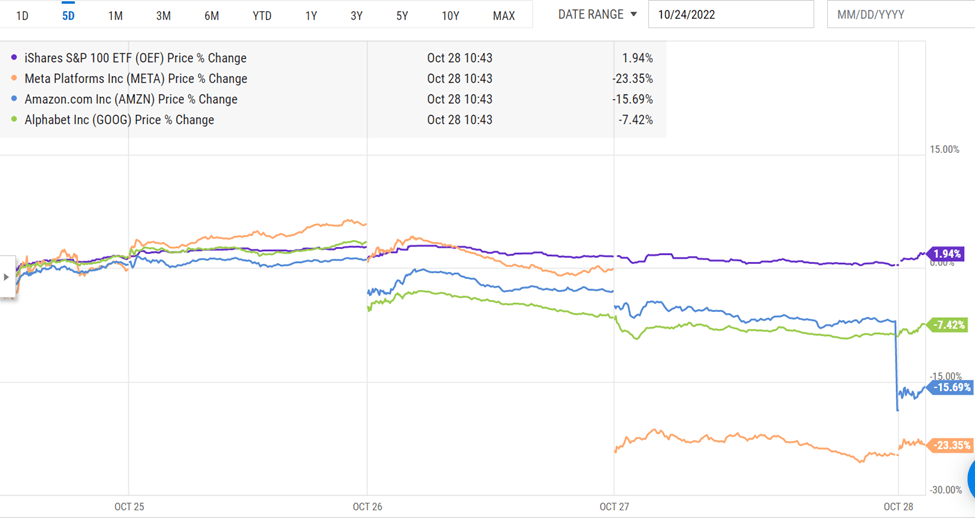
Opportunities
The U.S. Federal Reserve’s series of interest rate increases have significantly pushed down the prices of many large company stocks, along with their valuations. While the stock market still looks expensive to us, those lower valuations could ultimately enable OEF to earn a higher return in the medium to long term.
Threats
The current market increasingly resembles the Dot-Com Bubble, especially the market’s ongoing love of technology stocks. However, there is a good chance that during the second half of 2020 and throughout 2021, those stocks are set up for near-term failure. This is why we like OEF as a longer-term investment but are quick to point out that the near-term could be dangerous.
Proprietary Technical Ratings
- Short-Term Rating (next 3 months): Hold
- Long-Term Rating (next 12 months): Buy
Conclusions
ETF Quality Opinion
We like OEF for what it is: a concentrated, Large cap blend that represents the performance of more than half of the U.S. equity market. We like its liquidity and relative stability versus more high-flying, smaller stock ETFs.
Investment Opinion
OEF is a fine choice for investors seeking mega-cap exposure while minimizing individual stock risk. Just watch out during those bear markets. Our bottom-line rating, for now, is Hold.
Be the first to comment