

RomoloTavani
Thesis
The iShares Mortgage Real Estate Capped ETF (BATS:REM) has suffered sizable corrections tighter with the overall equity market. To wit, its suffered an 11.7% total loss over the past year against the backdrop of a 4.7% loss for the S&P 500 index. Such a correction has pushed its dividend yield to 7.2%, quite appealing for income-oriented investors. In comparison, the overall equity market is yielding only about 1.45% and treasury bonds yielding about 2%.
However, investors should be aware of the key potential risks before engaging. As you can also see from the chart below, the higher yield comes with a much larger volatility risk. Its total loss in the past year has been almost 3 times more than the overall equity market. And as we will see next, it has a few other key risks too.
Seeking Alpha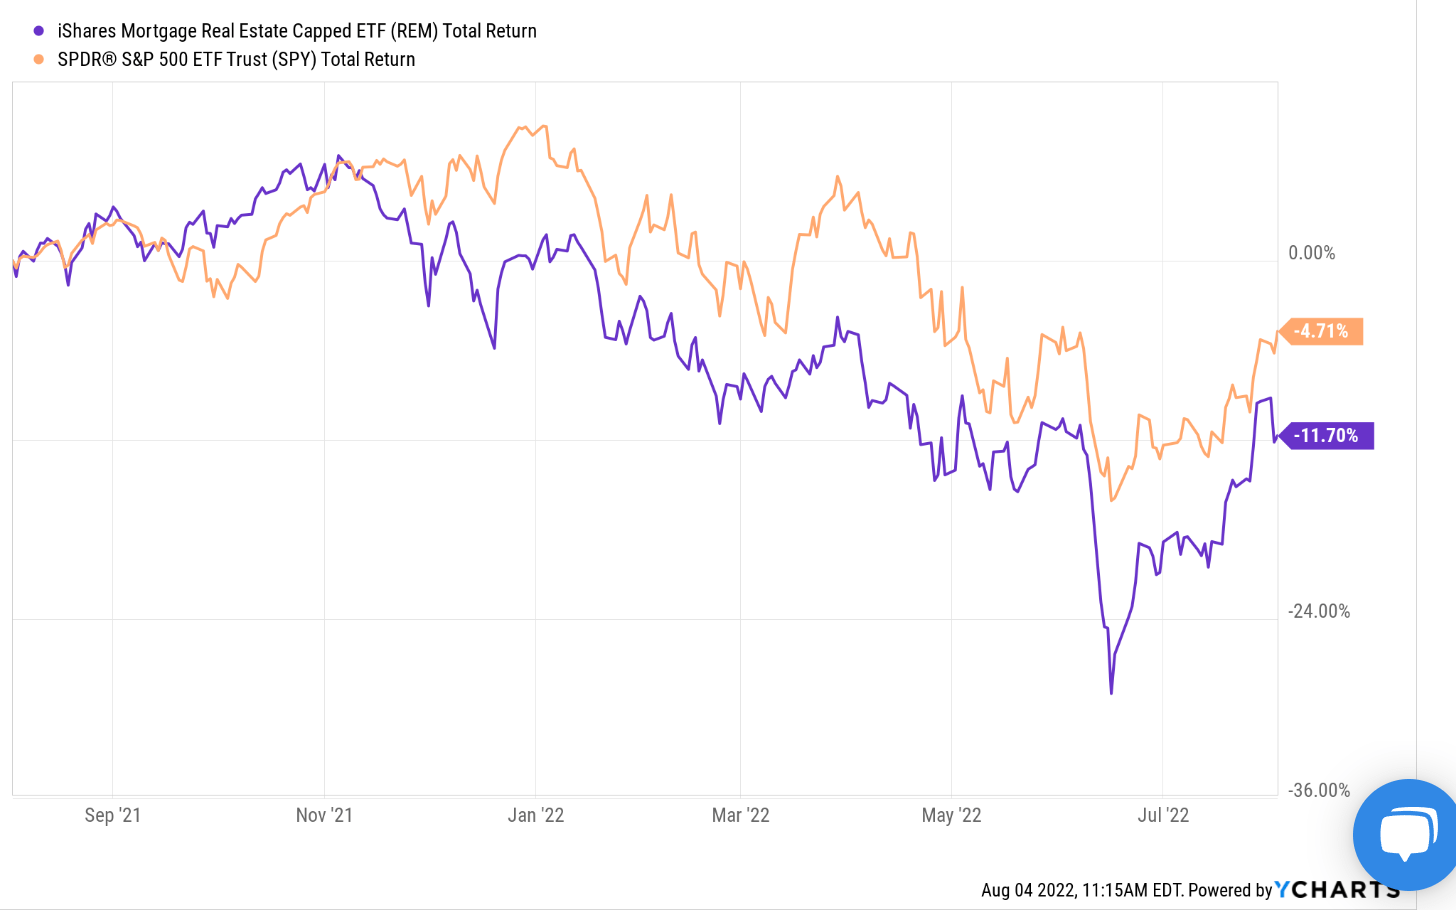
REM: Basic information
Just in case some readers are not familiar with REM yet, the following chart shows its basic information. REM is an iShares fund with $842 billion AUM. In terms of expenses, REM charges a lower expense ratio of 0.48%. The goal of the fund is to provide targeted exposure to the U.S. mREIT stocks as detailed in the fund description:
- The iShares Mortgage Real Estate ETF seeks to track the investment results of an index composed of U.S. REITs that hold U.S. residential and commercial mortgages.
- It provides targeted access to a subset of domestic real estate stocks and real estate investment trusts (REITs), which invest in real estate directly and trade like stocks.
iShares fund description
Concern 1: Top-heavy indexing and concentration risks
Due to its targeted exposure to mREIT and its indexing by market capitalization, the fund is top-heavy and entails considerable concentration risks. The top 10 holdings are listed below, and they represent more than 67% of the total net asset, i.e., more than 2/3. The top 3 holdings represent more than 36% of the total assets. And I have written articles recently to detail the headwinds (such as yield curve inversion and recession risks) on two of them: AGNC Investment Corp (AGNC) and Annaly Capital Management Inc (NLY).
Seeking Alpha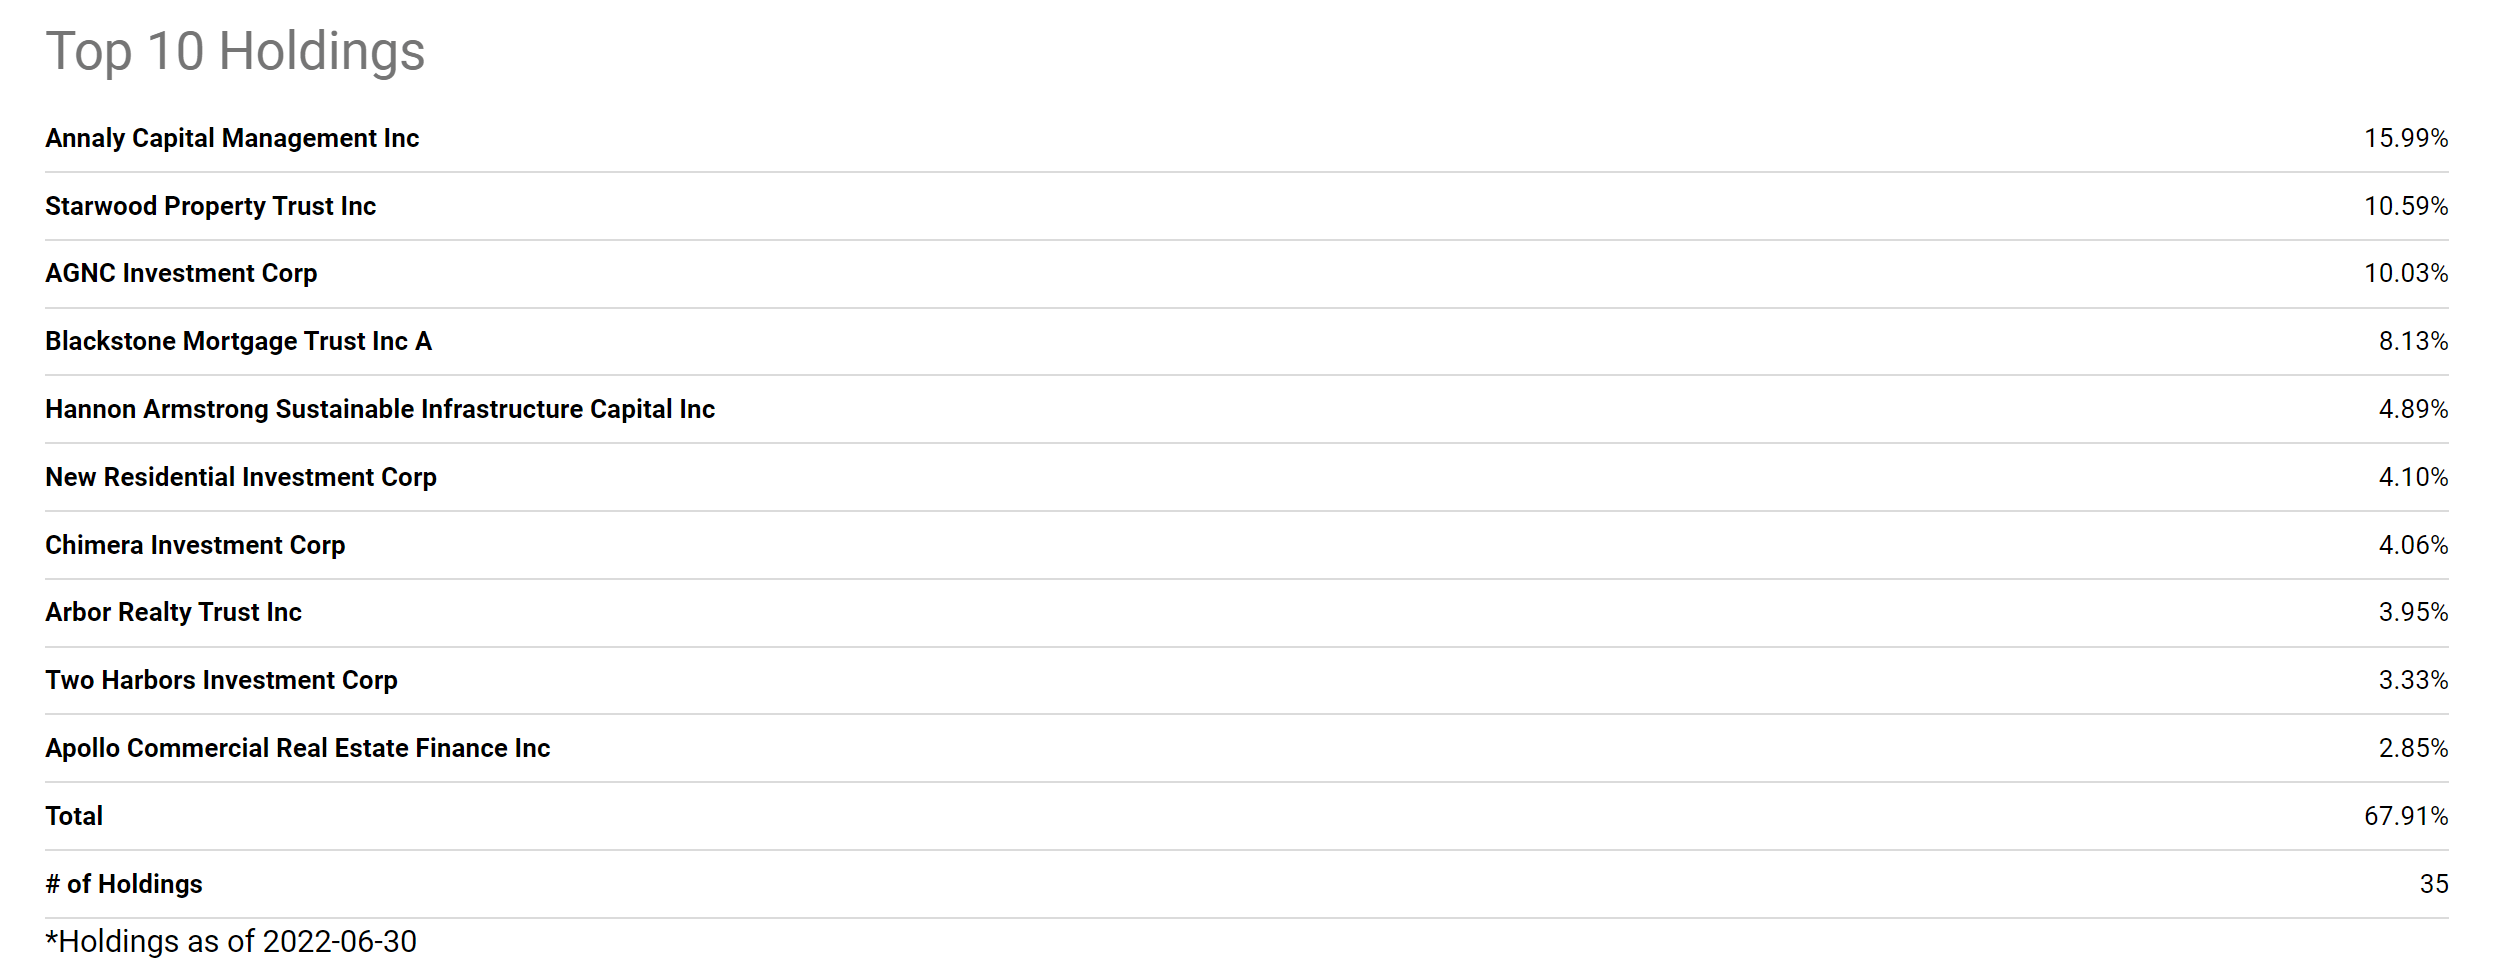
Concern 2: low dividends yields compared to historical average
In my view, the current yield does not properly compensate for the risks ahead. On the surface, its 7.2% yield is appealing when compared against the overall equity market (1.45%) or the treasury bonds (~2%). But as you can see from the following chart, its current yield is on the lower end of its historical spectrum. To be more specific, the dividend yield for REM has fluctuated in a wide range (another sign of large volatility risks) between as low as 3.4% and as high as 25% with an average of 10.09% in the past 10 years. Therefore, its current dividend yield of 7.24% currently is actually below its historical average by a substantial margin of almost 30%.
Seeking Alpha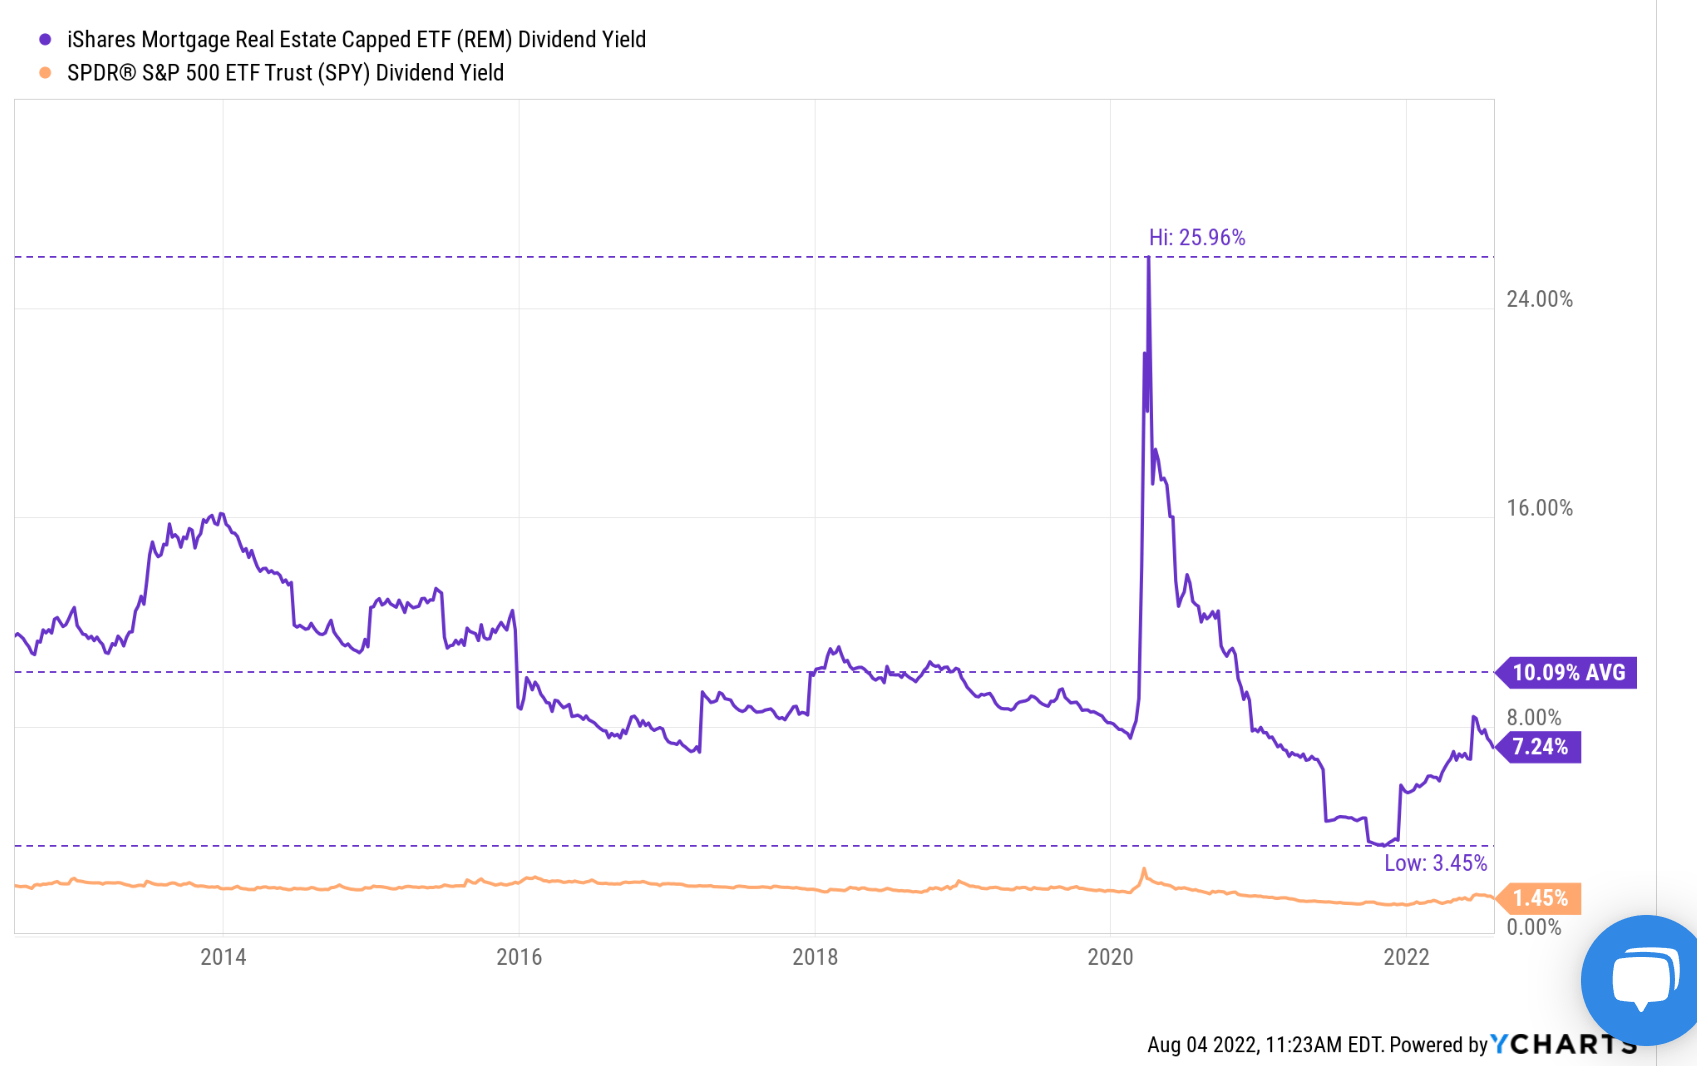
Concern 3: Leverage and volatility risks
As aforementioned, REM historically has demonstrated much large price volatility than the overall equity market. And the chart below illustrates its volatility in the longer term. The equity market (represented by the S&P 500) exhibited a long-term standard deviation of around 16%, while REM’s standard deviation has been about 23%. In terms of worst-year performance, the overall market suffered a 37% worst-year loss, while REM suffered 42%. And in terms of maximum drawdown, the overall market has suffered a 48% (which is nerve-wracking already because a 48% drawdown takes a 92% rally to break even). And REM suffered an even large drawdown of 57%, which takes a 132% rally to breakeven.
One fundamental reason for the large volatility is the use of leverage in the mREIT business. And as argued in my recent articles analyzing NLY and AGNC, my view is that these stocks are still highly leveraged. And hence I foresee such large volatilities to persist.
Portfolio Visualizer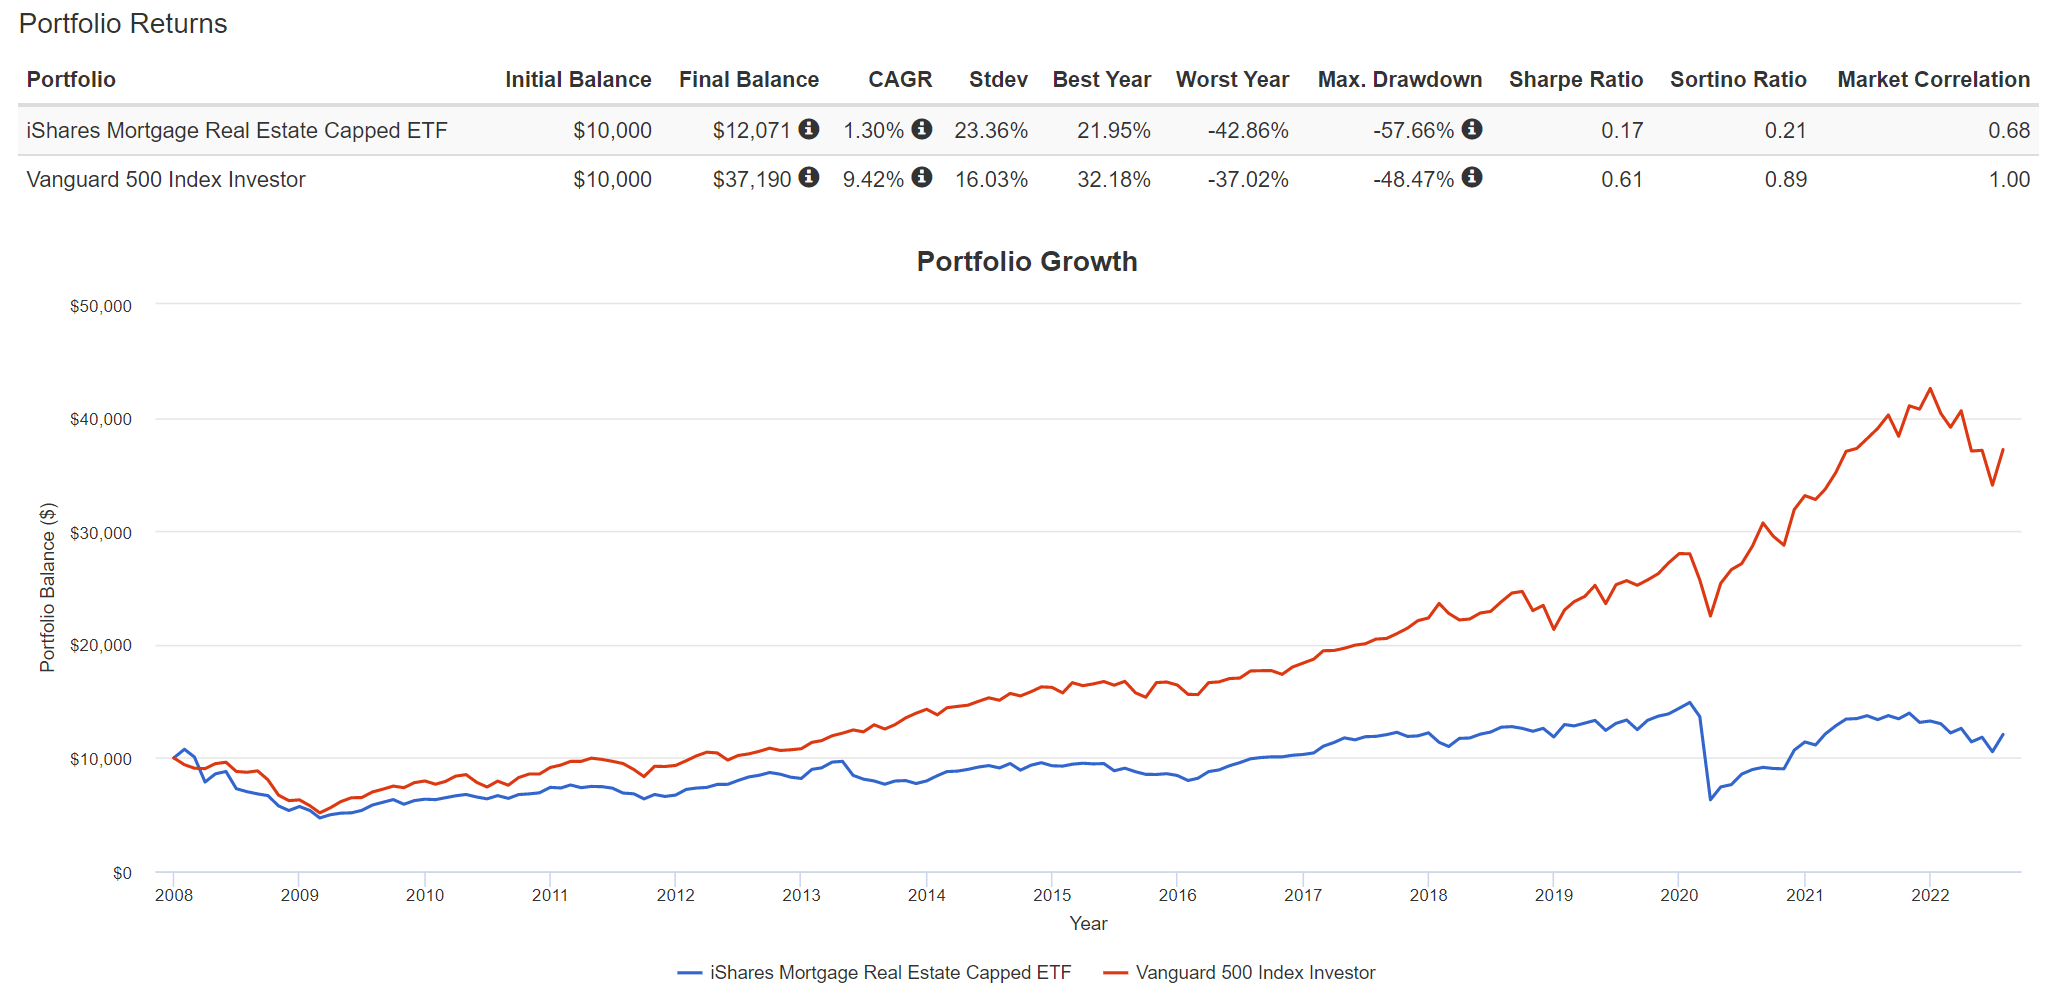
Tame volatility by diversification
As a workaround, investors could consider some diversification and hedging strategies to tame the volatilities and hedge the macroeconomic risks. REM is highly correlated to the overall market (correlation coefficient of 0.69), but weakly or negatively correlated to other asset classes such as long-term treasury bonds and gold.
As such, it is possible to set up a combined portfolio consisting of two or three negatively correlated assets, such as long-term treasury bonds and/or gold and REM. The following example illustrates the simple use of such a strategy:
Portfolio 1: 100% REM
Portfolio 1: 90% REM + 10% EDV
Portfolio 1: 80% REM + 10% EDV + 10% IAU
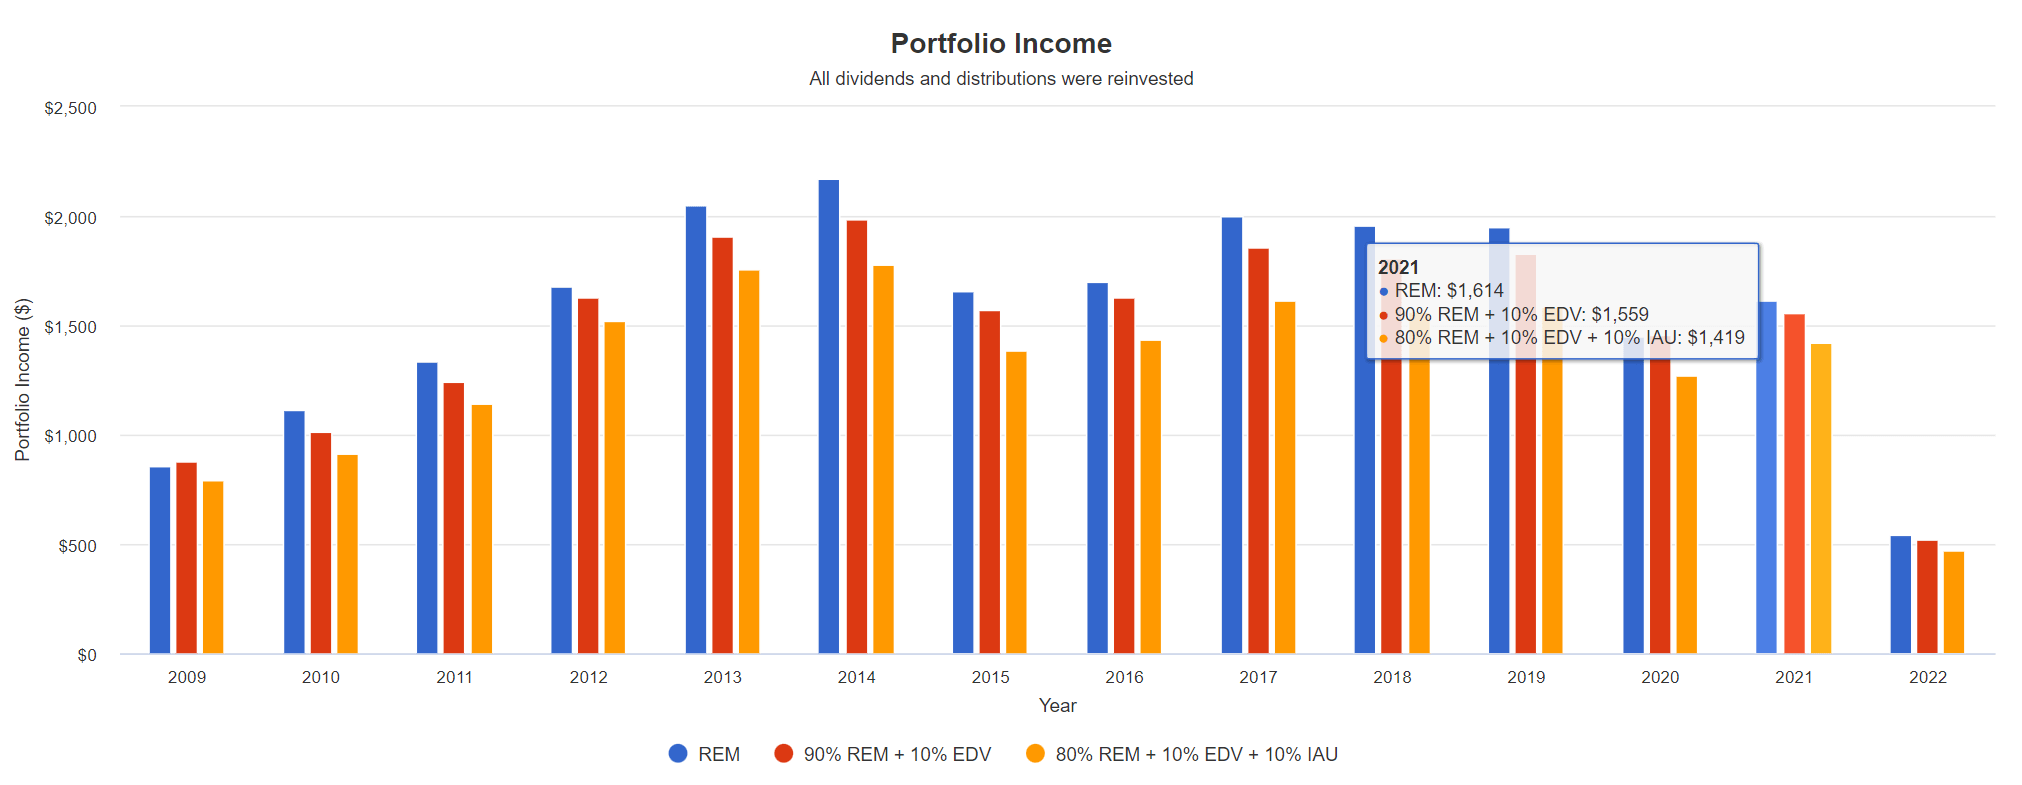
As can be seen in the next two charts, with the addition of 10% EDV and/or IAU, the combined portfolio significantly reduced the volatility in terms of the standard deviation (from 22% to between 17%~19%), the worst year performance (reduction of about 1/2 with EDV and IAU addition), and the maximum drawdown (from 57% to be between 44%~49%). The downside is that the dividend yield is also slightly reduced as you can see from the second chart, but not by that much.
Portfolio Visualizer Portfolio Visualizer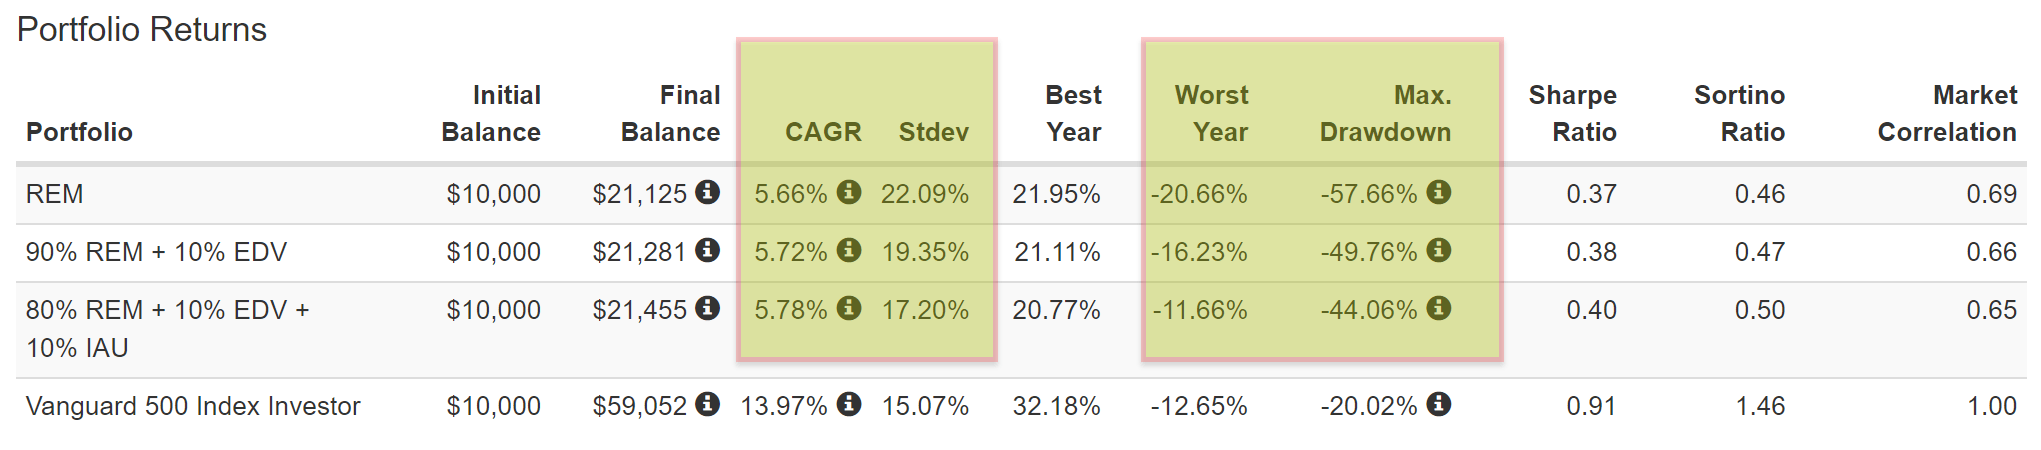
Final thoughts and other risks
Investors should be aware of the key potential risks before taking on REM. Its current yield of 7.2% is actually below its historical average by about 30%. Its large concentration risks and high leverage in its holdings will keep causing large volatility risks.
Besides these risks, its 0.46% fee is also relatively hefty for a passively indexed fund. Its total long-term return has been 1.3% CAGR since 2008 and 5.6% since 2009 when the great recession was excluded. And hence, the 0.46% fee represents a large portion of its return potential.
We do not hold REM ourselves (our REIT exposure is provided by RNP). But in general, we do apply the above diversification and hedging strategies as you can see from our actual portfolio shown below. But holding a balance mixed of different asset classes including EDV and IAU, our portfolio has been outperforming the market consistently with much lower volatility as detailed in our blog article here.
Author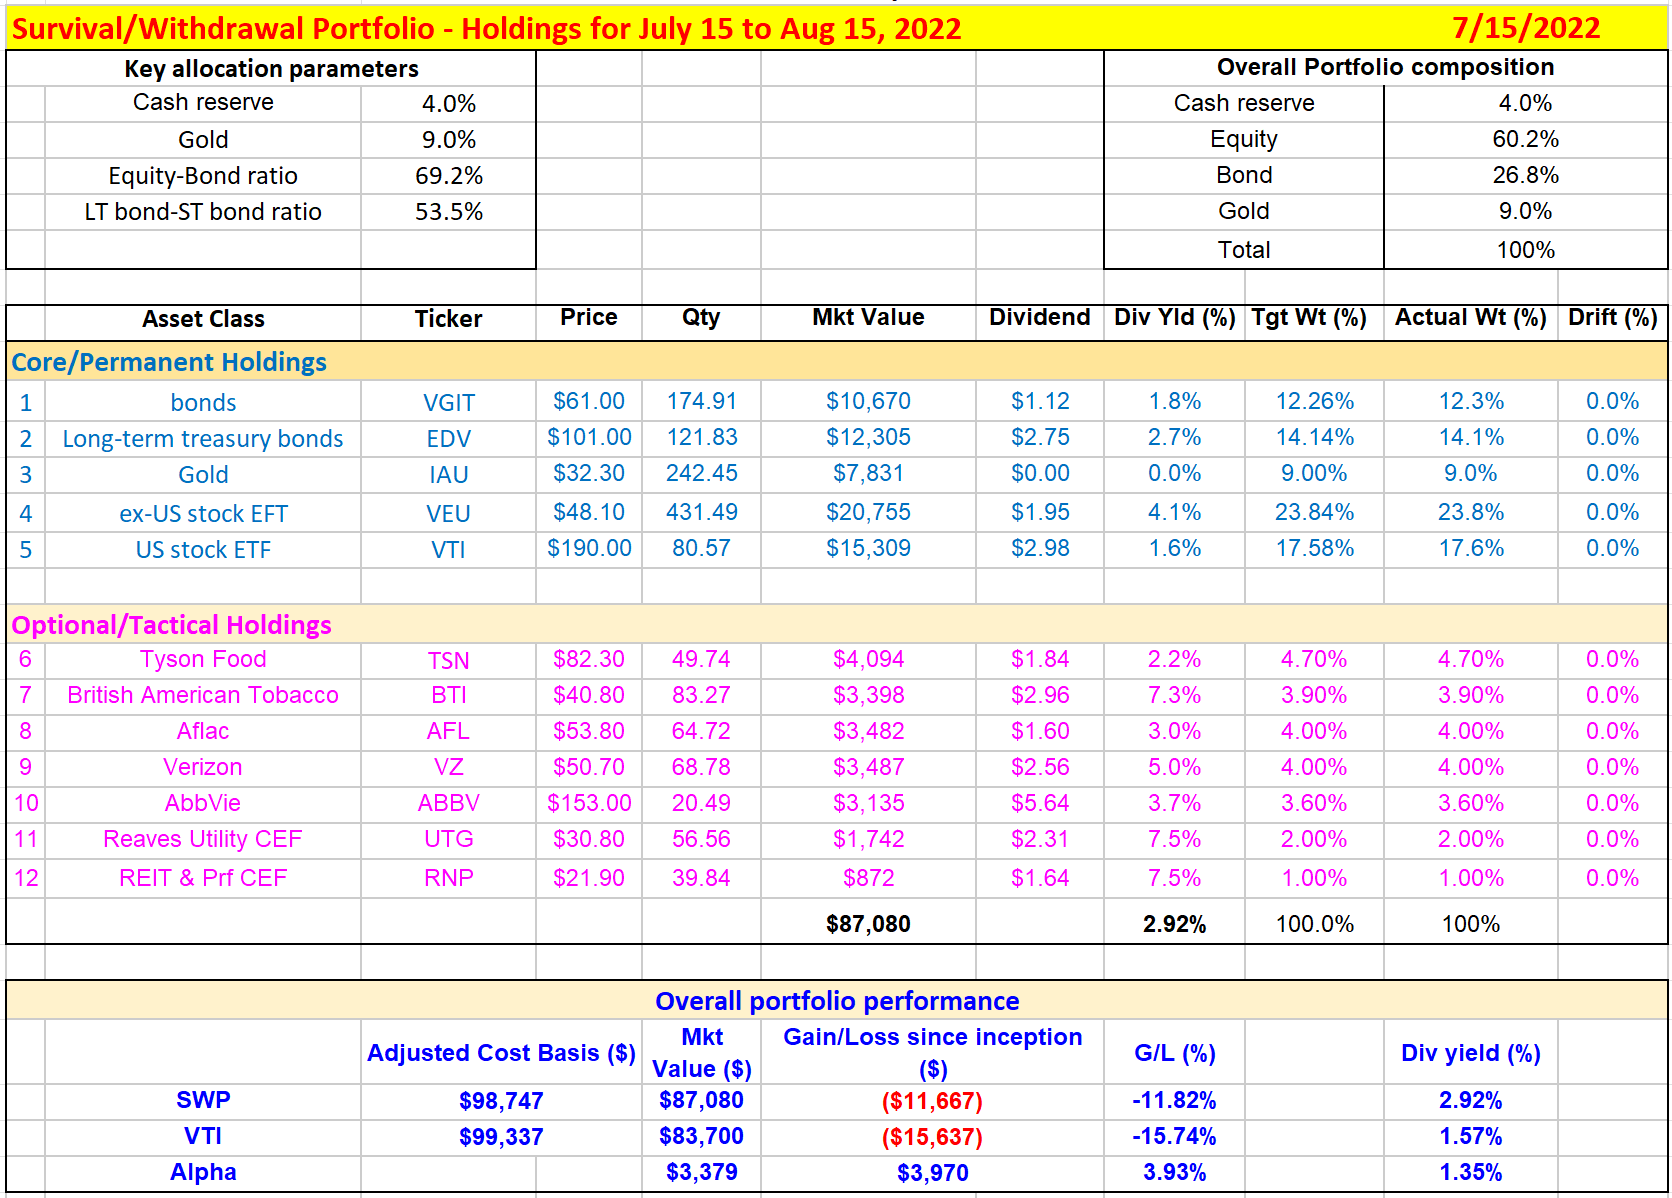
Be the first to comment