

Torsten Asmus/iStock via Getty Images
DISCLAIMER: This note is intended for US recipients only and, in particular, is not directed at, nor intended to be relied upon by any UK recipients. Any information or analysis in this note is not an offer to sell or the solicitation of an offer to buy any securities. Nothing in this note is intended to be investment advice and nor should it be relied upon to make investment decisions. Cestrian Capital Research, Inc., its employees, agents or affiliates, including the author of this note, or related persons, may have a position in any stocks, security, or financial instrument referenced in this note. Any opinions, analyses, or probabilities expressed in this note are those of the author as of the note’s date of publication and are subject to change without notice. Companies referenced in this note or their employees or affiliates may be customers of Cestrian Capital Research, Inc. Cestrian Capital Research, Inc. values both its independence and transparency and does not believe that this presents a material potential conflict of interest or impacts the content of its research or publications.
Take A Bow, Oil Bugs
The market this year has been unusual, to say the least. That a rotation from growth to value would take place was in the cards. The high-beta software stocks we cover put in relatively exhausted new highs in late Q3 and early Q4 2021 and sold off thereafter. Having called the market bottom within three days in March 2020 we also managed to call the market top within a few days late last year. (And the notes are still in our Growth Investor Pro service to prove it!). So, well done us. We felt smug.
But the unusual thing is the extent to which the energy sector has hogged money all year. How much money, you might ask? All the money, we would answer.
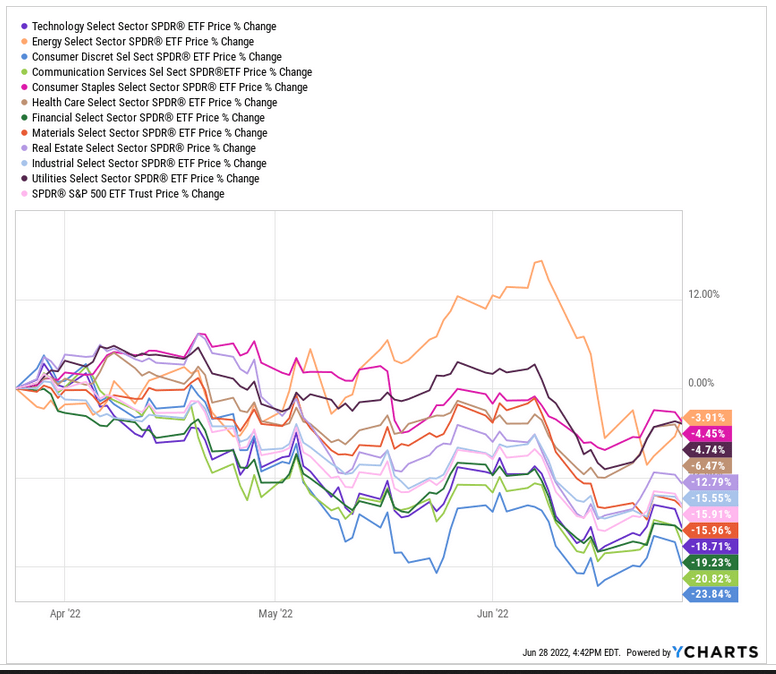
Here’s the S&P and its major sector components, 2022 year to date. We’ve used the SPDR family of ETFs for illustration purposes.

Sector Performance YTD (YCharts.com)
The only sector that is up this year is energy. So heading into 2022, if you’d sold down some growth names, felt rather smug about that, and rotated your capital into a diversified basket – some growth, some value, some commodities – and felt smug about that too – what happened? The market taught you what happens when you get smug. Because the only winning long strategy this year has been to buy energy. Oh, and fertilizer. So you were either an oil bug, in which case, kudos, or you weren’t, in which case, brickbats.
The question now is, has energy run its course or is now a good time to buy energy stocks?
Let’s take the bear argument first.
Sector Rotation
In our Growth Investor Pro service we focus on sector rotation with the Wyckoff cycle in mind – that is to say, we watch closely the degree to which institutional capital accumulates sectors, rides them up through the markup phase, distributes, then allows the air to come out in the markdown phase before repeating the exercise. If this notion is alien to you, take a look at this note which walks you through the idea. It’s an approximation of course, an idealized way to consider the market, but it has some utility. And in 2022, the flip side of energy hogging all the money is that it’s been likely that energy will move into the distribution and markdown phase at some point.
If you look at more recent sector performance, you can see that energy has given up some strength whilst other sectors have begun to recover.
In the last three months, all sectors have been down, but energy has been down the least – so, relative strength if not absolute strength over this period.
Sector Performance L3M (YCharts.com)
In the last month? All sectors down, energy down the most.

Sector Performance L1M (YCharts.com)
And in the last five days? Most sectors up, energy down a touch.

Sector Performance L5D (YCharts.com)
So you might conclude from this that capital was indeed rotating out of energy and into other sectors, and you might further conclude that you should do the same – pocket your energy gains and start accumulating positions in beaten-up sectors that everyone has written off forever, like consumer discretionary (XLY) or tech (XLK).
And in the short term this may not be a terrible idea. Certainly we had success recently in our subscriber alerts – we flagged the opportunity to go short XLE and USO on the basis of the charts of each. The XLE short we flagged to cover as it rebounded; USO short we believe can generate value still.
Here’s the chart logic for both short-term moves. First, XLE, which put in a Wave 1 up from the Covid lows peaking in late 2020, followed by a 0.786 retrace for a Wave 2 low in late 2020. Then a big Wave 3 up peaking a little above the 2.618 extension of that prior Wave 1. As the fund rolled over the top of that peak we flagged to our members a short opportunity. (We did so purely on the basis of sector rotation and technical analysis because as we shall discuss in a moment, we think the long energy play is far from done over a longer timeframe).
That XLE chart looks exactly like the QQQ chart from the 2018 lows to the 2021 highs. What QQQ did was – wave 1 up, 0.786 retrace down to the Covid lows, 2.618 Wave 3 up peaking in Q4 2021 and so far it has sold off down to a 0.5 retrace.
Now, as you know, XLE valuations are nothing like QQQ valuations at their peak, and if you were to zoom out you would see that XLE was on the floor in 2020, unlike the Nasdaq which had already run up big since 2009. So we didn’t expect a 0.5 retrace from XLE but we did think a 0.382 might happen – that’s the “Prudent Bear” target in the chart below.

XLE Chart (TradingView, Cestrian Analysis)
This was a righteous call as it turned out. XLE came within a dollar of that $68 target and has since reversed upwards. There’s a good chance that the upward move is a bounce in an otherwise ongoing downtrend, but as we never feel the need to be heroes we were happy to cover our short positions, take the money and go home.
We also have a short position in USO – because the chart looks like this to us.

USO Chart (TradingView, Cestrian Analysis)
We’ll see whether the move back up in recent days is sustained, in which case our short will stop out, or whether it’s a bounce that will reverse downwards, in which case we may hit one of our bear targets.
OK so – that’s the bear argument which is, the charts in many of the major energy names are in a downtrend after a big Wave 3 run up. This is purely a short term downtrend in our view, because the 5-wave cycle from the 2020 lows isn’t yet complete – we expect new local highs – above the levels just achieved – within a year or so.
And the bull argument?
Not Your Parents’ Cheap Energy
Zoom out for a moment. Let’s use the same two proxies – XLE and USO – for the energy market. And we can add in ICLN to take account of the new thing. In the last decade or so, energy has way underperformed the market. The reasons for this are much discussed elsewhere but at their core in our view relate to (1) the supply of cheap energy in its various forms through a liberalized world trading system where previously closed suppliers of commodities became integrated into energy and money flows, and (2) policy in developed nations designed to reduce dependence on fossil fuels and increase usage of renewables… policies which have not been successful as is now well known.
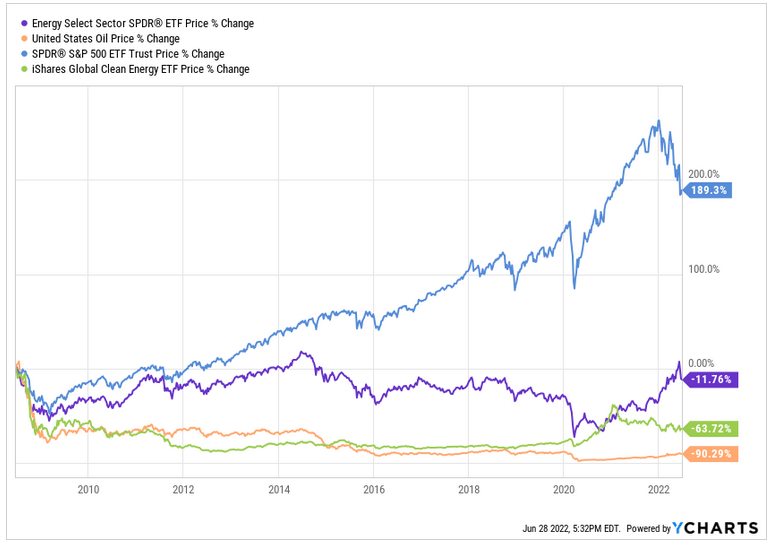
Energy Sector Performance Since 2009 (YCharts.com)
Energy is becoming scarce as populations grow, power demands increase, restrictions on fossil projects continue, and power yield improvements in clean energy methods continue to advance at a snail’s pace. That in our view is a recipe for energy stocks to rise long term – demand up, supply constrained, corporate profits in the sector up, stocks up. No doubt it will not be that linear a move but that’s the direction we see this sector taking, long term.
So is it a good time to invest in energy stocks?
Bottom Line
Well, it depends of course. If you have a fistful of petrodollars burning a hole in your pocket, is buying XOM or CVX or their brethren, buying them right away, a bad idea? Probably not, as long as you are looking long term. But if you are patient, we think the headline stocks have run up a lot in recent months and whilst they can probably be bought safely now if you have a 10+ year horizon, we suspect there will be a better day than today to buy them more cheaply. Maybe wait to see if XLE falls back again and, if it does, buy some of its parts once it has found support.
Our own top picks in the energy sector have actually shown sustained weakness of late, and that’s because they trade far more with risk sentiment than they do with sector earnings. As both short- and long-run picks we believe that two of the key stocks in the uranium sector hold appeal.
As you no doubt are aware, nuclear energy remains the missing link in the desire to both de-emphasize fossil fuels and generate enough base load for enough of the time, which cannot be achieved with wind and solar alone nor, it seems, with the present levels of renewable and fossil generation. Slowly, governments are coming around to the notion that more nuclear plants will have to be built. The spin-up time is not short for such projects; you can measure the time from breaking ground to delivering first electron in decades. Nuclear has been sucking wind for decades now, a victim of poor PR, psychological association with nuclear weaponry, and a mistrust of the science akin to believing that aliens or ghosts must inhabit the TV, because how else could it have people inside of it? It is from this low base we believe the uranium sector offers such promise.
We believe Sprott Physical Uranium Trust (U.UN in its native Canada, OTCPK:SRUUF for the US instrument) and Sprott Uranium Miners ETF (NYSEARCA:URNM) are both sound picks. If you can get comfortable with the fundamental demand drivers in the sector, as we have, it becomes rather interesting to consider the stock chart performance of each name. They trade exceptionally well to technical patterns, and this is because in our view the sector is heavily sentiment-driven. For instance, at a time when energy has been the darling of the market, when it has become very apparent that over-reliance on renewables has been a policy error across the West, the uranium sector has actually sold off hard, in line with other assets deemed to be high risk. This, we believe, presents a double opportunity. Firstly, at some point the market will remember that it likes risk and risk assets will go up. We would expect U.UN / SRUUF and URNM to benefit from such a shift. And secondly, if the current policy moves towards increased nuclear plant builds continues, we anticipate long-run gains to apply to the stocks too.
Let’s take a look at the charts for each. We’ll start with the pureplay, U.UN (the chart logic for SRUUF is similar).

U.UN Chart (TradingView, Cestrian Analysis)
U.UN put in five waves up off the 2020 lows, with normal retracements and extensions. The stock peaked at around CAD20 in April this year, then sold off hard. Were you to plot a retrace of the whole move up above, you would see that thus far it had bottomed thus far at around the 50% retracement of the whole post-Covid move up.
Another way to look at how the stock has moved is within this trading channel:
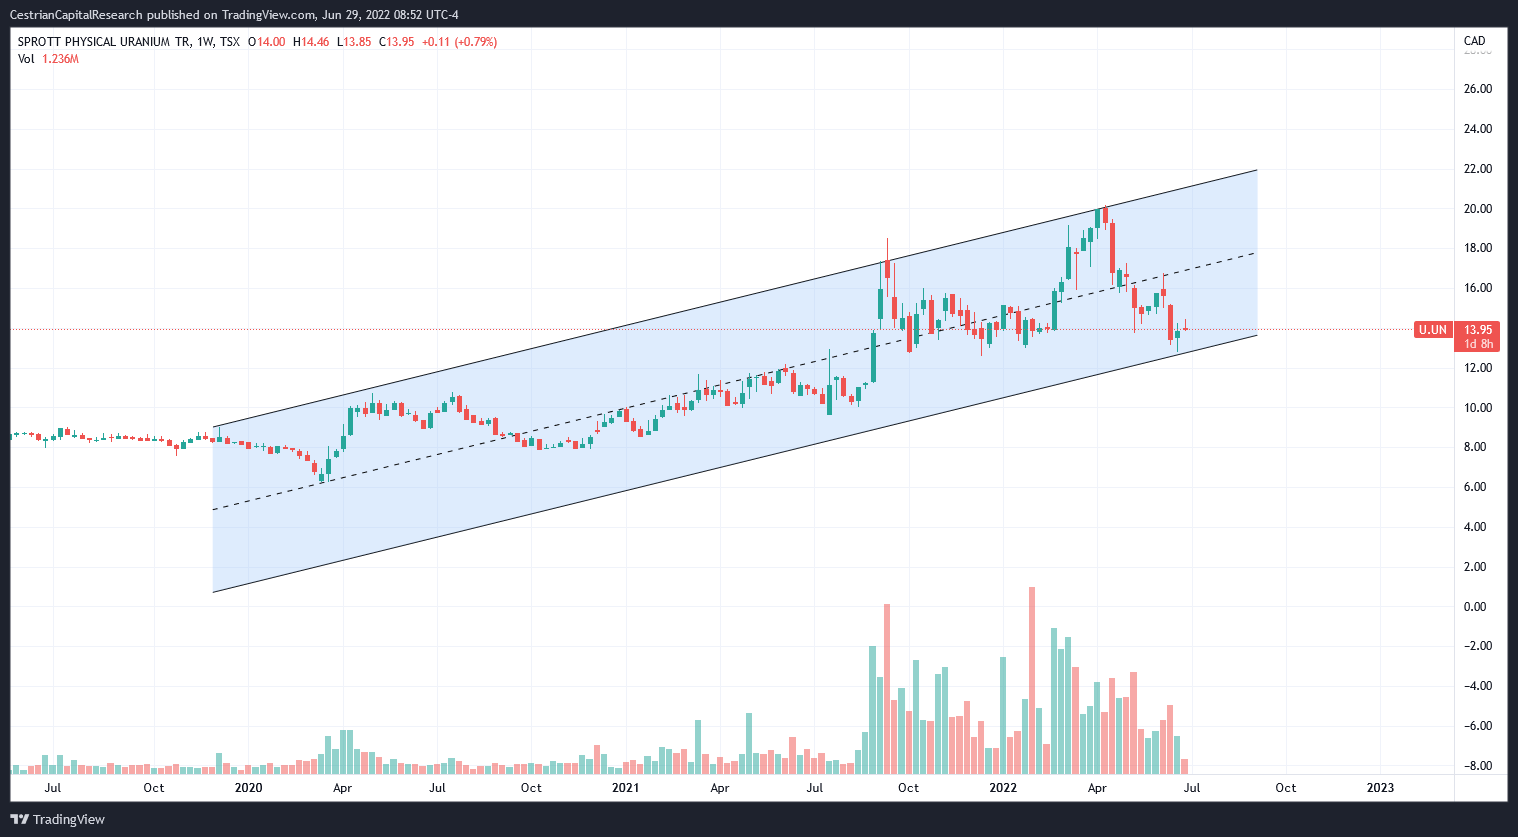
U.UN Chart II (TradingView, Cestrian Analysis)
The dotted middle line in that channel has acted as a magnet for some time now; we believe short-term upside is available from here to around CAD17 where the middle line will likely next act as resistance to the stock – that would be around 20% up from here, and the proximity of the recent low means a stop-loss can be used that isn’t so far away as to be useless. And looking long term, we believe U.UN is a sensible decade-long hold based on trends in the power generation market.
Let’s take a look at URNM, whose top holdings are mainly miners, together with a dose of U.UN itself.
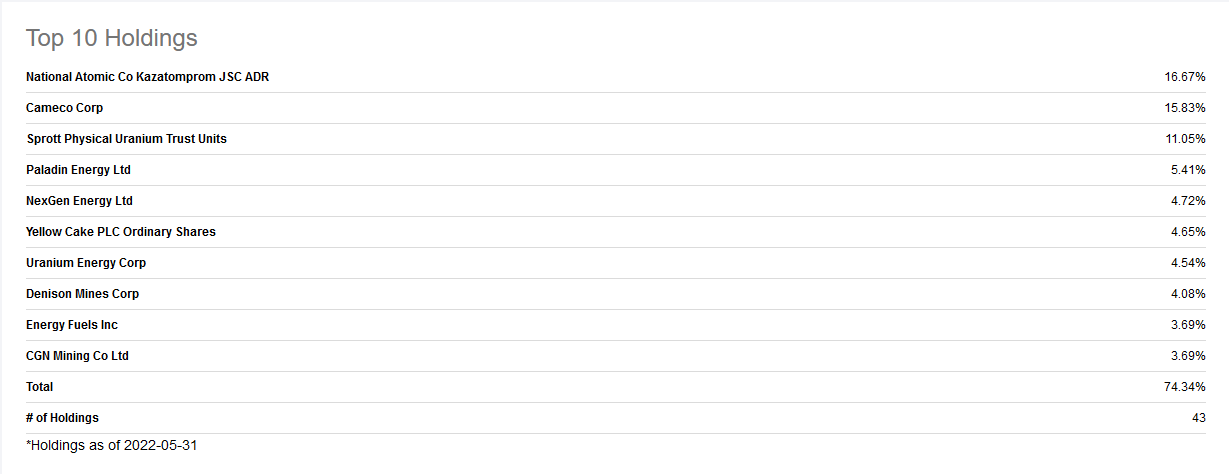
URNM Top Holdings (Seeking Alpha)
Here’s the chart.
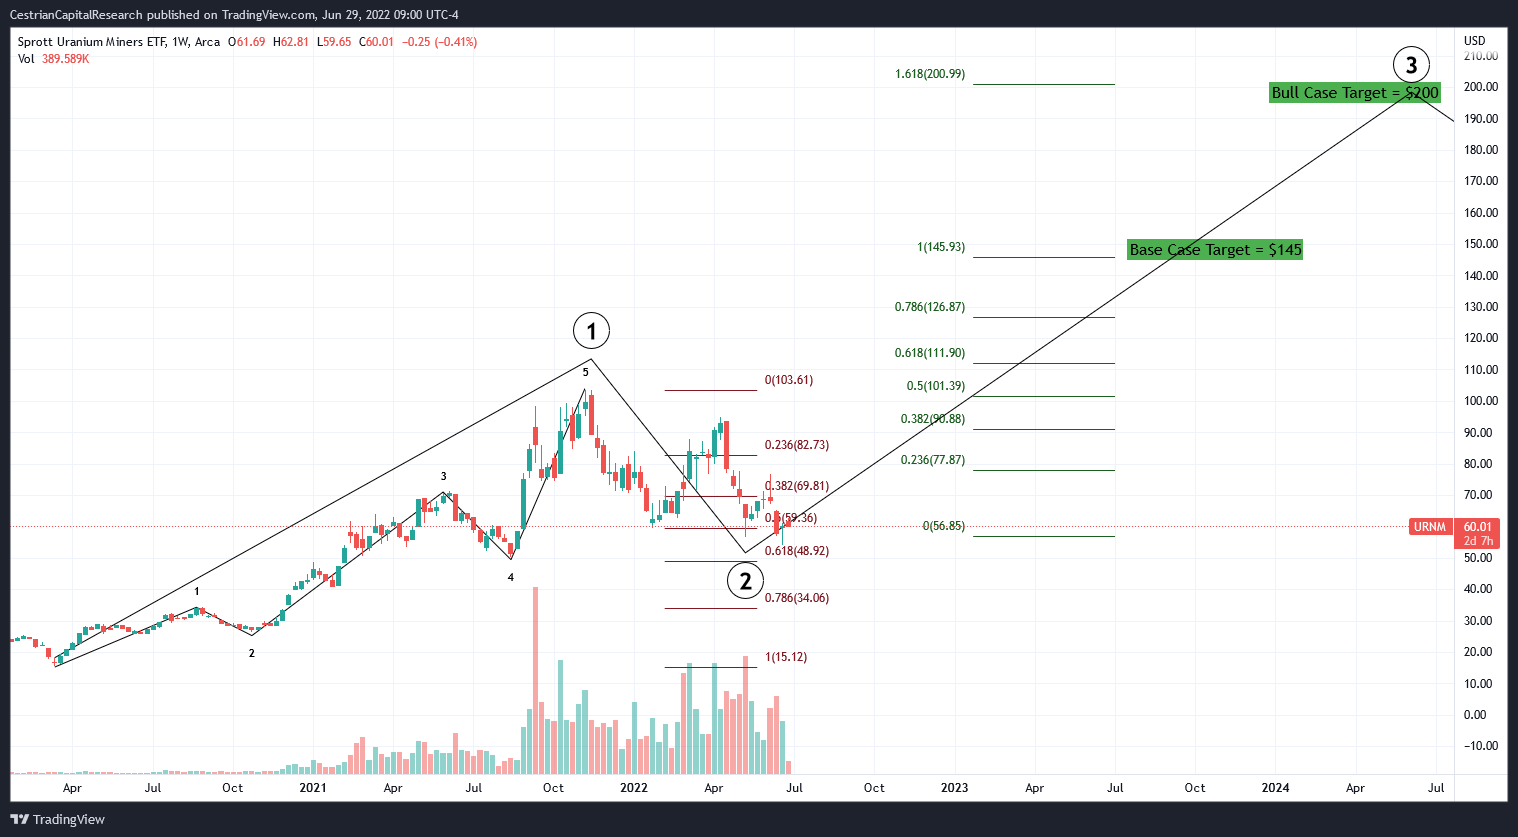
URNM Chart (TradingView, Cestrian Analysis)
Again, from the 2020 lows a textbook set of five waves up peaking in late 2021 – again with risk assets, not in line with the energy sector itself. If you zoom out and remember the fractal nature of Elliott Wave charts, that five waves up makes a larger degree Wave 1. It’s followed by a larger degree Wave 2 which has thus far found support at between the 50% and 61.8% retracement levels, in line with typical patterns. If that bottom holds then we believe URNM can move up to make new highs at between $145-$200/share – $145 is the 100% extension of that larger degree Wave One, $200/share is the 1.618 extension – both those levels are common in such wave charts.
So in conclusion – it may very well be a good time to buy energy stocks at large, at least looking long term, but for us the recent run up in the standard names keeps us mostly on the sidelines. Uranium sector names however offer all the long run potential that do the more common energy stocks – your XOMs, CVXs and so forth – but right now are all beaten up and in our view offer more short term gain potential than do the majors. U.UN / SRUUF and URNM are our two top picks. We own URNM in staff personal accounts and anticipate buying back into U.UN in due course (having made solid gains from its prior runup).
Cestrian Capital Research, Inc – 29 June 2022
Be the first to comment