

Mrkit99
Context of the article
There are plenty of sub-plots surrounding International Business Machines Corporation (NYSE:IBM), but this article will primarily focus on the dividend narrative which has proven to be a huge differential over time. The image below highlights the pronounced impact that dividends have made on IBM’s total returns since its listing date.
YCharts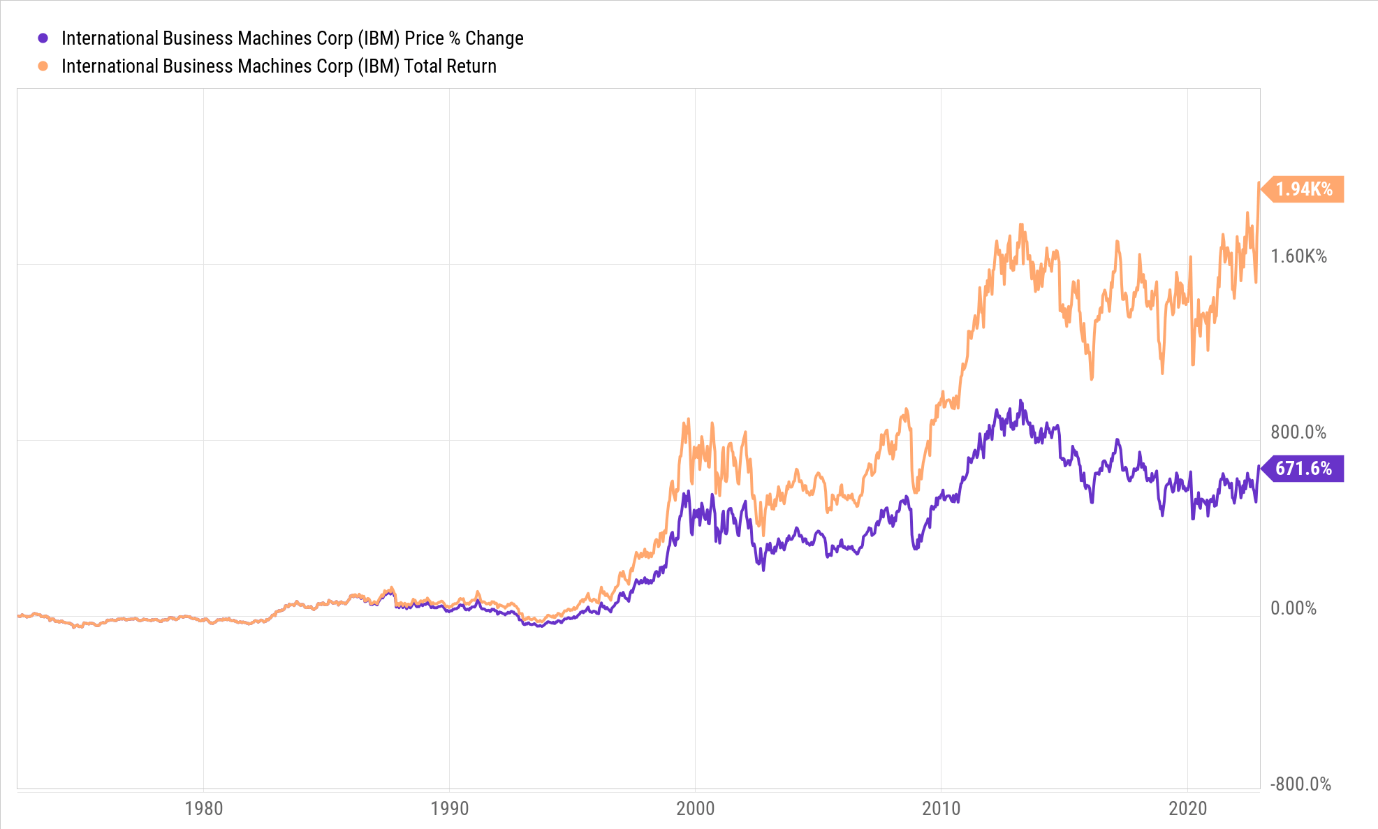
Gauging IBM’s dividend profile in isolation felt like an incomplete exercise so I’ve compared it to all the other blue-chip tech stocks that comprise the Dow Jones Index.
I will conclude the article by touching on the technical and valuation facets of IBM.
How Good Is IBM’s Dividend Profile Relative To Its Peers?
Besides IBM, 5 other tech stocks comprise the Dow Jones, namely- 1) Intel (INTC), 2) Cisco (CSCO), 3) Microsoft (MSFT), 4) Visa (V), and Apple (AAPL). The end goal is to arrive at a composite dividend score by judging these stocks under four broad parameters. These parameters include:
Yields (Stocks with higher absolute yields and a higher positive variance relative to their respective historical averages receive higher scores)
Payouts (Stocks with stronger dividend covers and larger “cash” payouts receive higher scores)
Consistency (Stocks with an extended history of paying and growing their dividends receive higher scores)
Growth (Stocks that have been able to grow their dividends at larger rates, on a short, medium, and long-term basis receive higher scores)
IBM will pay yet another quarterly dividend on the 10th of December to the tune of $1.65. At the current share price, that would translate to a forward dividend yield figure of nearly 4.5%, which is quite tasty for a growth stock! Indeed, relative to other tech options from the Dow, only Intel currently offers a more attractive number (5.17%).
Whilst that 4.5% number in isolation, is one of the attractive facets of the overall dividend profile, it isn’t wholly compelling when you consider the historic norm. To expand on this, IBM’s current yield is 34 bps lower than its 5-year average. Besides, amongst all the other options, only AAPL stock is more poorly-positioned relative to its historic average (current yield differential of -77bps vs the long-term average).
Then when it comes to the payout, IBM’s low dividend cover brings down its overall score, but I believe investors should attach greater importance to the “cash” dividend payout ratio (not just the payout ratio). The traditional cover ratio can often be skewed by a number of accounting shenanigans but the cash dividend ratio considers how much of operating cash flow is paid out after preferred dividends and CAPEX outlays are accounted for.
Note that IBM comes out right on top here, with a cash payout ratio (~85%) well ahead of its peers (peer set average of ~25%). Looking ahead, investors ought to be comforted by the fact that IBM will likely generate ample FCF to cover its dividends. In Q4 alone it looks set to generate $6bn of FCF (during 9M-22 it only generated $4.1m in aggregate) and over the next 2 years, I believe we could be looking at an additional $25bn of FCF (considering the 2022-2024 FCF target laid out in Oct 2021 was $35bn)
Another area where IBM really shines is the longevity with which it has been paying (33 years) and growing (23 years) its dividends. On both these metrics, IBM garners the highest scores. Given this long track record, you would think that it would take an egregious turn of events for the company to stop paying dividends. I believe if any compromises are to be made with shareholder returns, that will be seen on the buyback front, which has already been put on hold on account of the Red-Hat acquisition.
Whilst the long track record is commendable, has the dividend growth been compelling enough? Unfortunately not. Be it on a 3-year basis, 5-year basis, or 10-year basis, IBM’s dividend CAGR rates are all largely below average.
To conclude, whilst IBM longevity, cash payout, and absolute yield are worth commending, the pace of growth and current differential vs the historic average make it less alluring. Overall, IBM’s composite dividend score falls behind the likes of Visa, and Microsoft who appear to have more well-rounded dividend profiles.
Seeking Alpha, YCharts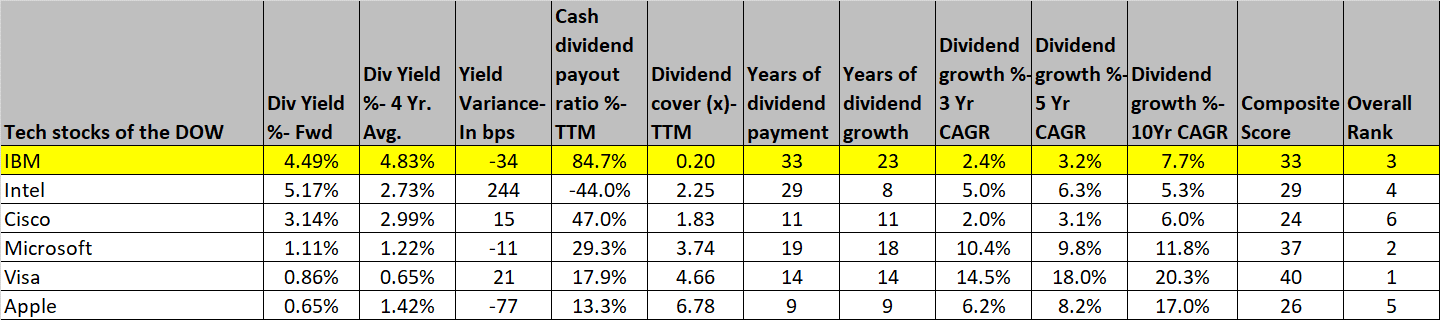
Closing Thoughts- Is IBM Stock a Buy, Sell, or Hold?
With regards to some of IBM’s other sub-plots, it doesn’t look wholly compelling.
Firstly, let’s focus on the technicals. As you can see from the image below the IBM stock has largely underperformed the Nasdaq since Arvind Krishna took over as CEO of IBM on April 6th, 2020. It’s only recently – post the Q3 results – that the stock has begun to demonstrate some signs of alpha.
YCharts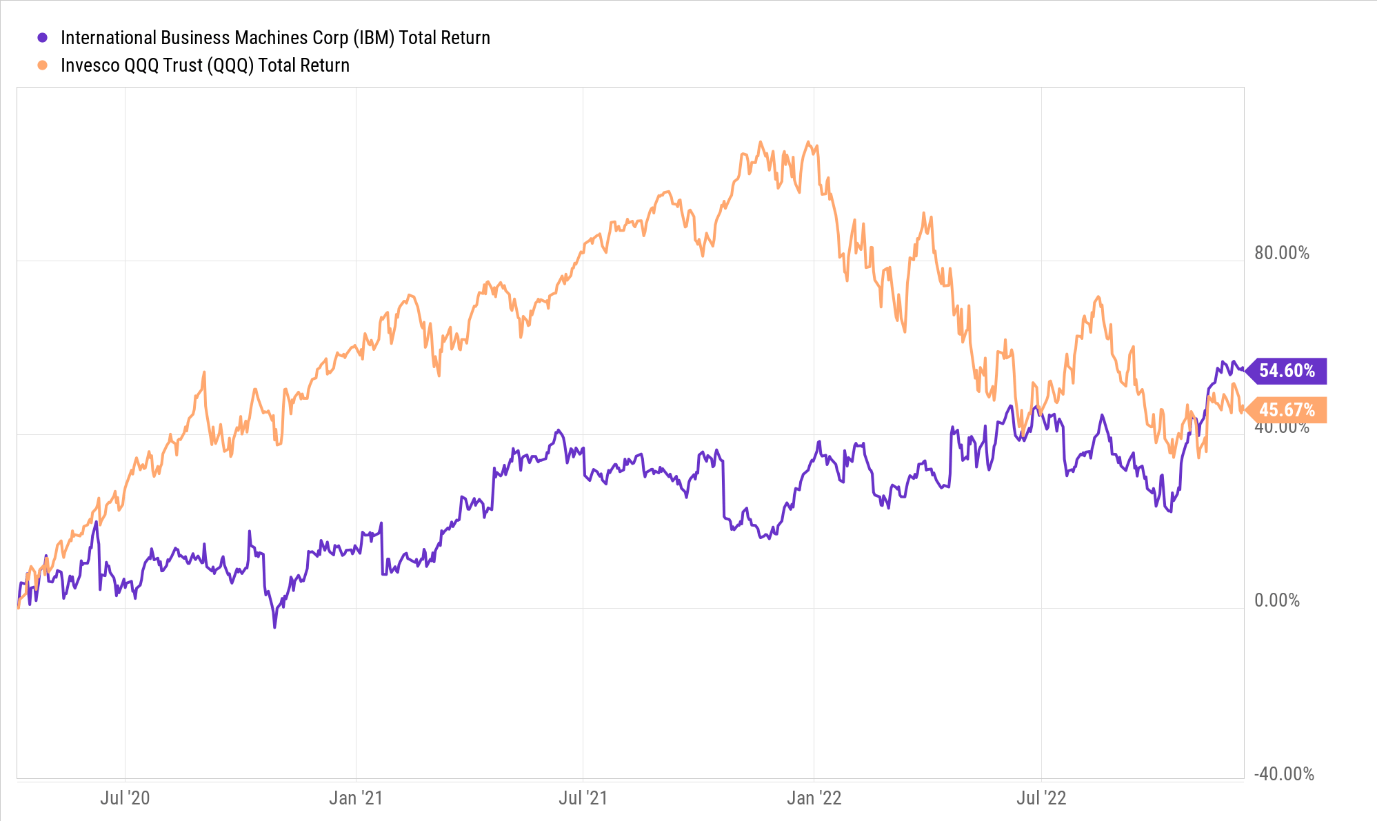
Momentum investors would likely be enthused by the recent bout of outperformance, as it also looks like we could be on the cusp of a potential ascending triangle breakout. I’m not dismissing the prospect of a breakout, but if you’re someone who also attaches a lot of importance to the risk-reward dynamics, it is questionable if this is the best price zone to get in. I say this because over the last 5 years, we’ve seen 5 previous instances, where the stock has run into some stumbling blocks around the $145-$150 levels and pivoted from there. The other point to note is that since October, the move has largely been pretty unidimensional, and you’d want the stock to pause and take a breather if we are to see a more sustainable uptrend.
Investing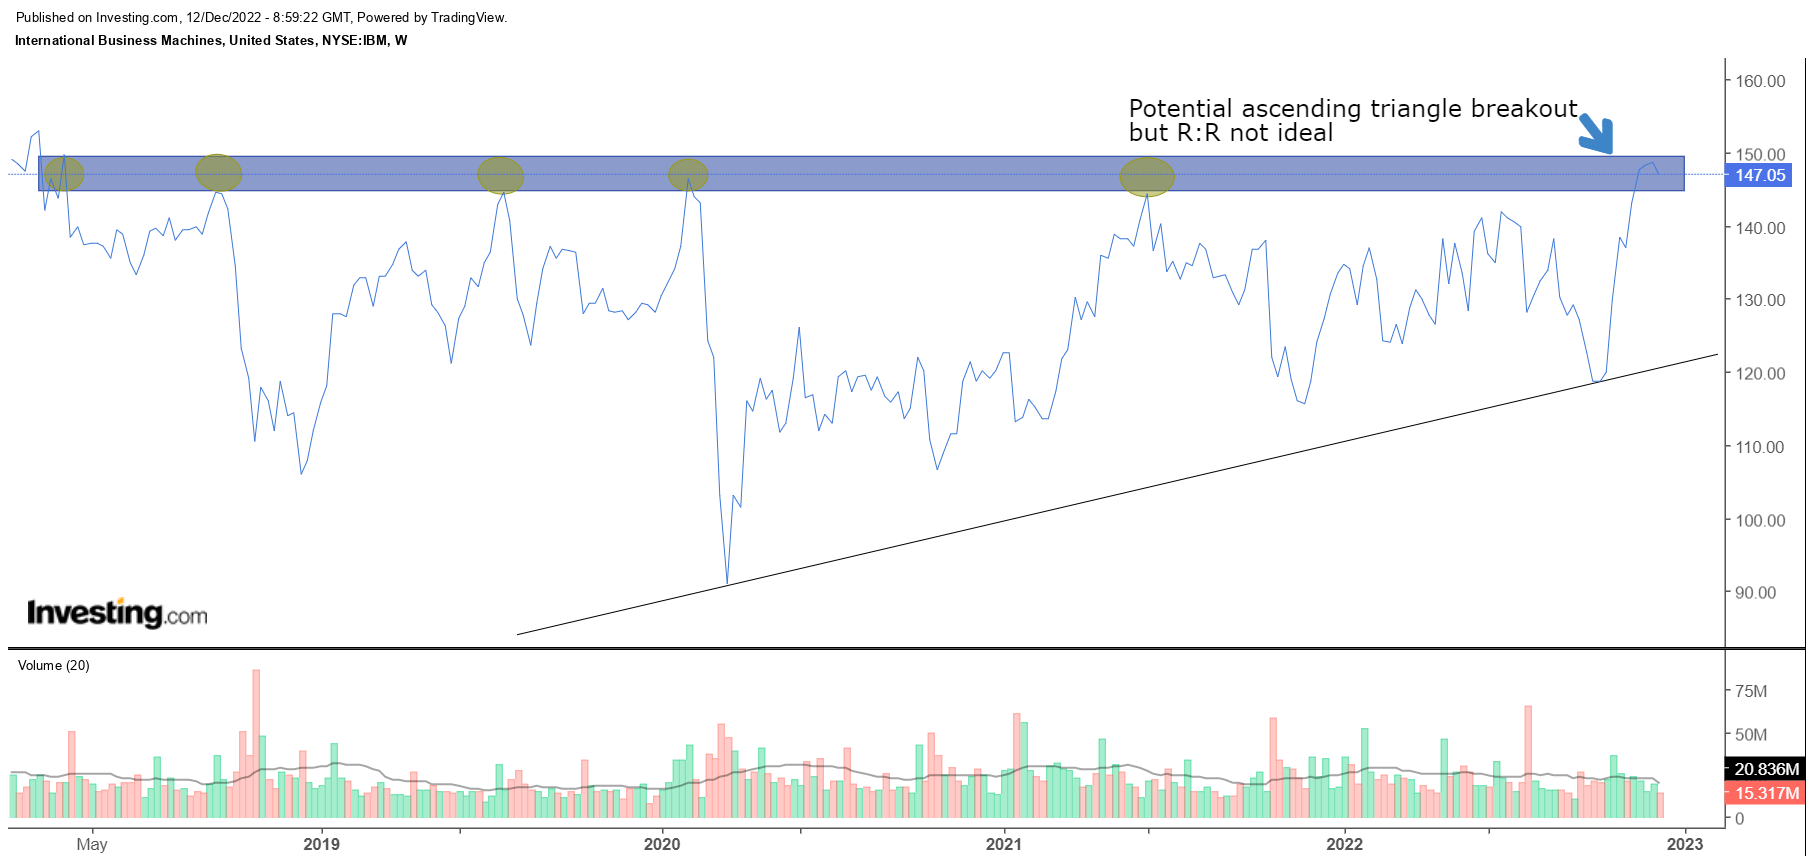
What also makes IBM a sub-optimal bet at this juncture is its positioning relative to other tech dividend aristocrats. Back in August, one could have made a case for IBM as a mean-reversion play in this space, but currently, the relative strength ratio of IBM and the ProShares S&P Tech Dividend Aristocrats ETF (TDV) is above the mid-point of its long-term range. Also note that at the 2.6 level, one typically starts to see this ratio decline.
Stockcharts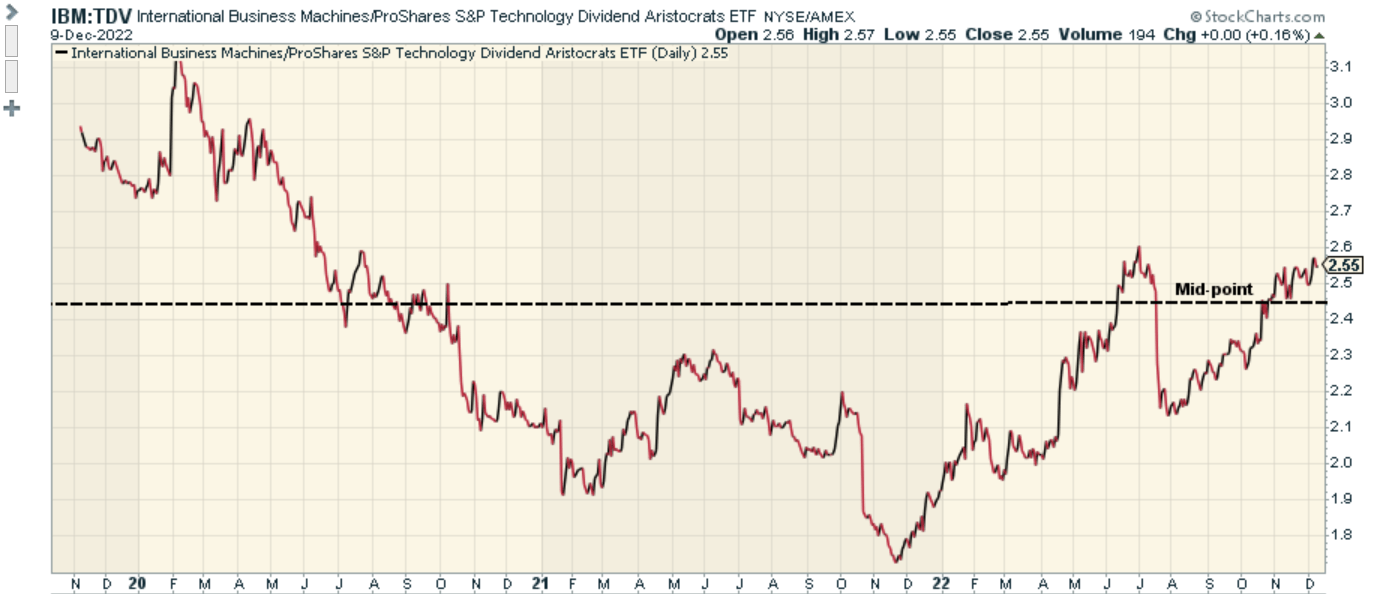
To conclude, it’s also worth considering that forward valuations based on the FY23 numbers don’t look entirely appealing at this juncture. According to YCharts, the stock now trades at its highest valuation in one-and-a-half years, with a forward P/E of 15.28x, which also comes in higher than the 5-year forward P/E average of 14x. IBM is a HOLD.
Be the first to comment