

pictafolio
Investment Thesis
AT&T Inc. (NYSE:T) stock has had a rough year, despite its exemplary results thus far. The company reported tremendous growth in its subscriptions, with FQ2’22 bringing 22.2% YoY growth in the postpaid phone segment to 68.3M and 4.27% YoY in the Fibre segment to 6.6M. Assuming similar rates ahead, we may see T report up to 69.2M and 6.9M in subscribers growth in FQ3’22, indicating significant net adds of up to 900K and 300K, respectively, similarly QoQ. Impressive, compared to Verizon’s (VZ) lower postpaid phone net adds of 12K and total broadband net adds of 268K in FQ2’22.
S&P Capital IQ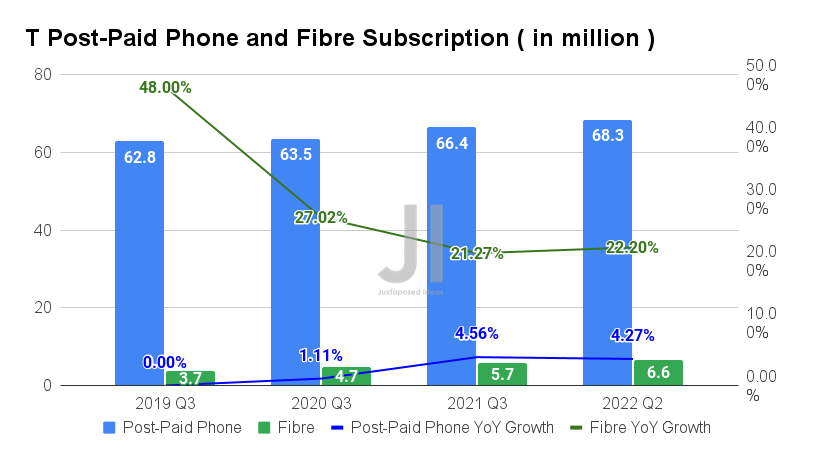
T 5Y Stock Price
Seeking Alpha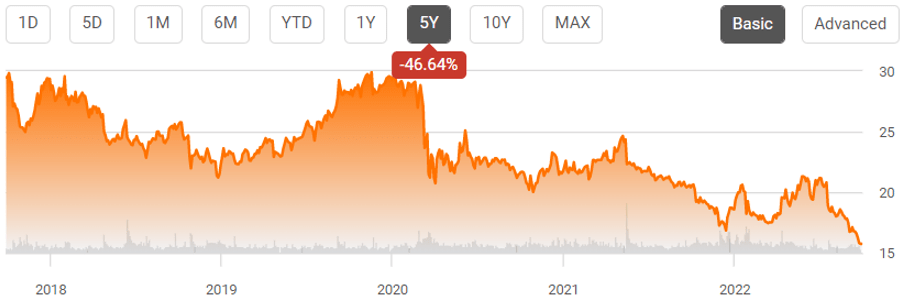
However, it is also immediately evident that the pessimistic market had discounted T’s forward potential, given the drastic plunge the stock had suffered at -18.03% to $15.73 YTD, against the S&P 500 Index decline of -23.96% to $3,647.29 YTD. Mr. Market’s worst fears are already here, with the latter breaking its previous June bottoms of $3,666.77, prompting a global sell-off further pushing the market downwards.
S&P 500 Index
S&P Capital IQ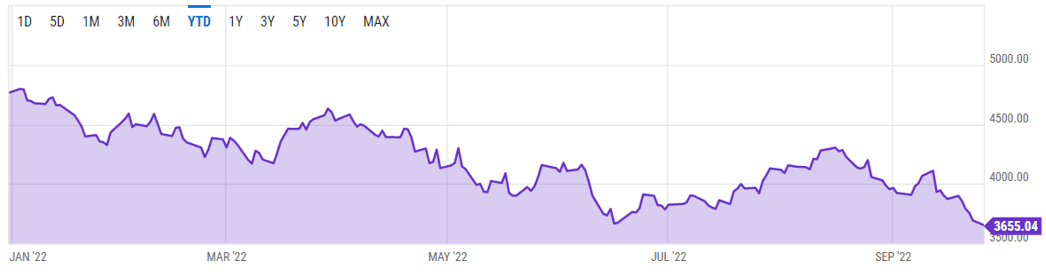
The last time that the S&P Index fell drastically was during the start of the pandemic in 2020 at a -30% plunge, the 2008 recession at -48%, and between 2000 and 2003 at -45%. With the Fed’s aggressive interest rate hikes through 2023 potentially bringing forth the unwanted recession, we might be in for more agonizing retracement ahead, with the time of maximum pain unlikely here yet.
Therefore, investors would be well advised to patiently wait a little longer, since we may see T hit the low $10s soon, if not single digits. Since its earnings call on 21 July, the stock has shed -23.19% of its value, losing an eye-watering sum of $74.1B in Enterprise Value as well. With little to no short-term catalysts for recovery, the whole market seems on the path to destruction with the bear continuously mauling the index. In contrast, the T stock at $9.5 would bring forth an interesting yield of 11.68%, heralding an attractive entry point for dividend hunters.
Only time will tell, though we must also highlight its underwhelming performance thus far, with a 5Y Total Price Return of -26.8% and 10Y Return of -2%. There are many better stocks out there with improved returns that are worth investing in, instead of this one.
Mr. Market Is Cautiously Confident About T’s Long-Term Profitability
S&P Capital IQ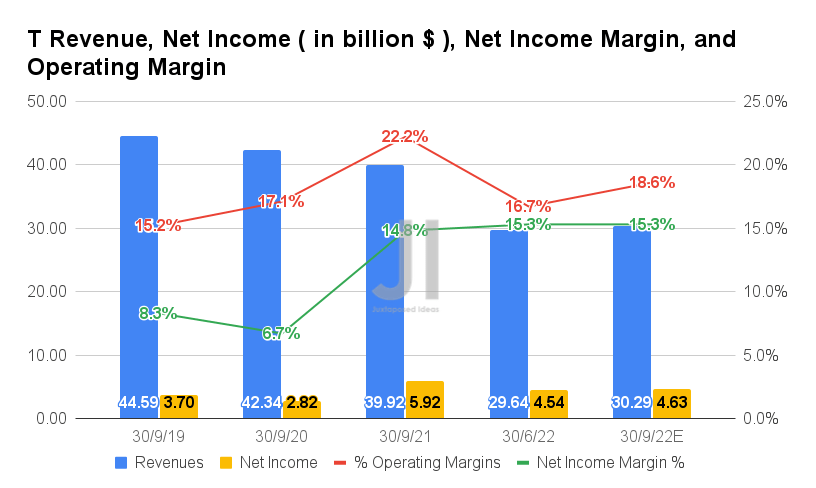
For FQ3’22, consensus estimates that T will report revenues of $30.29B and operating margins of 18.6%, representing an increase of 2.19% QoQ/3.66% YoY (post forma) and 1.9 percentage points QoQ, respectively. In the meantime, T is expected to report net incomes of $4.63B and net income margins of 15.3%, indicating an increase of 1.98% and in line QoQ, respectively.
T’s Long-Term Debts As Of FY2021
Seeking Alpha
In the meantime, T has been impressively deleveraging by -15.04% or $24.21B over the past six months to total long-term debts of $129.74B in FQ2’22. Though another $6.21B will be maturing within the year, we are not overly concerned for now, since analysts are projecting that T will generate up to $5.05B of Free Cash Flow (FCF) in FQ3’22. The FQ3’22 FCF margins of 16.7% will also indicate YoY growth of 3.8 percentage points, projecting improved profitability ahead.
S&P Capital IQ S&P Capital IQ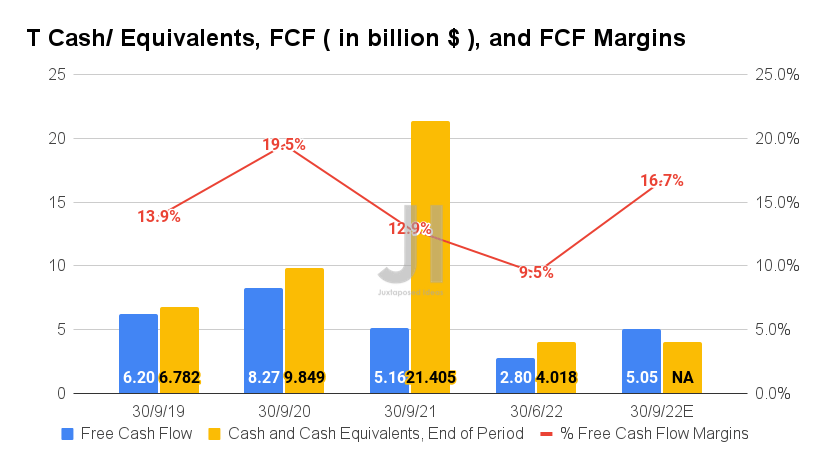
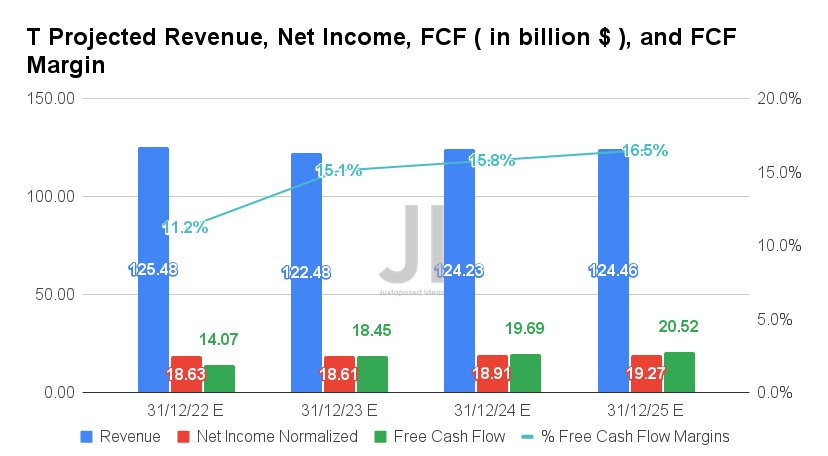
Over the next four years, T is expected to report relatively inline revenue growth, while massively improving its net income margins from 7.7% in FY2019, to 11.9% in FY2021, and finally to a stellar projected 15.48% in FY2025. Clearly, the Warner Bros.’s divestiture has massively benefited its core telecom margins. In the meantime, the company’s FCF generation is expected to improve marginally to $20.52B with FCF margins of 16.5% by FY2025, compared to FY2019 levels of 16% and FY2021’s 15.1%.
In the meantime, T is expected to report revenues of $125.48B in FY2022, representing YoY growth of 3.41% (post forma), while reporting net incomes of $18.63B at the same time. Analysts will also closely watch its FQ3’22 performance in October, given its ambitious guidance of generating $10B cash flow in H2’22, despite only reporting $4B in H1’22. Nonetheless, all hope is not lost since these aggressive investments have also allowed the company to record an all-time high of 2.02M in postpaid and 605K fiber net adds in H1’22. Let’s see, if T is able to sustain its strong momentum into the painfully evident economic downturn.
So, Is T Stock A Buy, Sell, or Hold?
T 5Y EV/Revenue and P/E Valuations
S&P Capital IQ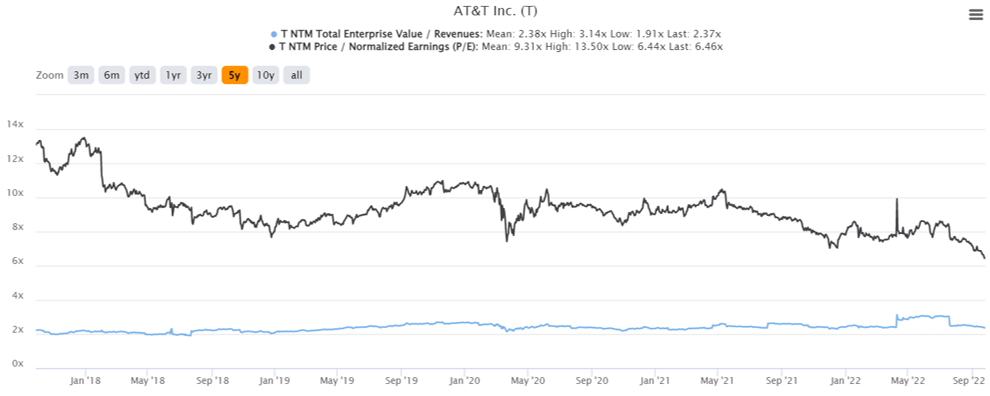
T is currently trading at an EV/NTM Revenue of 2.37x and NTM P/E of 6.46x, in line with its 5Y EV/Revenue mean of 2.38x though lower than its 5Y P/E mean of 9.31x. The stock is also trading at $15.73, down -43.29% from its 52-week high of $27.74, nearing its 52-week low of $15.58. Nonetheless, consensus estimates remain bullish about T’s prospects, given their price target of $22.21 and a 41.20% upside from current prices.
T Dividend Payout & Yield
S&P Capital IQ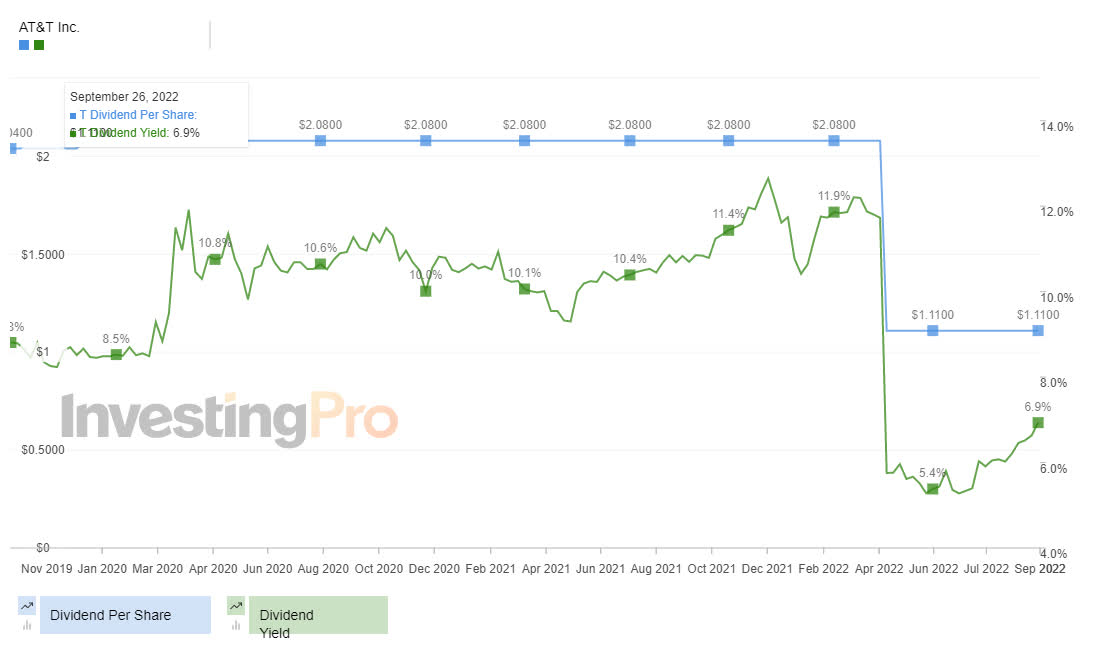
Though T has obviously cut their dividend payouts for the past two quarters, the recent drastic stock correction has also improved its dividend yields to 7.05% at the moment. Seeing that the bearish market sentiment will likely persist for the next few weeks, we may see more retracement ahead for T’s performance. The S&P 500 Index has tragically plunged by -23.96% YTD, breaking previous June lows. If the downward trend persists, it is very likely that we may see T reach single digits over the next few months indeed.
Furthermore, assuming a miss from the estimate’s cash flow generation, we may expect another drastic correction after its FQ3’22 earnings call in October, similarly seen after its FQ2’22 call. The rising inflation and economic downturn would likely reduce consumer discretionary spending ahead, bringing further headwinds to T’s performance then. Thereby, potentially bringing its P/E valuations to another record low from current bottom levels, assuming another elevated September CPI by early October.
In the meantime, investors with higher risk tolerance and long-term trajectory may consider nibbling at current levels. We shall see since it is entirely possible that maximum pessimism is already baked in with the stock market moderately recovering from here. The S&P plunge is starting to moderate, with some optimism visible around the corner.
Be the first to comment