

Perawit Boonchu/iStock via Getty Images
A Quick Take On Skyward Specialty Insurance Group
Skyward Specialty Insurance Group (SKWD) has filed to raise $127.5 million in an IPO of its common stock, according to an amended S-1 registration statement.
The firm provides specialty property & casualty insurance services in the United States.
It may be more prudent to watch and wait on SKWD’s price action after it begins trading, to possibly benefit from a soft pricing environment for the stock.
I’m on Hold for Skyward’s IPO.
Skyward Overview
Houston, Texas-based Skyward Specialty Insurance Group was founded to provide commercial P&C insurance services as both a non-admitted (excess & surplus) or admitted insurance coverage provider.
Management is headed by Chief Executive Officer Mr. Andrew Robinson, who has been with the firm since May 2020 and was previously Co-CEO of Groundspeed Analytics and Chairman of Clara Analytics, two insurance technology companies.
The chart below shows the company’s various lines and gross written premium breakdowns:
Company Offerings (SEC)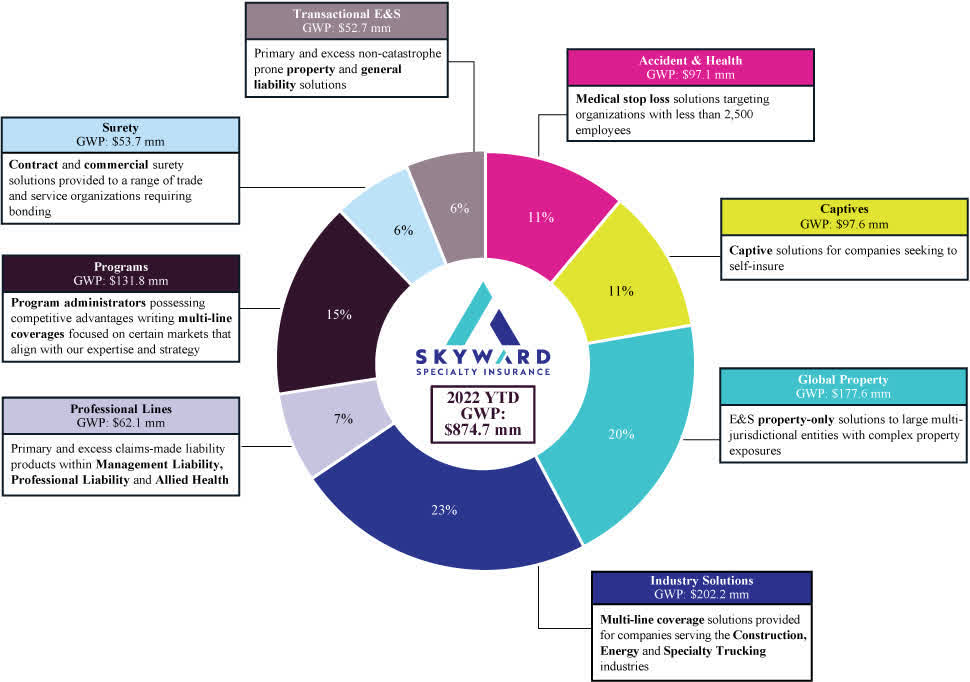
The company’s primary offerings include:
-
General liability
-
Excess liability
-
Professional liability
-
Commercial auto
-
Group accident and health
-
Property
-
Surety
-
Workers’ compensation
As of September 30, 2022, Skyward has booked fair market value investment of $577 million from investors including The Westaim Corporation, Caffrey Partners, Mt. Whitney Securities and others.
Skyward – Client Acquisition
The firm targets a variety of market segments through retail brokers and wholesale broker partners.
It also administers certain programs through third-party captive managers.
Underwriting, Acquisition & Insurance expenses as a percentage of total revenue have trended higher as revenues have increased, as the figures below indicate:
|
Underwriting, Acq. & Insurance Expenses |
Expenses vs. Revenue |
|
Period |
Percentage |
|
Nine Mos. Ended September 30, 2022 |
29.1% |
|
2021 |
25.2% |
|
2020 |
26.5% |
(Source – SEC)
The Underwriting, Acquisition & Insurance expense efficiency multiple, defined as how many dollars of additional new revenue are generated by each dollar of Underwriting, Acquisition & Insurance spend, fell to 0.4x in the most recent reporting period, as shown in the table below:
|
Underwriting, Acq. & Insurance Expenses |
Efficiency Rate |
|
Period |
Multiple |
|
Nine Mos. Ended September 30, 2022 |
0.4 |
|
2021 |
0.7 |
(Source – SEC)
Skyward’s Market & Competition
According to a 2021 market research report by Insurance Business America, the E&S market premiums in the U.S. market in 2020 was $41.7 billion.
This represents a 14.9% increase over the 2019 result of $37.5 billion.
The main drivers for this expected growth were a low interest rate environment, increased claims costs, and increasingly frequent weather events, among others.
Also, those factors are expected to remain in effect in the near future with the topic of ransomware potentially becoming a more important factor in many insurance policies.
Major competitive or other industry participants include:
-
Markel Corporation (MKL)
-
W. R. Berkley Corporation (WRB)
-
American Financial Group (AFG)
-
Tokio Marine Holdings
-
CNA Financial (CNA)
-
Hiscox, Ltd.
-
RLI Corp. (RLI)
-
Intact Financial Corporation
-
Argo Group International Holdings (ARGO)
-
Kinsale Capital Group (KNSL)
-
James River Group Holdings (JRVR)
Skyward Specialty Insurance Group Financial Performance
The company’s recent financial results can be summarized as follows:
-
Growing topline revenue
-
Increasing gross profit
-
Variable profit before income taxes
-
Fluctuating cash flow from operations
Below are relevant financial results derived from the firm’s registration statement:
|
Total Revenue |
||
|
Period |
Total Revenue |
% Variance vs. Prior |
|
Nine Mos. Ended September 30, 2022 |
$ 455,053,000 |
12.9% |
|
2021 |
$ 550,181,000 |
21.7% |
|
2020 |
$ 451,972,000 |
|
|
Gross Profit (Loss) |
||
|
Period |
Gross Profit (Loss) |
% Variance vs. Prior |
|
Nine Mos. Ended September 30, 2022 |
$ 161,517,000 |
5.5% |
|
2021 |
$ 195,770,000 |
118.0% |
|
2020 |
$ 89,790,000 |
|
|
Gross Margin |
||
|
Period |
Gross Margin |
|
|
Nine Mos. Ended September 30, 2022 |
35.49% |
|
|
2021 |
35.58% |
|
|
2020 |
19.87% |
|
|
Profit (Loss) Before Income Taxes |
||
|
Period |
Profit (Loss) Before Income Taxes |
PBIT Margin |
|
Nine Mos. Ended September 30, 2022 |
$ 23,819,000 |
5.2% |
|
2021 |
$ 48,309,000 |
8.8% |
|
2020 |
$ (94,532,000) |
-20.9% |
|
Comprehensive Income (Loss) |
||
|
Period |
Comprehensive Income (Loss) |
Net Margin |
|
Nine Mos. Ended September 30, 2022 |
$ (29,969,000) |
-6.6% |
|
2021 |
$ 30,741,000 |
6.8% |
|
2020 |
$ (67,441,000) |
-14.8% |
|
Cash Flow From Operations |
||
|
Period |
Cash Flow From Operations |
|
|
Nine Mos. Ended September 30, 2022 |
$ 124,913,000 |
|
|
2021 |
$ 175,285,000 |
|
|
2020 |
$ 44,709,000 |
|
(Source – SEC)
As of September 30, 2022, Skyward had $30.7 million in cash and $1.9 billion in total liabilities.
Free cash flow during the twelve months ended September 30, 2022, was $161.9 million.
Skyward Specialty IPO Details
SKWD intends to sell 4.75 million shares of common stock and selling shareholders will sell 3.75 million shares at a proposed midpoint price of $15.00 per share for gross proceeds of approximately $127.5 million, not including the sale of customary underwriter options.
No existing or potentially new shareholders have indicated an interest in purchasing shares at the IPO price.
The float to outstanding shares ratio (excluding underwriter options) will be approximately 22.61%. A figure under 10% is generally considered a ‘low float’ stock which can be subject to significant price volatility.
Per the firm’s most recent regulatory filing, it plans to use the net proceeds as follows:
We intend to use at least $45 million of the net proceeds to us from this offering to make capital contributions to our insurance company subsidiaries in order to grow our business and the remainder for general corporate purposes.
(Source – SEC)
Management’s presentation of the company roadshow is available here until the IPO is completed.
Regarding outstanding legal proceedings, management says the firm is not a party to any legal proceedings that would have a material adverse effect on its financial condition or operations.
The listed bookrunners of the IPO are Barclays, Keefe, Bruyette & Woods and several other investment banks.
Valuation Metrics For Skyward Specialty
Below is a table of the firm’s relevant capitalization and valuation metrics at IPO, excluding the effects of underwriter options:
|
Measure [TTM] |
Amount |
|
Market Capitalization at IPO |
$564,001,305 |
|
Price / Sales |
0.94 |
|
Earnings Per Share |
-$0.82 |
|
Operating Margin |
4.23% |
|
Net Margin |
-5.30% |
|
Float To Outstanding Shares Ratio |
22.61% |
|
Proposed IPO Midpoint Price per Share |
$15.00 |
|
Net Free Cash Flow |
$161,908,000 |
|
Free Cash Flow Yield Per Share |
28.71% |
|
Debt / EBITDA Multiple |
5.05 |
|
CapEx Ratio |
155.79 |
|
Revenue Growth Rate |
12.94% |
(Source – SEC)
Commentary About Skyward Specialty
SKWD is seeking U.S. public capital market investment to fund its general growth initiatives.
The company’s financials have shown increasing topline revenue, growing gross profit, fluctuating profit before income taxes and variable cash flow from operations.
Free cash flow for the twelve months ended September 30, 2022, was $161.9 million.
Underwriting, Acquisition & Insurance expenses as a percentage of total revenue have trended higher as revenue has increased; its Underwriting, Acquisition & Insurance efficiency multiple has dropped to 0.4x in the most recent reporting period.
The firm currently plans to pay no dividends and to retain any future earnings for reinvestment back into the company’s growth initiatives.
The market opportunity for providing specialty insurance services in the U.S. is large and expected to grow as asset values grow.
Barclays is the lead underwriter, and the sole IPO led by the firm over the last 12-month period has generated a return of 10.3% since its IPO. This is an upper-tier performance for all significant underwriters during the period.
As for valuation, the firm has provided the following return on equity calculations for recent periods:
Return On Equity Figures (SEC)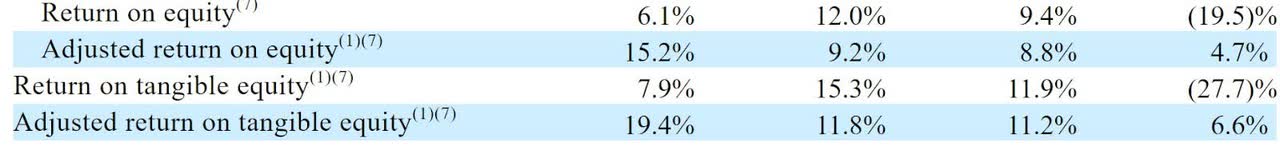
While the above-referenced adjusted return on tangible equity figures have improved in recent periods (left columns), the firm’s fully-diluted book value per share, as shown below, is $9.51 as of September 30, 2022:
Book Value Per Share Figures (SEC)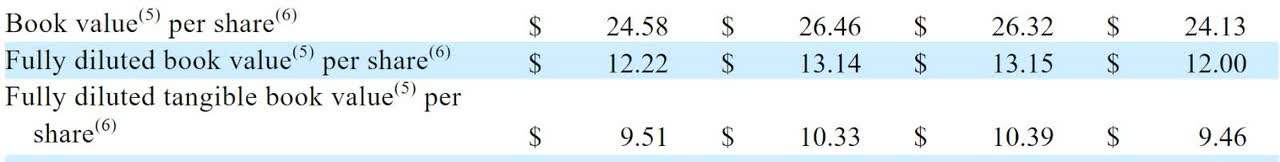
Management is asking IPO investors to pay a price of $15.00 per share despite a diluted book value that is well below that figure.
Asset values may have taken a hit in recent quarters due to a rising cost of capital environment, negatively impacting SKWD in the process.
Investors who believe asset values will rebound in the near future might wish to make a bet on SKWD.
I’m more cautious and believe that economic activity is slowing, creating a drag on asset value growth in the near term.
It may be more prudent to watch and wait on SKWD’s price action after it begins trading, to possibly benefit from a soft pricing environment for the stock.
I’m on Hold for Skyward’s IPO.
Expected IPO Pricing Date: January 12, 2023.
Be the first to comment