

imaginima
Introduction and Overview
International Petroleum Corporation (TSX:IPCO:CA, OTCPK:IPCFF) is a liquids-weighted intermediate Canadian E&P with operations concentrated in Southeast Alberta in its Suffield field and in Western Saskatchewan at its Onion Lake thermal plant. IPC also operates conventional fields in France and has offshore operations in the Bertam field in Malaysia.
In the assessment below we will deconstruct IPC within two main contexts and prove that meaningful upside exists given IPC’s operational performance and economic prowess.
- Operational Assessment: IPC has been able to demonstrated above-average operational performance as demonstrated by its shallow decline operations, disciplined capital deployment, and meaningful reserve life index.
- Economic Assessment: IPC has posted both strong top and bottom-line numbers, remains severely undervalued both from an intrinsic value and trading multiples perspective, and is positioned to generate meaningful free cash flow in 2022.
IPC is a strong Canadian operator, and a clear sector outperformer when compared to the other Canadian E&P of similar size. As a result, we maintain a bullish outlook on IPC given its future growth potential and the constructive market backdrop.
Operational Assessment
International Petroleum Corporation is a mid-size E&P operator (~48,000 boe/d), with 83% of its production concentrated in Canada and the balance from its international operations in Malaysia and France as illustrated below. Given the company’s concentration in Canada we will focus our analysis below over its Suffield (conventional, Southeast Alberta) and Onion Lake (thermal, West Saskatchewan) operations.
Figure 1: Summary of Production by Geographic Region (Source: Corporate Disclosure, generated and formatted by CER)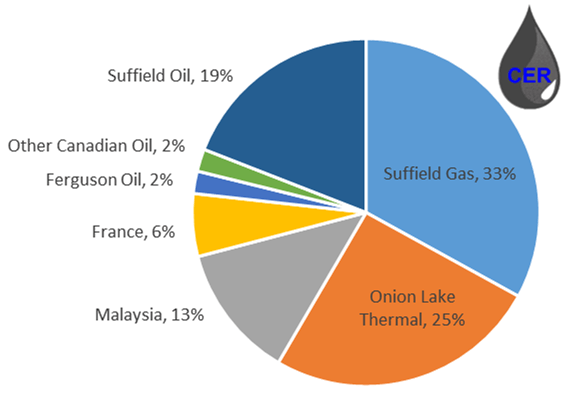
Conventional Oil & Gas Operations
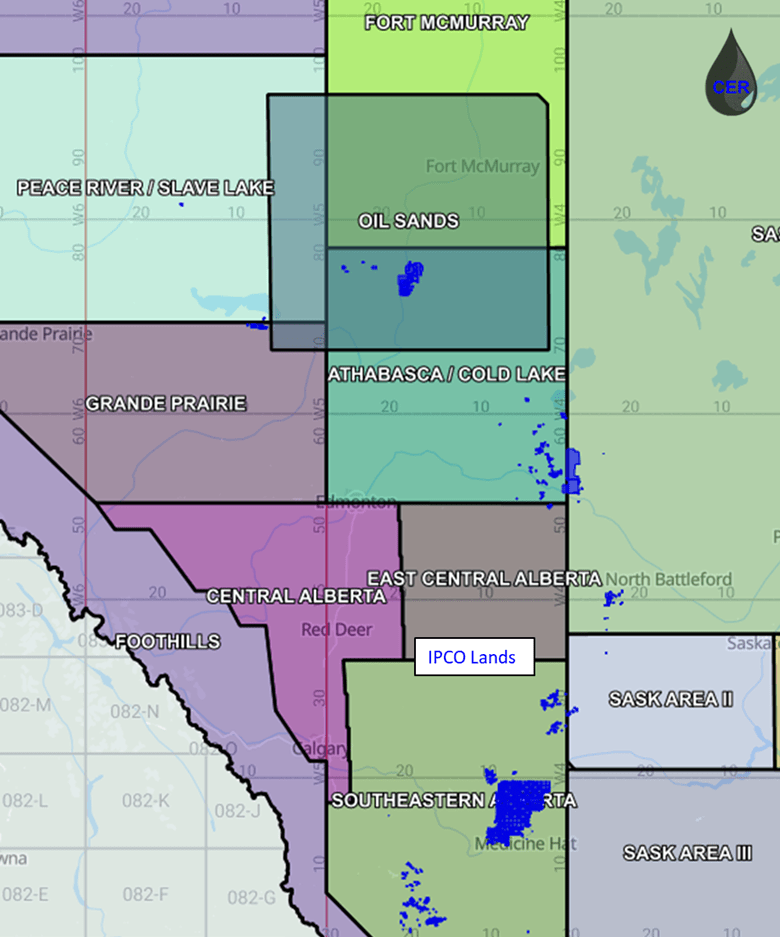
IPC’s conventional production (concentrated in Southeast Alberta) is around ~26,000 boe/d and as such the company will be compared against other peers of similar size in the area. For context, the table below summarizes IPC’s non-thermal production across all assessed regions in the Western Canadian Sedimentary Basin. The map below illustrates IPC’s entire acreage position (including thermal projects) across the WCSB. Note that values may not be exact as they include several underlying assumptions and simplifications.
Figure 2: Summary of Land Position and Production by Region (excluding thermal) (Source: XI technologies, geoSCOUT, generated and formatted by CER) Figure 3: Summary of Land Position and Production by Region (including thermal) (Source: XI technologies, geoSCOUT, generated and formatted by CER)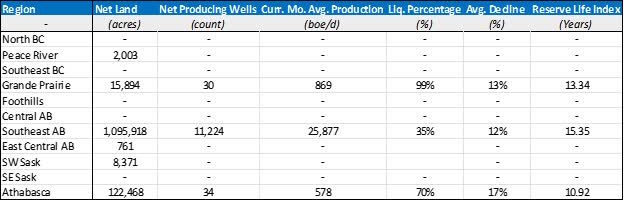
Acreage and Production
We look at land utilization (illustrated by the plot below) to understand the amount of production each producer generates from its existing acreage position. The plot below also illustrates the net well count for each operator, as depicted by the bubble size. Torxen (private) the highest land utilization, displaying high production relative to its net acreage position while also maintaining a relatively low net well count. This is reflective of highly effective geological mapping, successful drilling and downhole stimulation activities. In contrast, an operator like CNRL which has lower production than Torxen but holds nearly twice the acreage position and well count is illustrative of poor land utilization and low average production per well. As illustrated by the figure below, IPC falls second behind Torxen in terms of land utilization in the area but remains the top performer among publicly traded operators.
Figure 4: Net Acreage (Y-Axis), Production (X-Axis) and Net Well Count (bubble size) by Operator (Source: XI technologies, geoSCOUT, generated and formatted by CER)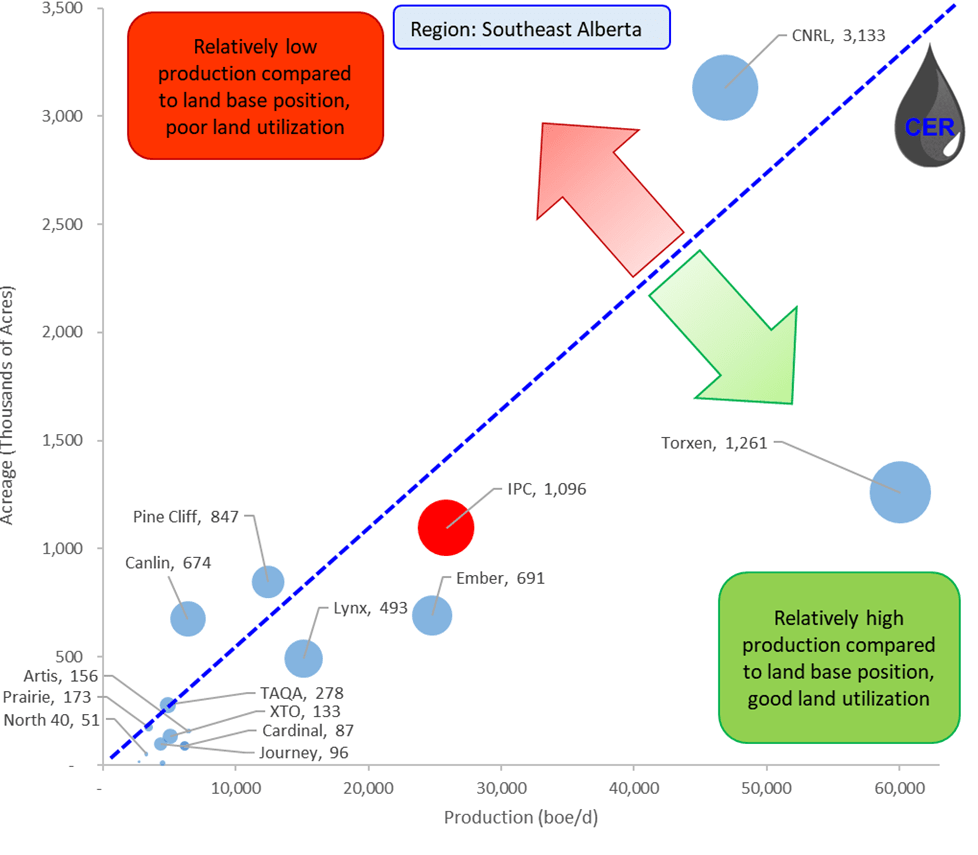
Production Decline and Drilling Activity
IPC is the third largest producer in Southeast Alberta behind Torxen and CNRL, at around 26,000 boe/d. Moreover, the company exhibits some of the shallowest declines in the region at approx. 14% annual oil declines (compared to a peer average of 23%) and 8% annual gas declines (compared to a peer average of 17%). This is critical to note, given the macroeconomic inflationary backdrop. Given field service, tubing and casing costs have all increased over 20% since a year ago, drilling activity has lagged what would be expected during an >US$90/bbl WTI pricing environment. Operators are finding it more difficult to grow or maintain production given the escalatory pricing pressures. As such, shallow declines are a meaningful differentiator reserved only for the top performing operators; who will then be rewarded by having the option to delay future drilling activity until tubing/casing/service prices retract from their current highs.
Figure 5: Production (LHS) and Average Annual Decline (RHS) by Operator (Source: XI technologies, geoSCOUT, generated and formatted by CER)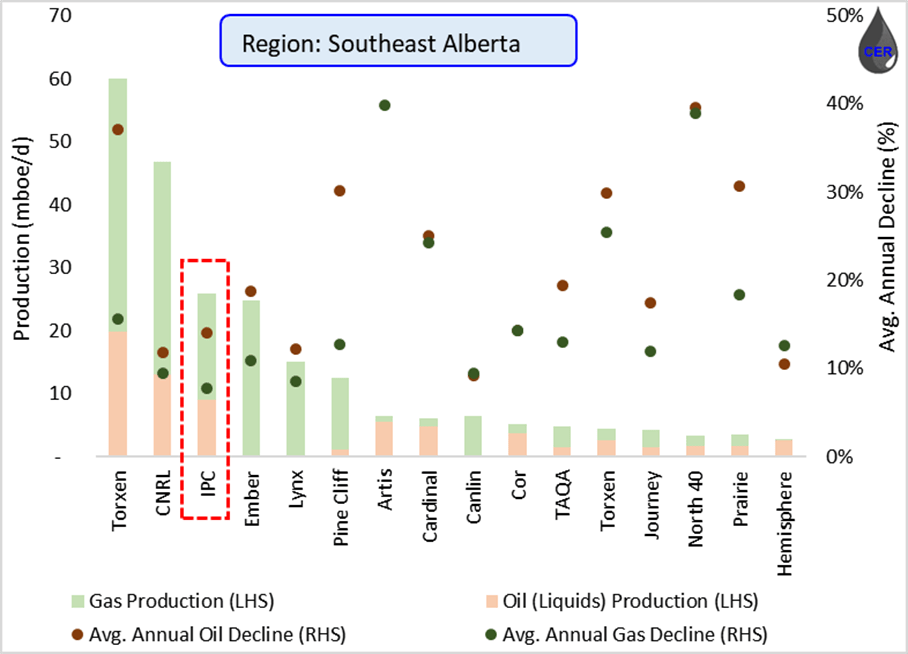
Following our argument above, and as illustrated by the plot below, we can see that Torxen has been the most active driller in the area. This is likely due to the company’s incredibly steep annual decline rates (37% oil declines, compared to a peer average of 23% in Southeast Alberta). Given its steep declines, the company has no choice but to sustain its rapidly declining production through an aggressive drilling campaign during a period of elevated casing and tubing prices.
IPC is planning to spend US$116 MM in Canada in order to drill 16 wells and recomplete 110 gas wells, progress FEED at its Blackrod Pilot project and bring online a new pad at its Onion Lake Thermal project. To further shed light on the importance on the conservation of capital during inflationary times, IPC had to increase its capital program by US$10 MM in 2022 to account for inflationary pressures (representing an increase of 8% from original guidance).
Given its shallow declines, IPC has been able to sustain its production while implementing a relatively light drilling program. A program that is slightly lower than other small private producers in the area such as Artis and North 40, a prudent business decision given escalatory costs would otherwise wear away at the company’s bottom-line earnings. IPC’s shallow production declines and drilling program are proof of excellent operatorship, resource exploitation, downhole stimulation, and prudent management practices.
Figure 6: Net new drills (LHS) and Avg. Production (RHS) by Operator (Source: XI technologies, geoSCOUT, generated and formatted by CER)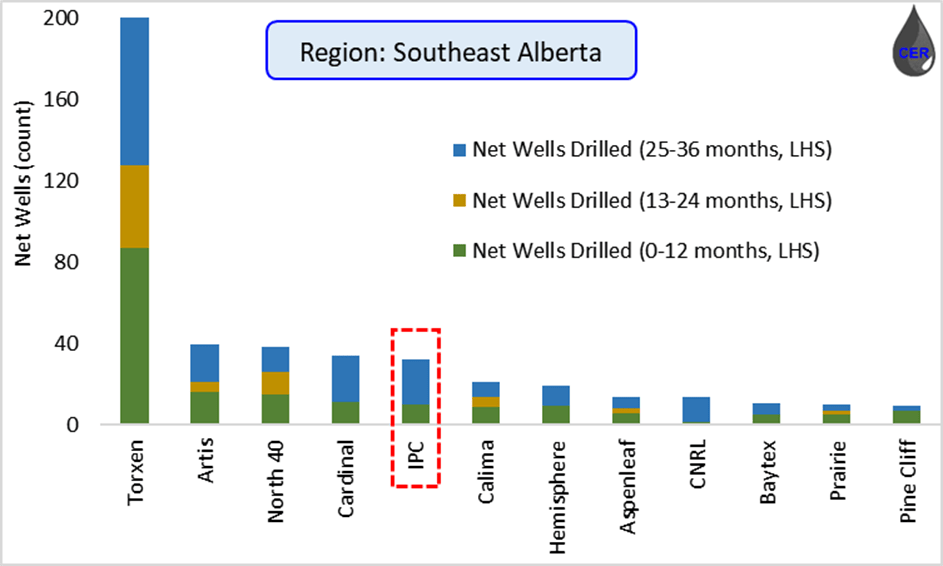
Reserves
IPC’s PDP reserves land at around ~150 MMboe reflecting a PDP reserve life index (RLI) of 15.5 years. In terms of absolute reserve volumes, IPC lands right behind CNRL (a company of meaningfully larger scale and resources) and Torxen (a private producer focused exclusively in Southeast Alberta). More importantly, IPC lands ahead of both CNRL and Torxen in terms of RLI, another indication of highly effective reservoir engineering practices within the organization.
Figure 7: PDP Reserves (left) and Reserve Life Index (RHS) by Operator (Source: XI technologies, geoSCOUT, generated and formatted by CER)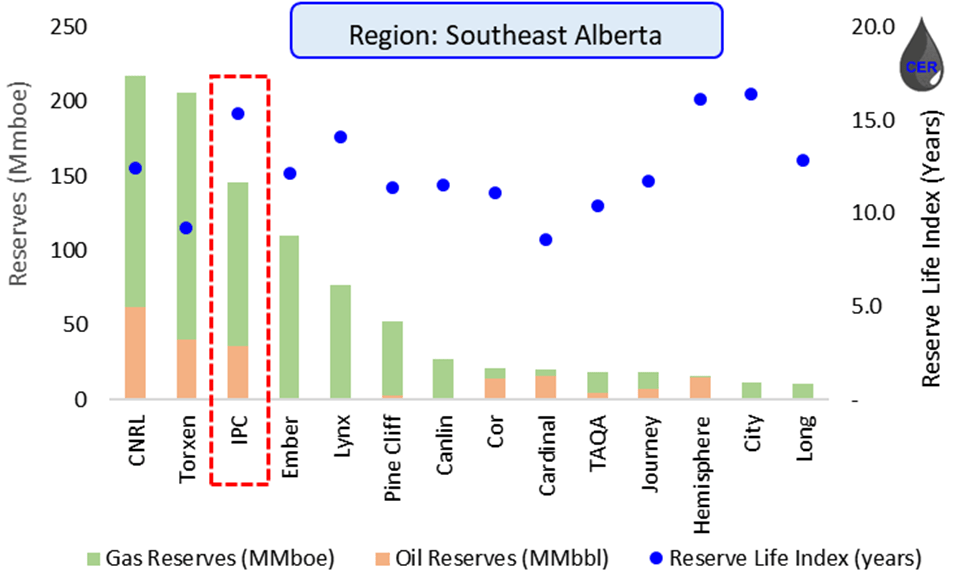
Oil Sands Operations
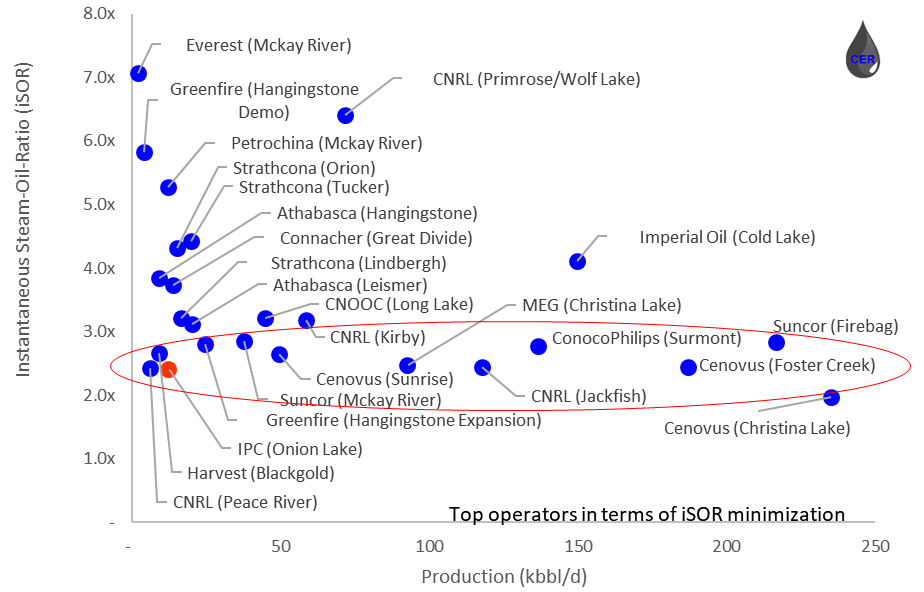
Despite the smaller scale, IPC has also proven itself as one of the most effective thermal oil sands operators in the WCSB. IPC operates a thermal in-situ SAGD facility at Onion Lake, with roughly ~12,000 bbl/d in production. A key operating metric to analyze among in-situ operators is the Steam-to-Oil ratio, as a lower SOR is reflective of lower operating costs and higher field netbacks. As illustrated by the table and plots below, IPC’s operations fall within the top quartile of all in-situ thermal operators across Canada, further proving the company’s excellent operatorship both between conventional oil as well as thermal operations. Moreover, the company is currently progressing Front End Engineering Design (FEED) on its oil sands in-situ Blackrod SAGD facility, which hold over 1.3 billion bbls of resource and is currently seeking approval for up to 80,000 bbl/d in production.
Figure 8: Summary of In-Situ Oil Sands Operator (Ranked by lowest iSOR) (Source: Oil Sands Database, AER, formatted and filtered by CER) Figure 9: In-Situ Oil Sands Operator iSOR (y-axis) and Production (x-axis) (Source: Oil Sands Database, AER, formatted and filtered by CER)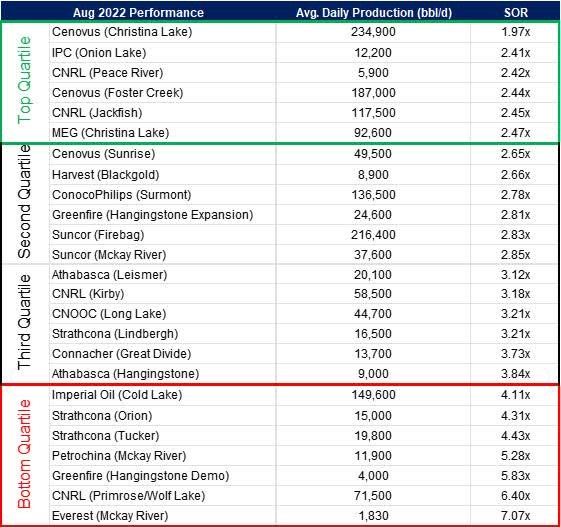
Economic Assessment
In the following five sections we consider IPC’s latest earnings and breakdown its intrinsic valuation; starting with a commodity pricing outlook, production forecast, calculating field and corporate netbacks, and finally by discounting free cash flow back to present value.
Earnings and Return of Capital
Q2 volumes were ~49,400 boe/d, above Wall Street’s estimate of 48,000 boe/d which drove operating cash flow of US$193 MM and FCF of US$152 MM. Management has revised its 2022 full year FCF guidance to US$530 MM (upper end). In aggregate, the company has returned a total of US$165 MM to shareholders as of July 2022, US$65 MM from a NCIB (cancelling 8.3 million shares) and another US$100 MM from an SIB (cancelling an additional 8.3 million shares). These share cancellations reflect a ~12% share appreciation for existing shareholders.
Pricing
IPC’s production can be separated into two main streams: crude oil (~63%), and natural gas (~37%). On average, IPC has realized just above WCS (~10% above) and just below AECO (~5% below) benchmark pricing. The premium to WCS pricing is due to its France and Malaysian operations realizing the higher Brent benchmark pricing. Furthermore, in recent months, WTI/WCS differentials have widened drastically given the ongoing SPR releases, which have artificially flooded the crude market in the United States and set a ceiling for Canadian heavy barrels. Given the SPR release is expected to end by the end of the year, an even more constructive case exists for WTI/WCS differentials tightening, and IPC realizing higher oil prices.
Figure 10: Commodity Price Outlook (source: McDaniels, generated and formatted by CER)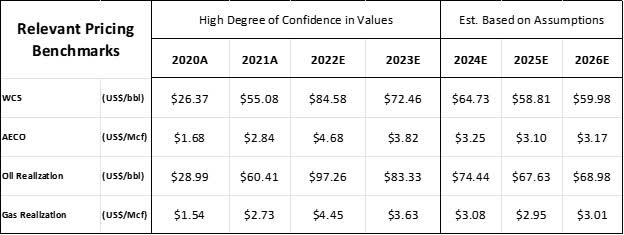
Production
IPC’s management provided competitive guidance for 2022, with year-over-year production increasing 7% from 2021, projected to grow another 7% next year. Given the meaningful production growth forecasted until 2023, we have incorporated a lower production growth thereafter to remain conservative.
Figure 11: Production Outlook (source: 2022 Management Presentation, generated and formatted by CER)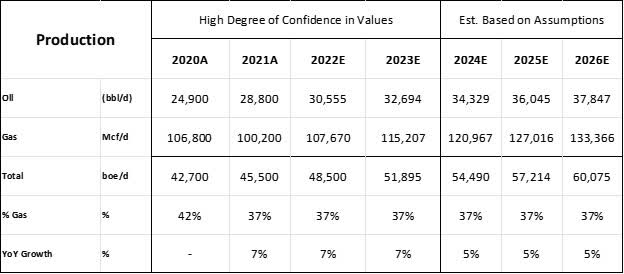
Netback
Given the current pricing environment, IPC continues to post appealing field and corporate netbacks. As with any oil and gas company, a major risk is a downturn in commodity prices as we have seen over the past month. IPC has mitigated this risk with both fixed price WTI/WCS diff. and AECO swaps through Q4 2022. Currently, roughly 60% of 2022 oil volumes and 35% of 2022 gas volumes are hedged. Moreover, despite the hedging impact, the company is poised to generate meaningful field netbacks at ~US$35/boe throughout the rest of 2022.
Figure 12: Operational Netback (All figures in USD) (source: 2022 Management Presentation, generated and formatted by CER)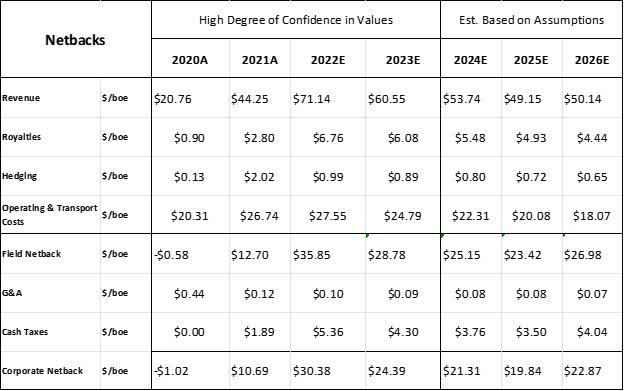
Cash Flow:
Given the company’s smaller scale and international exposure we will discounts IPC’s future cash flow at 15%. As such, the present value of IPC falls between US$13/share and US$14/share, implying an attractive ~50% upside from its current valuation.
Figure 13: Free Cash Flow and Present Value (All figures in USD) (source: 2022 Management Presentation, generated and formatted by CER)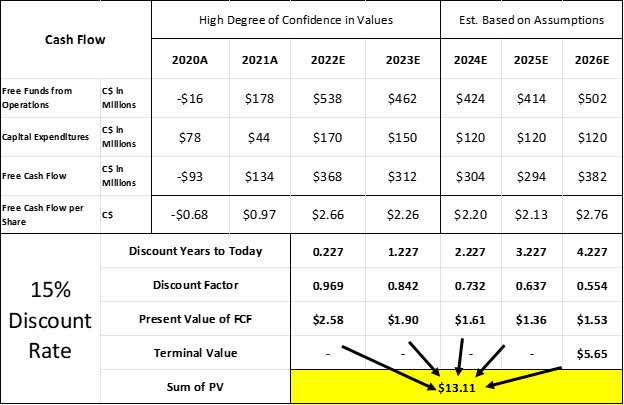
Comparables:
Despite its smaller scale, international exposure and relatively lower liquidity the company remains incredibly attractive from a trading multiple perspective as well. As illustrated below, the company appears undervalued across several trading multiples compared to other Canadian peers of similar size.
Figure 14: Trading Multiples of Various Comparable Peers (source: 2022 Management Presentations, generated and formatted by CER)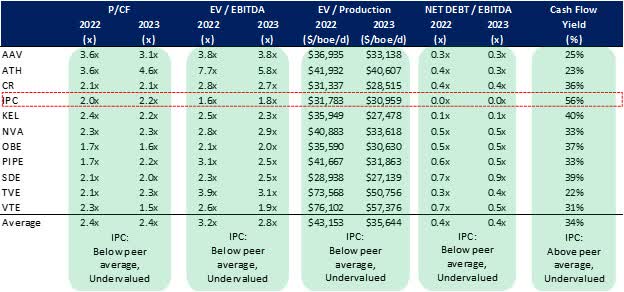
Conclusion
International Petroleum Corporation is an incredibly versatile and well differentiated operator with its business segments spanning conventional oil, in-situ thermal production and international operations. Despite its smaller scale, IPC remains one of the most effective operators in each region where it operates, relative to other peers in the area. As far as intrinsic valuation, IPC falls between US$13 and US$14 per share given current commodity, production, and free cash flow outlook, implying an attractive 50% upside from the current valuation. Furthermore, IPC continues to trade at attractive multiples relative to peers, and as such warrants a buy recommendation.
Be the first to comment