

liorpt
In this analysis of Intel Corporation (NASDAQ:INTC), we determined what type of stock Intel can be classified as, namely a value, growth or dividend stock. To determine whether the company is a value stock, we compared the company’s P/S, PE and P/FCF against chipmakers and top US companies within the IT sector industries. To determine whether Intel is a growth stock, we analyzed its revenue growth based on its historical and forward average based on our revenue projections from previous analyses and compared it with chipmakers and the top US companies in the tech industries in the IT sector. Lastly, to determine whether Intel is a dividend stock, we compared its dividend yield with its annualized stock return over the past 5 years and whether its dividend yield is above the US treasury yield.
Not a Growth Stock with Underwhelming Revenue Growth
Firstly, we determined whether Intel is a growth stock. According to Corporate Finance Institute, growth stocks
offer a substantially higher growth rate as opposed to the mean growth rate prevailing in the market.
Whereas Merrill Edge stated that growth stocks
demonstrated better-than-average gains in earnings in recent years and that are expected to continue delivering high levels of profit growth.
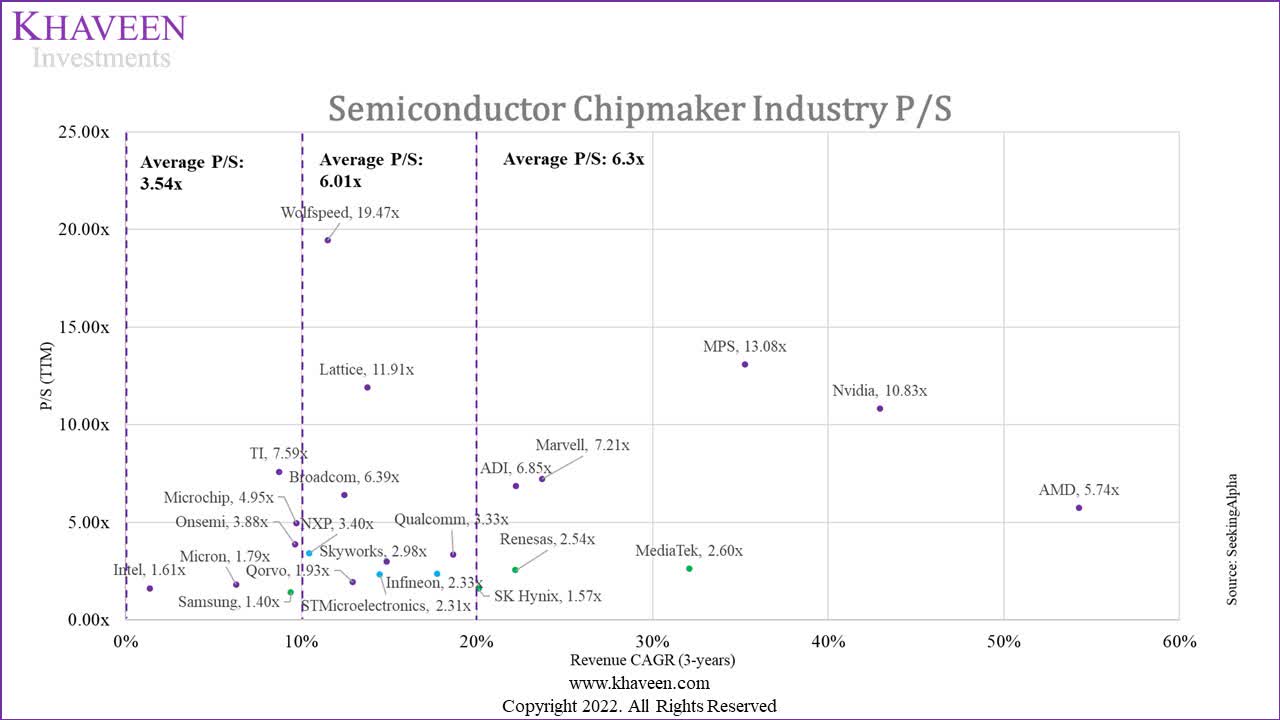
Although there is generally no fixed rule to define growth stocks, we define growth stocks with the criteria of 20%+ average 5-years historical and 5-year forward revenue growth based on our forecasts from previous analyses of 14% average which we derived by tapering down by 2% of growth per year from 20%.
We compared Intel against its 22 other semiconductor industry chipmakers in the table below based on their 5-year historical and forward revenue growth.
*5-year average analyst consensus estimate
**3-year average analyst consensus estimate
Source: Seeking Alpha, Khaveen Investments
Seeking Alpha, Khaveen Investments
Based on the table, the average 5-year historical revenue growth is 17.15% and the 5-year forward average is 13.01% based on our revenue forecasts from previous analyses except for Renesas, Qorvo, Infineon, ams-OSRAM, and SK Hynix. Out of 23 chipmakers, only 9 companies had higher historical revenue growth than the average including MPS, NVIDIA, AMD, ADI, Broadcom, ams-OSRAM, Micron, Samsung and SK Hynix. NVIDIA is the market leader in the discrete GPU market and has a large exposure to the data center segment which represented 45% of total revenue and grew at a CAGR of 73.8%. Additionally, ADI and ams-OSRAM had completed acquisitions in the past 5 years such as the ADI-Maxim acquisition and ams-OSRAM deal which we analyzed previously. Whereas for Broadcom, we determined its acquisition strategy which resulted in higher revenue growth for the company in our previous analysis and estimated its M&A revenue contribution at 13.9% in the past 10 years. Furthermore, Micron, Samsung and SK Hynix account for a large share of the memory chip market. According to SIA data, the memory product type had a higher average growth rate of 13.9% in the past 12 years compared to DAO at 5.8% and Logic at 7.8%. In addition, memory capacity and content growth continued to increase continuously in smartphones and PC as data volume grew at a 10-year CAGR of 44.4%.
However, based on our definition of growth stocks, only 5 companies fulfill the criteria of 20% 5-year average historical growth and 14% 5-year forecasted forward growth which are MPS, NVIDIA, AMD, Broadcom and SK Hynix. For MPS, we previously analyzed the company which focuses on DC-DC power semiconductor products and had its growth driven by its rapidly growing computing and storage product segment (31% of revenue) which grew at a 5-year average of 36.6% as well as its automotive segment for ADAS, infotainment and connectivity (17% of revenue) which by 45.8%. Whereas for NVIDIA, we analyzed and forecasted its growth driven by its data center segment growth at an average of 33.6%. In addition, we expect Broadcom’s growth to be boosted by the acquisition of VMware with estimated revenue synergies of $1.9 bln and a revenue contribution of 32%.
In contrast, Intel only had below-average revenue growth of 5.78% and a forward 5-year average of 7.32%. Therefore, Intel does not meet our criteria for it to be classified as a growth stock as its revenue growth is below 20% historical and below 14% for its forward growth. In comparison with its main competitor in the CPU market, AMD had superior growth compared to Intel as we previously analyzed its higher average pricing growth and market share increase. In terms of pricing, we calculated an average pricing increase of 30.6% (AMD) compared to 9.4% (Intel) for desktop CPU products and an average increase of 69.1% for AMD’s server CPU products which is higher than Intel’s 20.2% average increase as AMD’s products had higher performance increase than Intel. Moreover, AMD had gained market share from Intel in the CPU market in the past 5 years across all product types including desktop, notebook and server as seen in the chart below.
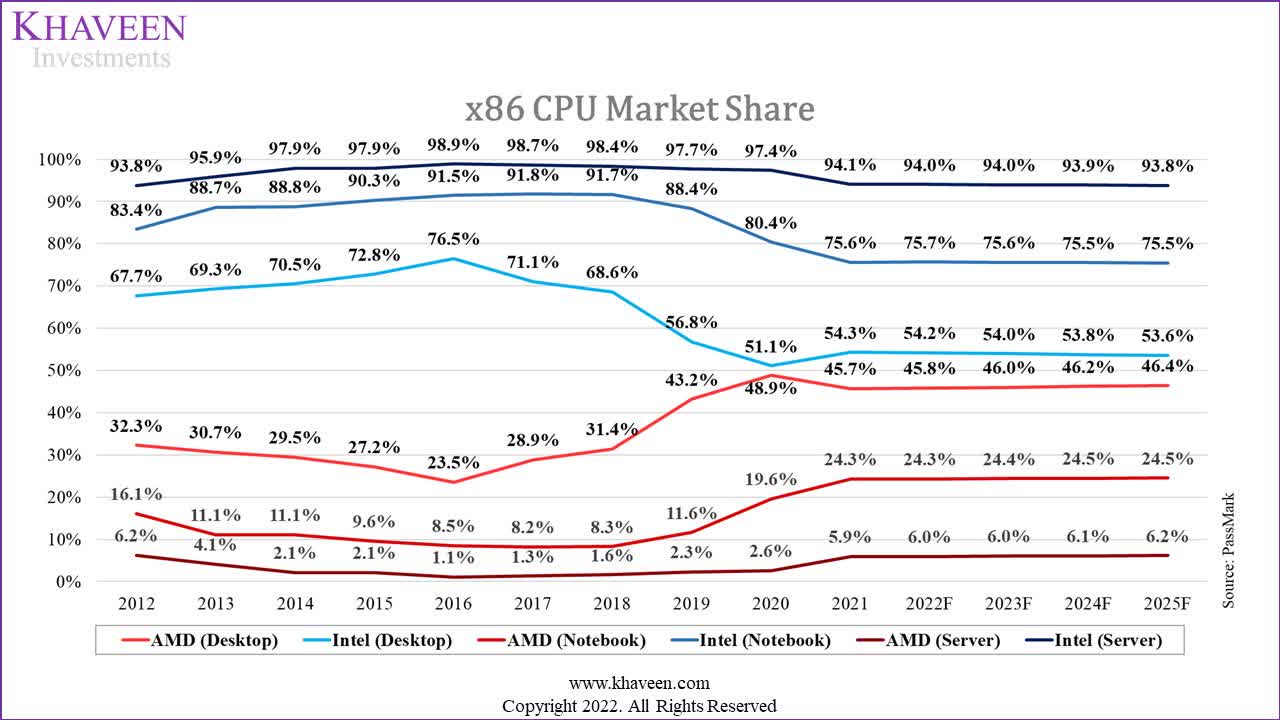
PassMark, Khaveen Investments
Furthermore, we compared Intel as the top US company in the semiconductor industry with the top US companies based on the revenues of each tech industry within the IT sector.
|
Companies |
Revenue growth 5-year average |
Forecasted Revenue 5-year average |
|
IBM (IT Services) (IBM) |
-0.42% |
4.55% |
|
Microsoft (Software) (MSFT) |
15.41% |
21.44% |
|
Cisco (Communications Equipment) (CSCO) |
0.99% |
3.51% |
|
Apple (Technology Hardware, Storage & Peripherals) (AAPL) |
11.79% |
9.97% |
|
TD SYNNEX (Electronic Equipment, Instruments & Components) (SNX) |
26.71% |
28.33%* |
|
Intel (Semiconductors & Semiconductor Equipment) |
5.78% |
7.32% |
|
Average |
10.04% |
12.52% |
*4-year average analyst consensus estimate
Source: Seeking Alpha, Khaveen Investments
From the table, Intel’s historical and forward revenue growth was below the tech sector average and was the third lowest only ahead of IBM and Cisco. In contrast, TD SYNNEX had the highest historical revenue growth followed by Microsoft and Apple. TD SYNNEX also has the highest forward revenue growth though based on analyst consensus estimates boosted by its FY2022 growth forecast of 96.55%. This is as the company completed a merger between SYNNEX and Tech Data in September 2021. Based on our criteria of 20%+ historical revenue growth and 14% forward revenue growth, only TD SYNNEX of the top US companies within the tech sector could be classified as a growth stock.
Thus, based on our criteria of growth stocks, we determined that Intel is not a growth stock based on our definition as its revenue growth had been below 20% for its historical and forward revenue growth below 14%. Thus, we then examined whether Intel is either a Value or Dividend stock.
Value Stock in All Areas
After eliminating Intel as a growth stock, we then examined whether the company is a value stock by analyzing its valuation multiples based on P/E, P/B and P/FCF ratios [TTM]. According to Investopedia, value stocks generally have a low P/E ratio. Merrill Edge stated several characteristics of value stocks including being
lower priced than the broader market, priced below similar companies in the industry and carrying less risk than the broader market.
For our definition of value stocks, we based it on 3 valuation multiples which are its 5-year average P/E, P/B and P/FCF ratios. We define value stocks as companies with P/E ratios of below 12x, P/B below 4x and P/FCF below 20x.
|
Companies |
P/E (5-year Average) |
P/B (5-year Average) |
P/FCF (5-year Average) |
|
Intel |
11.12 |
2.83 |
16.93 |
|
MPS |
52.15 |
12.7 |
80.58 |
|
Lattice |
49.51 |
10.93 |
48.38 |
|
NVIDIA |
48.16 |
18.26 |
53.48 |
|
Marvell |
35.1 |
2.74 |
68.87 |
|
AMD |
62.52 |
19.08 |
65.23 |
|
ADI |
22.28 |
3.52 |
22.46 |
|
Broadcom |
16.08 |
6.23 |
16.13 |
|
Microchip |
17.56 |
5.6 |
16.13 |
|
TI |
22.8 |
12.94 |
21.31 |
|
NXP |
18.07 |
4.44 |
21.25 |
|
QUALCOMM |
20.65 |
21.37 |
12.5 |
|
ON Semi |
20.56 |
3.67 |
22.57 |
|
Skyworks |
15.96 |
4.57 |
19.76 |
|
Infineon |
23.68 |
3.17 |
19.76 |
|
STMicro |
22.32 |
3.23 |
28.24 |
|
Renesas |
37.65 |
2.36 |
18.69 |
|
Qorvo |
15.39 |
2.8 |
37.73 |
|
MediaTek |
10.09 |
0.99 |
33.81 |
|
ams-OSRAM |
54.6 |
3.26 |
8.03 |
|
Micron |
11.51 |
1.79 |
16.85 |
|
Samsung |
10.43 |
1.639 |
20.31 |
|
SK Hynix |
7.51 |
0.64 |
22.41 |
|
Average |
26.33 |
6.47 |
30.06 |
Source: Seeking Alpha, YCharts, Khaveen Investments
Based on the table, 10 out of the 23 chipmakers have a lower 5-year average P/E, P/B and P/FCF ratios than the industry average which are Intel, ADI, NXP, ON Semi, Skyworks, Infineon, STMicro, Micron, Samsung and SK Hynix. Out of these 10 companies, 5 or half of the companies are located outside the US. Furthermore, 5 out of 8 total non-US companies have lower multiples than the industry average which indicates that US companies trade at a higher premium relative to non-US companies. Additionally, out of the 10 companies with below-average multiples, Intel is the only logic chipmaker which we believe is due to its low growth in comparison with higher growth competitors such as AMD and NVIDIA as highlighted in the previous point. Also, the top 3 memory chipmakers have below average multiples despite their high revenue growth rates which we believe is due to the cyclicality of the DRAM and NAND markets.
Based on our definition, Intel meets our criteria of a value stock as the company’s P/E ratio is below 12x, P/B below 4x and P/FCF below 20x. Besides Intel, the other company which met our criteria is Micron. Furthermore, we compared Intel with the top US companies based on revenues of each tech industry within the IT sector in terms of their valuation multiples.
|
Companies |
P/E non-GAAP (5-year Average) |
P/B (5-year Average) |
P/FCF (5-year Average) |
|
IBM |
11.62 |
6.32 |
8.47 |
|
Microsoft |
31.22 |
11.66 |
43.1 |
|
Cisco |
15.97 |
5.05 |
13.86 |
|
Apple |
24.3 |
20.8 |
20.54 |
|
TD SYNNEX |
9.85 |
1.7 |
7.94 |
|
Intel |
11.12 |
2.83 |
16.93 |
|
Average |
17.35 |
8.06 |
18.47 |
Source: Seeking Alpha, Khaveen Investments
As seen above, Intel has a lower P/E, P/B and P/FCF ratio than the average of the top US companies within the IT sector. Similarly, TD SYNNEX, Cisco and IBM have below-average multiples for all 3 ratios. Excluding TD SYNNEX which had completed its merger in 2021, the other companies including IBM, Cisco and Intel’s low multiples coincide with their low revenue growth as discussed in the previous point. Based on our definition of value stocks, only Intel and TD SYNNEX fulfill our criteria for value stocks with P/E ratio is below 12x, P/B below 4x and P/FCF below 20x.
Therefore, as Intel meets our definition as a value with a P/E ratio below 20x, P/B below 7x and P/FCF below 20x, we classify Intel as a value stock which is in contrast with its other Logic competitors with higher growth than the company. Within the IT sector, we classify only 2 of the 6 top companies within each IT industry as value stocks which are Intel and TD SYNNEX.
Inflation Higher than Dividend Yield
For our final classification, we examine whether Intel could be a dividend stock. According to My Accounting Course, dividend stocks are companies that
consistently return shareholder value in the form of dividends.
To be considered as dividend stocks, we require that companies’ dividend yields be higher than their annualized stock return. Additionally, we require the 5-year dividend yield to also be higher than the 5-year bond yield of the respective countries of each company. For the US, the 5-year US treasury yield is 3.6%. In the table below, we compared Intel against the chipmakers based on dividend yield, 5-year stock return and annualized stock return.
|
Companies |
Dividend Yield (5-year Average) |
Stock Return (5 years) |
5-yr Annualized |
|
Intel |
2.54% |
-12.70% |
-2.68% |
|
MPS |
0.72% |
314.03% |
32.86% |
|
Lattice |
NA |
829.72% |
56.20% |
|
NVIDIA |
0.21% |
229.24% |
26.91% |
|
Marvell |
0.82% |
159.85% |
21.04% |
|
AMD |
NA |
523.95% |
44.22% |
|
ADI |
1.87% |
80.14% |
12.49% |
|
Broadcom |
2.84% |
100.59% |
14.94% |
|
Microchip |
1.45% |
49.79% |
8.42% |
|
TI |
2.42% |
98.61% |
14.71% |
|
NXP |
1.03% |
44.78% |
7.68% |
|
QUALCOMM |
2.86% |
154.67% |
20.56% |
|
ON Semi |
NA |
307.67% |
32.45% |
|
Skyworks |
1.51% |
-7.32% |
-1.51% |
|
Infineon |
1.11% |
1.22% |
0.24% |
|
STMicro |
0.90% |
91.56% |
13.88% |
|
Renesas |
NA |
-5.76% |
-1.18% |
|
Qorvo |
NA |
22.94% |
4.22% |
|
MediaTek |
4.02% |
129.14% |
18.04% |
|
ams Osram |
NA |
-85.73% |
-32.25% |
|
Micron |
NA |
74.67% |
11.80% |
|
Samsung |
2.53% |
162.50% |
21.29% |
|
SK Hynix |
1.36% |
26.45% |
4.81% |
|
Average |
1.76% |
143.04% |
14.31% |
Source: Seeking Alpha, Khaveen Investments
Based on the table above, 17 chipmaker companies have a 5-year dividend history except for Lattice, AMD, ON Semi, Renesas, Qorvo, ams Osram and Micron. From the first point, AMD is the only growth stock included in this list of companies. The average dividend yield among the chipmakers is 1.76% which is lower than the US 5-year yield of 3.6% as shareholders could also benefit from capital gain from share price appreciation.
Intel had the fourth highest 5-year dividend yield at 2.54% behind MediaTek, Broadcom and QUALCOMM. MediaTek has the highest 5-year average dividend yield of 4.02% supported by its TTM yield of 11.72% as its payout ratio increased to 91.25% compared to 62.55% on a 5-year average. Only 2 companies had a higher dividend yield than their 5-year annualized stock return which are Intel and Infineon. However, Infineon’s dividend yield is lower than the industry average of 1.76% at only 1.11%. Though, its yield is still higher than its 5-year annualized stock return as its stock price had surged but decreased by 41% from its peak in the past 1 year. Based on our criteria for dividend stocks, although both Intel and Infineon have a higher 5-year dividend yield than their annualized return, these companies do not meet our requirement of Intel’s dividend yield being above the US treasury 5-year treasury yield of 3.6% and Infineon’s dividend yield below the German 5-year government bond yield of 1.64%. Thus, we do not classify these stocks as dividend stocks.
|
Profitability Analysis |
2013 |
2014 |
2015 |
2016 |
2017 |
2018 |
2019 |
2020 |
2021 |
Average |
|
Dividend Payout Ratio |
46.6% |
37.7% |
39.9% |
47.7% |
52.8% |
26.3% |
26.5% |
26.6% |
28.4% |
33.8% |
Source: Intel, Khaveen Investments
In the past 9 years, Intel’s dividend payout ratio had decreased from 46.6% in 2013 to 28.4% in 2021 with an average of 33.8% during the period. Notwithstanding, the company highlighted its commitment to continuing to increase its dividend in the future. Furthermore, based on its average 9-years ROE of 22.67% and dividend payout ratio of 33.8%, the company has a sustainable growth rate of 15% which bodes well for its dividend growth.
Finally, we paid dividends of $1.5 billion, a 5% increase year-over-year and remain committed to growing the dividend over time. – Dave Zinsner, Chief Financial Officer
Moreover, we then compared Intel with the top US companies based on the revenues of each tech industry within the IT sector.
|
Companies |
Dividend Yield (5-year Average) |
Stock Return (5 years) |
5-year Annualized |
|
IBM (IT Services) |
4.72% |
-6.97% |
-1.43% |
|
Microsoft (Software) |
1.22% |
248.86% |
28.39% |
|
Cisco (Communications Equipment) |
2.92% |
39.91% |
6.95% |
|
Apple (Technology Hardware, Storage & Peripherals) |
1.43% |
284.91% |
30.94% |
|
TD SYNNEX (Electronic Equipment, Instruments & Components) |
1.10% |
66.38% |
10.72% |
|
Intel (Semiconductors & Semiconductor Equipment) |
2.54% |
-12.70% |
-2.68% |
|
Average |
2.32% |
103.40% |
12.15% |
Source: Seeking Alpha, Khaveen Investments
Within the IT sector, Intel had the third highest dividend yield behind IBM and Cisco at a 5-year average of 4.72% and 2.92% respectively. However, only Intel and IBM have a dividend yield above their 5-year annualized stock return and meet our criteria to be defined as a dividend stock. In contrast, Microsoft and Apple had the highest annualized stock return, coinciding with their superior growth among the top companies within the IT sector. That said, these companies have the second and third lowest dividend yields ahead of TD SYNNEX with the lowest dividend yield. Based on the table, only IBM meets our criteria as a dividend stock with its dividend yield higher than its annualized return and its dividend yield higher than the US 5-year treasury yield.
All in all, we judge that Intel is not a dividend stock despite its dividend yield being higher than its annualized stock return on a 5-year average as it does not meet our second requirement which is its yield being higher than the US 5-year treasury yield of 3.6%.
Risk: Low Growth Relative to Competitors
The company has a 5-year average revenue CAGR of only 5.78% which is below the average 17.15% for semiconductor chipmakers. Among Logic companies, Intel’s revenue CAGR is the lowest behind its fierce competitors such as AMD (33.64%) and NVIDIA (34.58%). Additionally, based on our forecasts, we projected Intel’s forward growth of only 7.32% which is lower than the chipmakers’ average forward 5-year growth of 13.01%.
Despite our expectations of higher growth as reflected by a higher forward 5-year growth for Intel, we believe the company’s low growth relative to competitors could affect the company. Based on our definition, we ruled out Intel as a growth stock due to its low growth. Furthermore, we believe its low growth is reflected by its low valuation multiples relative to the industry average. Also, we believe its low growth could lower its dividend growth outlook. Thus, we believe one of the risks of Intel is its low growth.
Valuation
We maintained our revenue projections for Intel as covered in our previous analysis where we accounted for the forecasted PC market decline in our CCG revenue projections for a total revenue decline of -6.7% in 2022 before recovering beyond that with an average 3-year forward growth rate of 6.7%.
|
Intel Revenue Projections ($ bln) |
2020 |
2021 |
2022F |
2023F |
2024F |
2025F |
|
Client Computing Group |
40.535 |
41.067 |
34.25 |
37.23 |
39.71 |
41.56 |
|
Growth % |
6.8% |
1.3% |
-16.6% |
8.7% |
6.7% |
4.7% |
|
Datacenter and AI |
23.413 |
22.691 |
24.71 |
29.25 |
32.79 |
34.73 |
|
Growth % |
7.9% |
-3.1% |
8.9% |
18.3% |
12.1% |
5.9% |
|
Network & Edge |
7.132 |
7.976 |
10.00 |
12.32 |
14.93 |
17.77 |
|
Growth % |
4.4% |
11.8% |
25.4% |
23.2% |
21.1% |
19.0% |
|
AXG |
0.651 |
0.774 |
1.05 |
1.21 |
1.39 |
1.58 |
|
Growth % |
7.4% |
18.9% |
35.4% |
15.7% |
14.6% |
13.6% |
|
Mobileye |
0.967 |
1.386 |
1.82 |
2.37 |
3.07 |
3.93 |
|
Growth % |
10.0% |
43.3% |
31.3% |
30.3% |
29.3% |
28.3% |
|
IFS |
0.715 |
0.786 |
2.61 |
3.14 |
3.69 |
4.26 |
|
Growth % |
55.1% |
9.9% |
232.0% |
20.3% |
17.5% |
15.4% |
|
Others |
5.091 |
5.019 |
0 |
0 |
0 |
0 |
|
Growth % |
22.7% |
-1.4% |
– |
– |
– |
– |
|
Intersegment Revenue |
-0.637 |
-0.675 |
-0.675 |
-0.675 |
-0.675 |
-0.675 |
|
Total |
77.87 |
79.02 |
73.76 |
84.85 |
94.90 |
103.15 |
|
Growth % |
8.2% |
1.5% |
-6.7% |
15.0% |
11.9% |
8.7% |
Source: Intel, Khaveen Investments
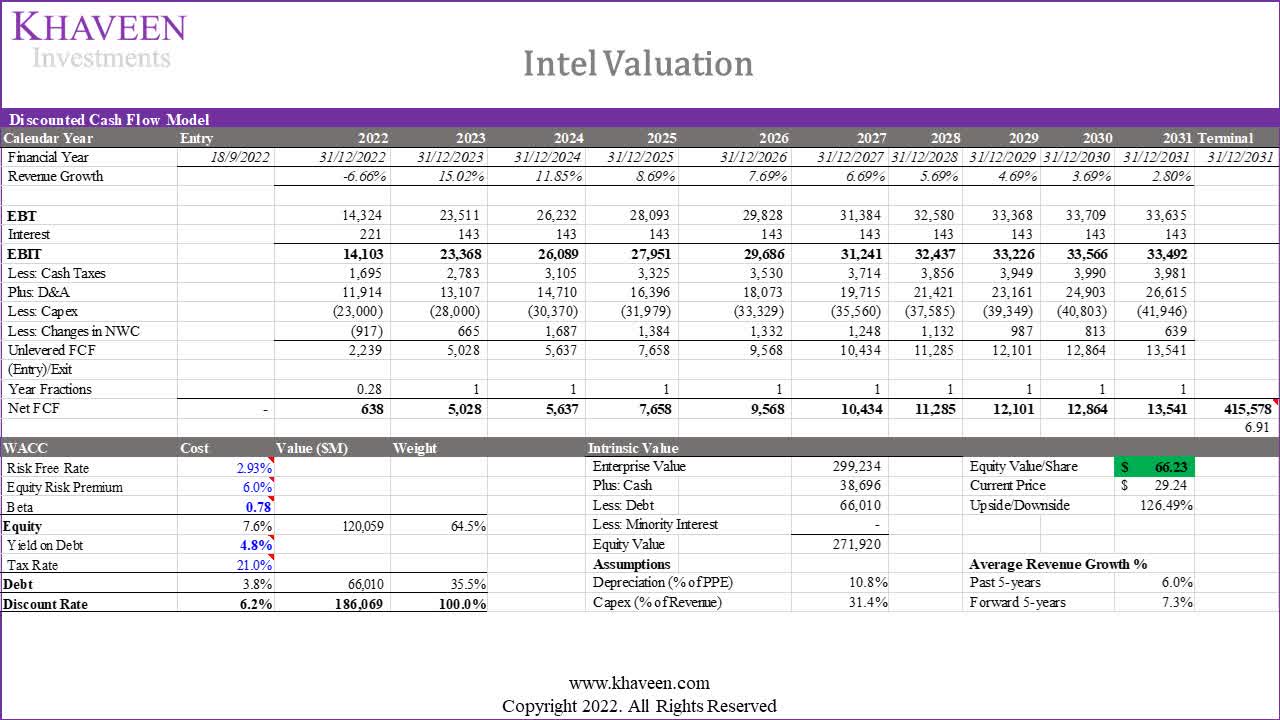
Although we consider Intel a value stock, we valued the company with a DCF analysis as we believe it to be the most accurate valuation method to get the intrinsic value of the company regardless of the stock classification. We based its terminal value on its past 5-year average EV/EBITDA of 6.91x instead of the semiconductor industry average of 14.28x. Based on a discount rate of (6.3%), our model shows its shares are undervalued by 126%.
Khaveen Investments
Verdict
To conclude, we determined that Intel is a value stock based on our analysis of its multiples including its 5-year average P/E ratio which is below our criteria of 12x, P/B below 4x and P/FCF below 20x. We ruled out Intel as a growth stock unlike its Logic chipmaker competitors such as NVIDIA and AMD that have superior revenue growth compared to Intel. Based on our analysis, we also concluded interestingly that Intel is the only Logic-focused chipmaker to be classified as a value stock. Further, despite Intel’s higher 5-year dividend yield than its annualized return, we do not consider Intel as a dividend stock as its yield is below the US 5-year treasury yield of 3.4%.
For our valuation of the company, we believe a DCF analysis is appropriate to value the company but we believe its terminal value based on its historical average EV/EBITDA better reflects its value rather than on an industry average based on our classification of the company as a unique Logic-based value stock. With its stock price has declined by 45% YTD, we maintain our Strong Buy rating for Intel with a target price of $66.23 which translates to a higher upside of 126%
Be the first to comment