

Pgiam/iStock via Getty Images
Investment Portfolio Discipline Summary
Here is our method:
“Blockdesk.com’s Standard Performance Comparison fund invests in equities whenever Market-Maker hedging activity forecasts that 80% or more of the near-coming price range is expected to be to the upside and 10% or less may be to the downside. This is a guide to the balance of expectations, since coming price change directions tend to be led by prior extremes, issue by issue.
At the time of each purchase, a GTC sell order for all of those just bought shares is placed with the broker where bought. His system will monitor and direct to you the sale confirmation when accomplished, probably with encouragement for reinvestment.
At the time of the buy, a mark on your own personal private calendar for 3 months after the purchase, should make a note to review this holding. If it is not yet sold, but at a loss, sell and put the proceeds into the reinvestment stream. If as usual it is at a gain, after considering alternatives, you decide to sell then or move the calendar note a month further forward – but just once.
This article’s primary focus is on Inspire Medical Systems, Inc. (NYSE:INSP).
Description of Primary Investment Candidate
“Inspire Medical Systems, Inc., a medical technology company, focuses on the development and commercialization of minimally invasive solutions for patients with obstructive sleep apnea (OSA) in the United States and internationally. The company offers Inspire system, a neurostimulation technology that provides a safe and effective treatment for moderate to severe OSA. It also develops a novel, a closed-loop solution that continuously monitors a patient’s breathing and delivers mild hypoglossal nerve stimulation to maintain an open airway. The company was incorporated in 2007 and is headquartered in Golden Valley, Minnesota.”
Source: Yahoo Finance.
Yahoo Finance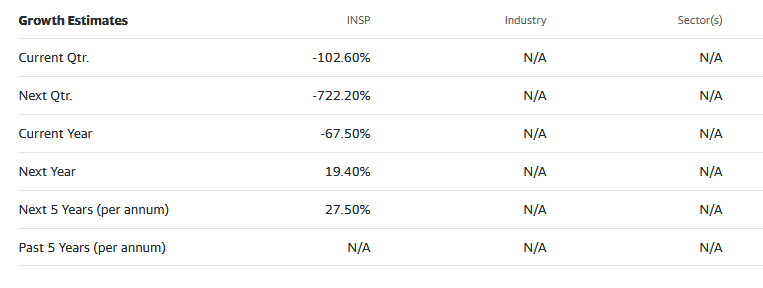
These growth estimates have been made by and are collected from Wall Street analysts to suggest what conventional methodology currently produces. The typical variations across forecast horizons of different time periods illustrate the difficulty of making value comparisons when the forecast horizon is not clearly defined.
Risk and Reward Balances Among INSP Competitors
Here are several healthcare equipment industry services like INSP. Following the same analysis as with INSP, historic sampling of their prior Risk-Reward balances like those of today were taken, and are mapped out in Figure 1.
Figure 1
blockdesk.com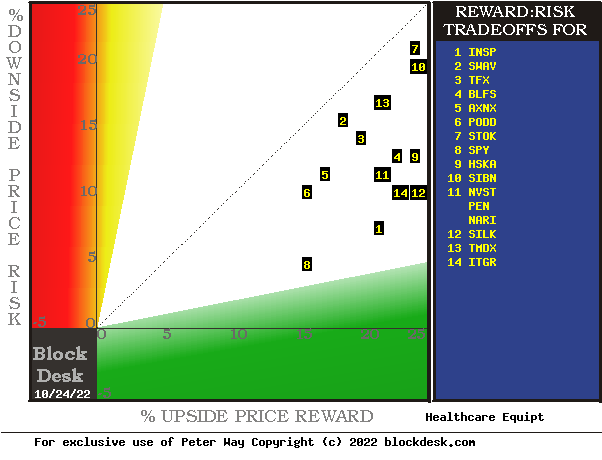
(Used with permission)
Expected rewards for these securities are the average gains from the current closing market price seen worth protecting short positions. Their measure is on the horizontal green scale.
The risk dimension is of actual price draw-downs at their most extreme point while being held in the previous pursuit of upside rewards similar to the ones currently being seen. They are measured on the red vertical scale.
Both scales are of percent change from zero to 25%. Any stock or exchange-traded fund (“ETF”) whose present risk exposure exceeds its reward prospect will be above the dotted diagonal line. Capital-gain attractive to-buy issues are in the directions down and to the right.
Our principal interest is in INSP at location [1], at the lower-right edge of the symbols cluster. A “market index” norm of reward~risk tradeoffs is offered by SPY at [8]. Most appealing (to own) by this Figure 1 view is INSP.
Comparing Features of Alternative Investment Stocks
The Figure 1 map provides a good visual comparison of the two most important aspects of every equity investment in the short term. There are other aspects of comparison which this map sometimes does not communicate well, particularly when general market perspectives like those of SPY are involved. Where questions of “how likely” are present other comparative tables, like Figure 2, may be useful.
Yellow highlighting of the table’s cells emphasizes factors important to securities valuations and the security INSP, most promising of near capital gain as ranked in column [R].
Figure 2
blockdesk.com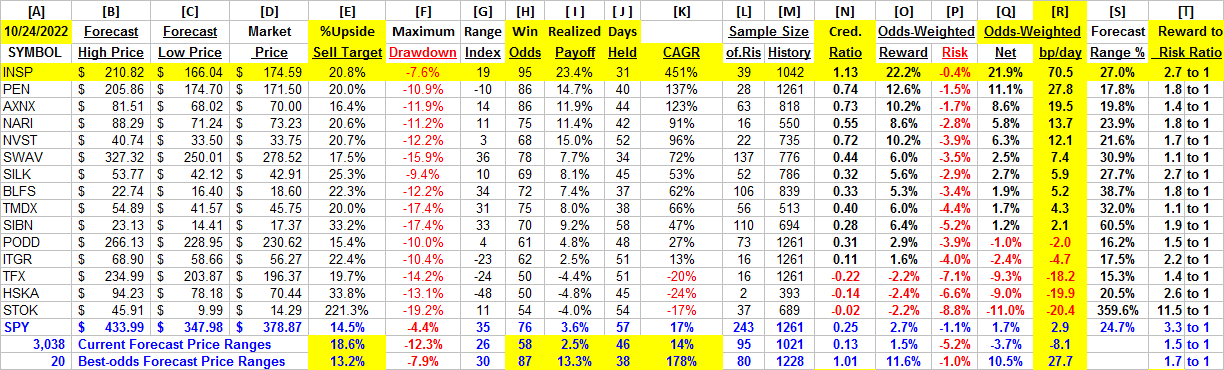
(Used with permission)
Why Do All This Math?
Figure 2’s purpose is to attempt universally comparable answers, stock by stock, of: a) How big the prospective price gain payoff may be; b) how likely the payoff will be a profitable experience; c) how SOON it may happen; and d) what price draw-down risk may be encountered during its holding period.
Readers familiar with our analysis methods after a quick examination of Figure 2 may wish to skip to the next section viewing Price range forecast trends for INSP.
Column headers for Figure 2 define investment-choice preference elements for each row stock whose symbol appears at the left in column [A]. The elements are derived or calculated separately for each stock, based on the specifics of its situation and current-day MM price-range forecasts. Data in red numerals are negative, usually undesirable to “long” holding positions.
Table cells with yellow fills are of data for the stocks of principal interest and of all issues at the ranking column, [R].
The price-range forecast limits of columns [B] and [C] get defined by MM hedging actions to protect firm capital required to be put at risk of price changes from volume trade orders placed by big-$ “institutional” clients.
[E] measures potential upside risks for MM short positions created to fill such orders, and reward potentials for the buy-side positions so created. Prior forecasts like the present provide a history of relevant price draw-down risks for buyers. The most severe ones actually encountered are in [F], during holding periods in an effort to reach [E] gains. Those are where buyers are emotionally most likely to accept losses.
The Range Index [G] tells where today’s price lies relative to the MM community’s forecast of upper and lower limits of coming prices. Its numeric is the percentage proportion to the downside of the full low to high forecast seen below the current market price.
The use of prior market actions subsequent to RIs like today makes it necessary that those priors be representative of experiences in the just-past 5-year period of 1261 market days. Any RI sample of less than 20 market days could have occurred in one month of 21 market days. Out of the 5 years of 60 months, such a performance might well be not representative of the whole period.
[H] tells what proportion of the [L] sample of prior like-balance forecasts have earned gains by either having the price reach its [B] target or be above its [D] entry cost at the end of a 3-month max-patience holding period limit. [I] gives the net gains-losses of those [L] experiences.
What makes INSP most attractive in the group at this point in time is its basic strength of reward to risk ratio of 2.7 to 1 in [T].
Further, Reward-Risk tradeoffs involve using the [H] odds for gains with the 100 – H loss odds as weights for N-conditioned [E] and for [F], for a combined-return score [Q]. The typical position holding period [J] on [Q] provides a figure of merit [fom] ranking measure [R] useful in portfolio position preferencing. Figure 2 is row-ranked on [R] among alternative candidate securities, with ISPN in top rank.
Along with the candidate-specific stocks these selection considerations are provided for the averages of some 3000+ stocks for which MM price-range forecasts are available today, and 20 of the best-ranked (by fom) of those forecasts, as well as the forecast for S&P 500 Index ETF (SPY) as an equity-market proxy.
Current-market index SPY is not competitive as an investment alternative with its Range Index of 35 indicating the other 2/3rds of its forecast range is to the upside, yet little more than 3/4ths of previous SPY forecasts at this range index produced profitable outcomes, with enough losers to put its average in single-(whole) digit positive result in column [I].
As shown in column [N] of figure 2, those levels in comparison to their row forecasts [E] vary significantly between stocks. What matters is the net profit between investment gains and losses actually achieved following the forecasts, shown in column [I]. The Win Odds of [H] tell what proportion of the Sample RIs of each stock were profitable. Odds below 80% often have proven to lack reliability.
Price Range Forecast Trends for ISPN
Figure 3
blockdesk.com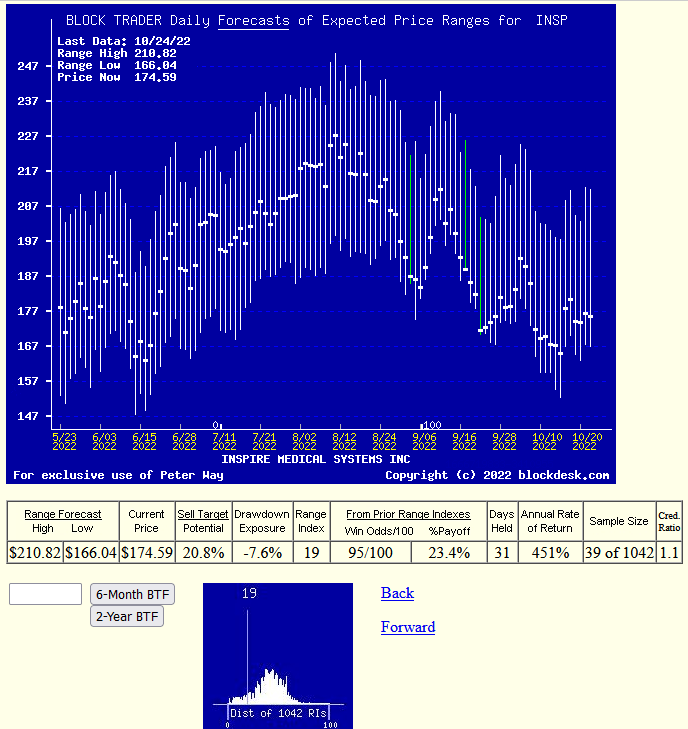
(Used with permission)
No, this is not a “technical analysis chart” showing only historical data. It is a Behavioral Analysis picture of the Market-Making community’s actions in hedging investments of the subject. Those actions define expected price change limits shown as vertical bars with a heavy dot at the closing price on the date of the forecast.
It is an actual picture of experienced market professionals’ expected future prices, not a simple hope of a recurrence of the past. These expectations are backed up by significant bets of investment capital made to protect market-makers or to earn a proprietary profit from risk-taking.
The special value of such pictures is their ability to immediately communicate the balance of expectation attitudes between optimism and pessimism. We quantify that balance by calculating what proportion of the price-range uncertainty lies to the downside, between the current market price and the lower expected limit, labeled the Range Index [RI].
In this structure, a RI at zero indicates no further price decline is likely, but not guaranteed. The odds of 3 months passing without either reaching or exceeding the upper forecast limit or being at that time below the expected lower price (today’s) are quite slight.
The probability function of price changes for INSP is pictured by the (thumbnail) lower Figure 3 frequency distribution of the past 5 years of RI values, with the today value indicated.
Conclusion
The multi-path valuations explored by the analysis covered in Figure 2 are rich testimony to the near-future value prospect advantage of a current investment in Inspire Medical Systems, Inc. over and above the other compared alternative investment candidates.
Be the first to comment