

Pijitra Phomkham
Investment summary
Following our previous publication on Inogen, Inc. (NASDAQ:INGN), where we reaffirmed our hold call, we’ve seen the stock drift 17% to the downside. It now trades within the range of its 2-year lows, and following its latest set of numbers, we’re here to discuss our latest examination findings on the company. In this analysis, we’ll strip back the company’s quarterly financials, to demonstrate similar headwinds to top and bottom line growth. In that vein, we’ve noticed a similar theme present throughout the company’s P&L, and management foresees this continuing down the line.
Here are our last 3 publications on INGN, from newest to oldest. We encourage you to check them out:
- Structural, Supply Chain Headwinds Remain
- Seasonal FCF, Tightening Margins, Supply Chain Headwinds
- Significant Downward Pressures Over The Last 2 Years Ex-Pandemic
Net-net, and regrettably, we’ve made no change to our hold thesis on INGN, and urge investors to tread cautiously if actively trading this name.
INGN Q3 financials: demand flat, with similar themes from previous calls
Turning to INGN’s financial results, one positive we saw is that demand in its direct-to-consumer (“DTC”) and business-to-business (“B2B”) is flat, evidenced by the cash sales booked in both segments. Management noted it is seeing good conversion as it focuses on normalizing its supply chain headwinds in the US and outside US markets.
With respect to income, we saw constant currency revenue growth of 14.5% from the previous year. However, on a reported basis, there was a 130bps forex (“FX”) headwind to revenue. Baking this in, INGN clipped Q3 revenue of $105.4mm, up from $93.1mm the year prior. It pulled this down to a quarterly operating loss of $10.29mm as OpEx widened by 28% YoY. Primarily, we noted the gain in OpEx originated from labor costs, versus outright expenditure on operations. You can see INGN’s operating summary from FY16-date in Exhibit 1.
The Q3 revenue breakdown was $90.6mm from sales revenue, with the remaining $14.7mm booked from rental. Although, we should also advise that INGN’s DTC revenue slipped 910bps YoY to $33.1mm.
This stemmed from a limited ability to complete shipments and the subsequent lower volumes associated with this. To be honest, we were a little unsatisfied with the Q3 earnings presentation, that only quoted FY21 full-year numbers, comparing to FY20 percentages with gross margin (see: INGN Q2 investor presentation, pp. 5).
Speaking of margins, Q3 FY22 gross margin on sales revenue compressed 11.7% YoY to a meager 38.4%. This was followed by a 440bps YoY contraction to rental revenue. INGN CFO Kristin Caltrider said it best on the call:
“[reduced sales gross margin was] due to the unfavorable channel mix and higher material costs driven by open-market buys and inflationary pressures, partially offset by higher selling prices”.
Alas, the persistence of macroeconomic headwinds, including supply chain and inflation inputs, continued to dominate INGN’s earnings last quarter. This continues to wreak havoc on its free cash flows in our opinion, such that the coupling of return on capital and FCF continues to head south (Exhibit 2). We also made note of this trend in our last INGN note. In that regard, this helps confirm our neutral standpoint on the company.
Exhibit 1. INGN quarterly operating summary, FY16-date – note, cyclical revenue print with negative EBITDA, FCF yield
Note: As the company has a negative trailing FCF yield throughout this YTD, we have opted to exclude charting the negative values. TTM FCF Yield is calculated as [FCF TTM / rolling enterprise value]. (Data: HBI, Refinitiv Eikon, Koyfin)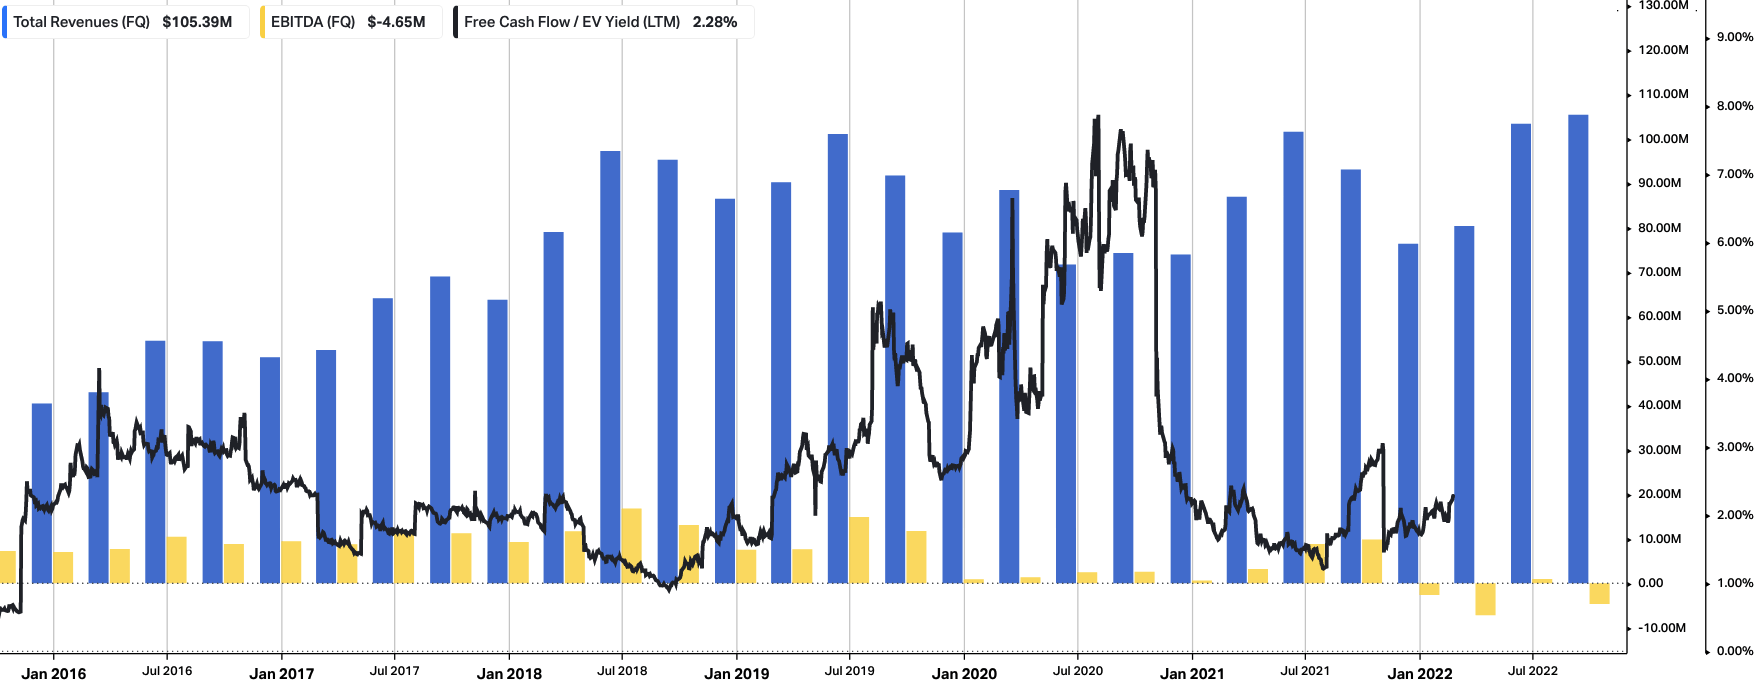
Exhibit 2. INGN free cash flows and corresponding return on capital employed
Data: HBI, Refinitiv Eikon, Koyfin
INGN: the technical picture
Given the market’s appraisal of INGN in 2022 we’ve been constantly cross-checking against its chart studies to see where investors are positioning in the stock.
You can see below that INGN has ridden its 50DMA down from March this year. In reality, the 50DMA has acted as a meaningful resistance line for the stock from midway last year.
More recently the 250DMA crossed beneath the 50DMA – the infamous ‘death cross’ – and with that, we’ve seen a new, steeper downtrend from since August.
Looking at weekly volume trends, in the lower pane of Exhibit 3, we see that, despite several attempted breakouts, there hasn’t been the continuation in volume that’s required to demonstrate institutional accumulation. Instead, each volume reversal and breakout has seen volume dry up in the weeks following.
Moreover, if we just focus on each sideway consolidation in FY22 for a second (Jan-Mar; May-Jun; Sept-Nov), note at the formation of each base, the volume trend declined. To us, this is further evidence of heavy resistance.
As you can see, all of these data points are a stark contrast to the FY20 period.
Exhibit 3. INGN 24-week price evolution, with heavy resistance at the 50DMA. Note, 250DMA/50DMA cross in September and November (weekly bars, log scale)
Data: Updata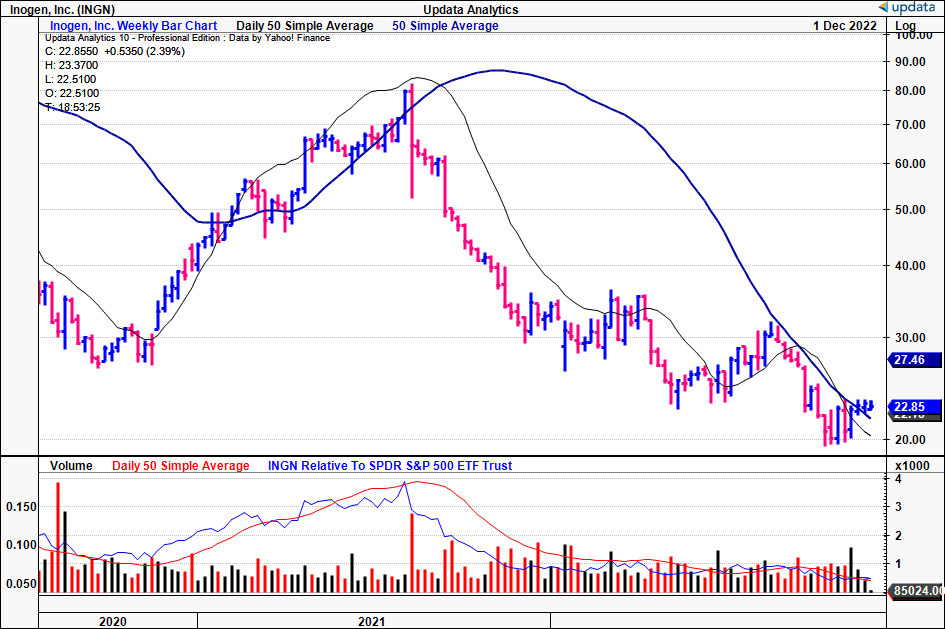
As such, we’ve turned to point and figure charting analysis to gauge things in a more objective manner. These studies have served us well to date. As you can see in Exhibit 4, the last target was to $19, and the stock bottomed at $20 just before its Q3 numbers.
With the latest price action curling up off this bottom, we’ve got an upside target to $29.25, roughly about the middle resistance line shown below. Again, this appears to be a point of longer-term resistance. From our notes above, INGN has failed several attempts to break above key resistance points these past 18 months. So the question is, can it get above $29? We’re not so confident, but, given recent macroeconomic events (in particular, Fed Chair Jerome Powell’s most recent speech on inflation and the labor market) we aren’t ready to advocate the stock as a sell either.
Exhibit 4. Upside targets to $29, which looks to be a longer-term resistance level. INGN stock has a history of failing to breakout above longer-term resistance levels
Data: Updata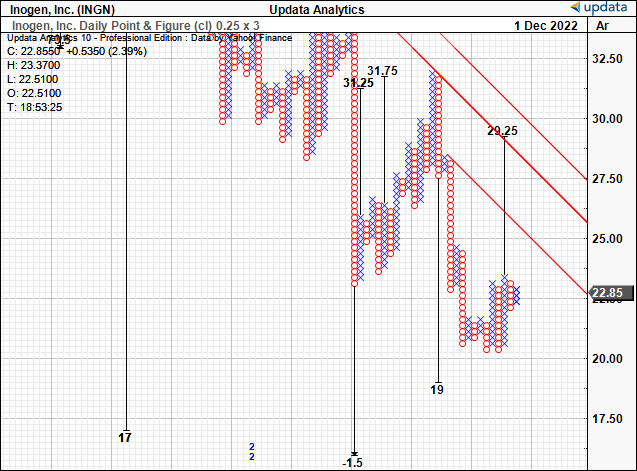
Conclusion
We’d note consensus has INGN valued at 1.4x forward sales, an unimpressive multiple to run with. As noted, this is a 69.5% discount to the sector, and a 72% discount to 5-year trailing average. Question is, does this really represent value or not?
Let’s think about this pragmatically for a second. When looking at forward estimates and multiples, we prefer to have a stock trading at a premium to peers and the S&P 500, as this suggests the market’s expectations are for an above-sector/benchmark performance.
To say a stock is trading at a c.70% discount to peers on forward sales doesn’t indicate an expectation of outperformance in our estimation. Instead, it implies the market’s view of an underwhelming result, as mentioned.
We’d also point out that management forecasted revenue guidance of $92mm at the upper range, calling for FY22 turnover of $381mm.
Alas, assigning the 1.4x forward sales multiple to this number, we see the stock trading fairly at $23.20. Again, this confirms our hold thesis. Consequently, we make no change to rating or price objective for INGN – rate hold.
Be the first to comment