

Sabih Jafri/iStock Editorial via Getty Images
The Motley Fool 100 Index ETF (BATS:TMFC), the tech-heavy investment vehicle I have been covering since January 2022, has had a stellar start to 2023, outperforming the market represented by the iShares Core S&P 500 ETF (IVV) by about 5%, though lagging Invesco QQQ ETF (QQQ) marginally.
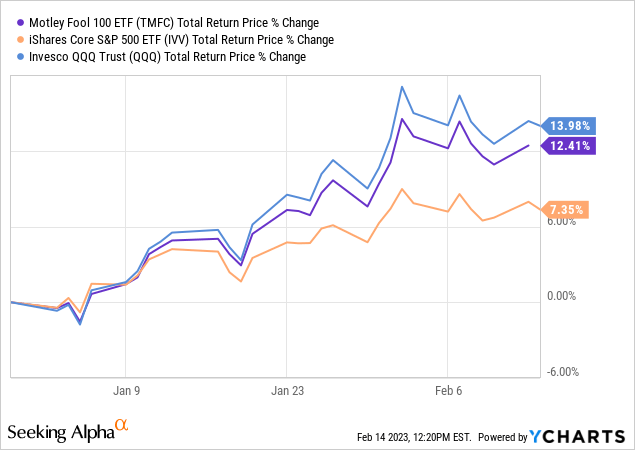
Since my previous note published in November, it has also managed to deliver a higher return than the market as illustrated below.
Seeking Alpha
This outperformance is explainable as the retreating inflation narrative has been front and center, serving as a potent catalyst for expensive stocks that bore the brunt of last year’s bear market. But has the long-term picture changed with this relief rally? And does that mean the Motley Fool ETF deserves an upgrade today? Let us discuss.
A short investment strategy recap
As a refresher, TMFC’s cornerstone is the Motley Fool 100 Index. In short, as described on Fool Indices, it “was developed by The Motley Fool to define and track the largest, most liquid U.S. companies that have been recommended by the Fool’s analysts.” Put another way, this is a high-conviction strategy focused on U.S. bellwethers with quality nothing short of exemplary.
Update on portfolio composition
Since my previous coverage, TMFC’s underlying index has undergone a quarterly reconstitution, so it makes sense to look under the hood to assess whether something has changed fundamentally regarding composition, value/quality mix, etc., welcoming a more bullish view on the vehicle or not.
Upon closer inspection of the holdings as of February 13 (the full list can be found on its website), I found out that it removed only five stocks, together accounting for about 3.1% as of the previous note, namely the following:
| Stock | Weight as of 25 November 2022 |
| Texas Instruments (TXN) | 0.94% |
| QUALCOMM (QCOM) | 0.79% |
| S&P Global (SPGI) | 0.67% |
| American Express Company (AXP) | 0.66% |
| SVB Financial Group (SIVB) | 0.08% |
Do I agree with the decision to rotate out of these names? Well, the situation is nuanced. For instance, I would say that I would welcome the removal of SPGI and AXP since they trade around the overinflated levels as illustrated by the Seeking Alpha Quant Valuation grade of F, the worst possible.
Seeking Alpha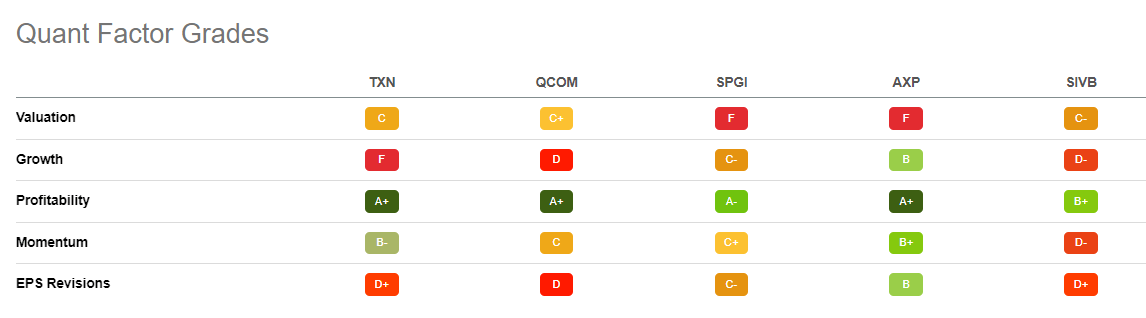
At the same time, I would cautiously assume that these five stocks left the index mostly on growth concerns. For example, TXN’s forward revenue growth rate has dropped from 8.3% as of writing my previous note to only 2.5%, with some downward revisions on the profitability side also, as the forward diluted EPS growth rate declined from 9.9% to only 80 bps. A similar trend can be observed in the case of QCOM, which is now forecast to deliver a 9.3% forward revenue growth vs. 11.2% in November.
SPGI, AXP, and SIVB also cannot boast an improvement in their growth profiles, with the top and bottom lines all downgraded, with SIVB’s EPS even anticipated to contract going forward.
| Ticker | Revenue Fwd (November) | Revenue Fwd (February) | EPS Fwd (November) | EPS Fwd (February) |
| TXN | 8.3% | 2.5% | 9.9% | 0.80% |
| QCOM | 10.7% | 9.3% | 13.1% | 10.88% |
| SPGI | 18.9% | 17.0% | 3.2% | 1.65% |
| AXP | 17.6% | 15.81% | 41.0% | 7.7% |
| SIVB | 15.3% | 3.4% | 0.1% | -7.99% |
An essential remark is that I am not aware of the exact rationale behind their removal from the index and the portfolio and the growth issue being the trigger is my opinion only.
Has the removal of these stocks positively impacted TMFC’s returns in 2023? In fact, it more likely has not, as the fund has missed fairly robust gains, especially when it comes to AXP or SIVB, which have surged by almost 24% and over 38% since the beginning of the year.
Seeking Alpha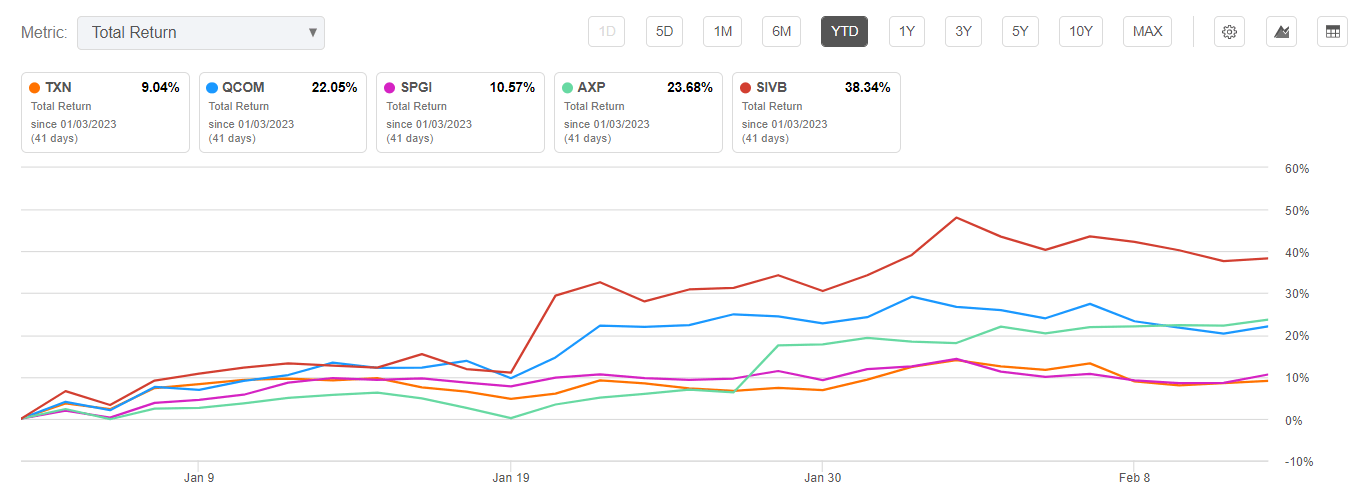
Just to give slightly more color, 88 holdings accounting for close to 87% of the net assets have delivered lower returns than AXP, with 20 stocks (12.7% weight) actually declining this year, with the median YTD return for the overall portfolio being only 9.2%.
In the meantime, the following names have been added:
| Stock | Weight |
| Oracle (ORCL) | 1.31% |
| Arista Networks (ANET) | 0.23% |
| Cummins (CMI) | 0.19% |
| Warner Bros. Discovery (WBD) | 0.19% |
| Seagen (SGEN) | 0.14% |
| Cloudflare (NET) | 0.11% |
Have the additions contributed to returns? As the stocks’ performance this year illustrates, they likely had; for example, WBD has almost the strongest year-to-date return amongst the fund’s current holdings, trailing only Tesla (TSLA) which delivered about 58%.
Seeking Alpha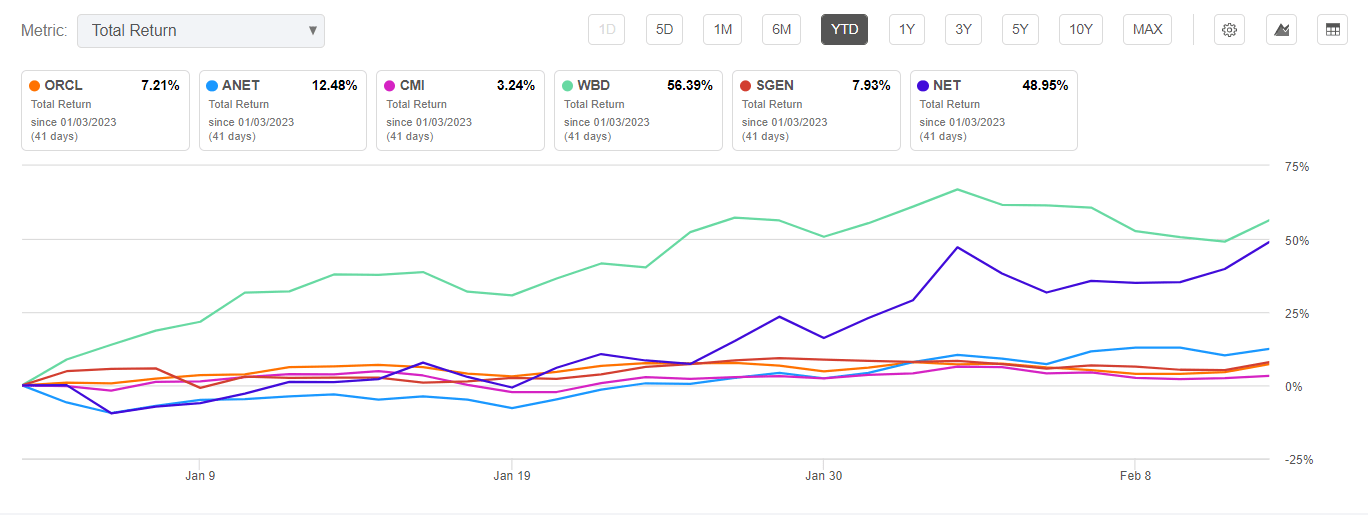
Sector and factor exposure changes
Since end-November, TMFC’s weighted-average market cap has advanced marginally, now standing at about $849 billion vs. $835.6 billion as of the previous coverage. Please take note that this Motley Fool ETF has overweening exposure to Apple (AAPL) and Microsoft (MSFT) that together account for around 24.4% being the top contributors to the WA market cap, as well as other portfolio-wise parameters like the earnings yield.
Speaking of the EY, it has compressed a bit, retreating from 3.6% to 3.2%, as per my calculations. As a quick reminder, I compute this yield myself using the net income and market cap data pulled from the Seeking Alpha portfolio tool. However, despite the decline in the EY, the share of markedly overpriced stocks (a D+ Quant Valuation grade and worse) has dropped to 79.3% from 89.6%; nevertheless, it is intolerably large for my taste.
Exposure to quality, however, has not changed; over 99% of the holdings have a Quant Profitability grade of B- and better, a stellar result.
Next, has anything changed regarding sector allocations? Only a little. For example, IT now accounts for over 43% vs. ~42% previously; sure, its dominance is still unrivaled.
Petroleum names still have issues qualifying for the TMF 100 index as the fund has only one energy stock in its basket, Kinder Morgan (KMI), with a microscopic weight of just 20 bps, in-line with the November version.
Also, it is of note that the growth deceleration trend I touched upon in the previous article remains an issue. Let me quote it briefly,
Comparing the weighted average forward revenue growth rates that the April, July, and current versions of the portfolio sported, I noticed a trend. More specifically, the WA rate was at about 18.8% in April, then at approximately 18% in July, and, finally, at 14% in November. Are analysts factoring in a higher cost of capital across the board or indirectly acknowledging the recession is no longer an impossible outcome? Time will tell.
The fact is the forward revenue growth rate now stands at about 11.2%.
Is TMFC a Buy now?
In conclusion, since my previous note, TMFC has added six and removed five stocks, with the weighted-average market cap and earnings yield almost unchanged and sector exposure remaining homogeneous, precisely as I expected.
The Motley Fool fund has certainly surprised on the upside since November thanks to the inflation-is-over narrative, yet this changes little about the long-term neutral view.
The principal drawback of this vehicle is that as it comes from the portfolio composition, valuation is its perennial issue, with little hope for improvement, which, as we saw last year, could backfire, and painfully, with the quality factor offering almost no support.
Let me be clear. TMFC was capable of delivering outstanding gains even despite appalling performance in 2022 (when it lost close to 31%), with the compound annual growth rate over the February 2018 – January 2023 standing at 11.3% thanks to a tremendously successful 2020 when it delivered a 42% total return.
|
Portfolio |
IVV | TMFC | QQQ |
| Initial Balance | $10,000 | $10,000 | $10,000 |
| Final Balance | $15,730 | $17,067 | $18,003 |
| CAGR | 9.48% | 11.28% | 12.48% |
| Stdev | 18.68% | 21.07% | 21.99% |
| Best Year | 31.25% | 42.00% | 48.40% |
| Worst Year | -18.16% | -30.85% | -32.58% |
| Max. Drawdown | -23.93% | -30.85% | -32.58% |
| Sharpe Ratio | 0.51 | 0.55 | 0.59 |
| Sortino Ratio | 0.75 | 0.85 | 0.9 |
| Market Correlation | 1 | 0.95 | 0.94 |
Created using data from Portfolio Visualizer
However, for the sake of consistency, with respect to my focus on value & profitability and not on top-quality only, owing to TMFC ETF having a measly earnings yield, I maintain the Hold rating.
Be the first to comment