Nasdaq 100 & DAX 30 Price Outlook:
Nasdaq 100 & DAX 30 Price Forecast: Indices Grasp for Support in Bear Markets
Stocks have endured a brutal week thus far and the Nasdaq, S&P 500 and Dow Jones trade tenuously in bear market territory as a consequence. With the World Health Organization officially classifying the coronavirus as a pandemic and countries mulling containment responses, fears continue to rage. Therefore, volatility looks poised to continue until fiscal policy measures or further monetary policy action is announced.
That being said, delivery of proposed policies does not guarantee stability as was witnessed in price action following the Fed’s emergency rate cut and the more-recent Bank of England rate reduction. To be sure, uncertainty, apprehension and emotions are running high in the market which has likely fed into the drastic price swings we’re currently witnessing.
How to Invest During a Recession: Investments & Strategy
Thus, forecasting directional moves with confidence becomes exceedingly difficult. As a result, staying cognizant of the fundamental forces at play and the major technical levels nearby will be critical in navigating the immense volatility at hand.
Nasdaq 100 Technical Forecast
To that end, price action on the Nasdaq 100 chart reveals endangered support. Trading in-line with the index’s July 2019 swing high, a slight extension lower would see the level broken and draw subsequent support from the August 2018 high into play. Monday’s intraday low may also provide a modicum of support between the two zones but with the Dow Jones slipping into bear market territory, risk appetite may suffer further.
Nasdaq 100 Daily Price Chart (July 2018 – March 2020)
DAX 30 Technical Forecast
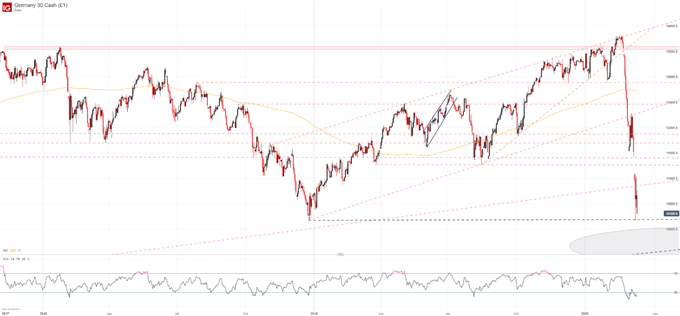
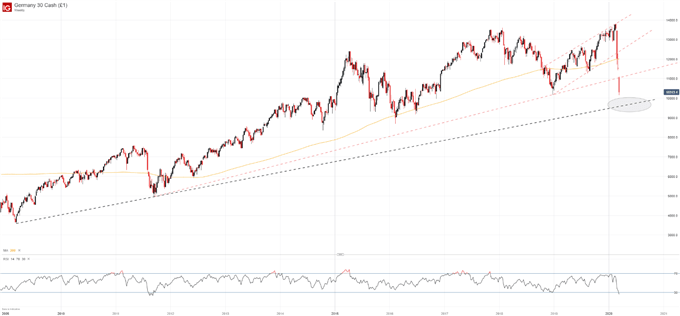
Despite significant differences in their underlying economies, the DAX and Nasdaq are similarly exposed as investors look to shy away from risky assets altogether. In turn, the DAX 30 has fallen to the December 2018 lows around 10,165. It now stands as the most notable line between spot price and a prospective trendline drawn from the 2009 and 2011 lows.
DAX 30 Daily Price Chart (November 2017 – March 2020)
Should risk appetite unravel further, the DAX may look to slip beneath the level around 9,600 and fall deeper into bear market territory. In the meantime, follow @PeterHanksFX on Twitter for updates and analysis as the equity market tries to cling onto its hard-fought gains.
DAX 30 Weekly Price Chart (January 2008 – March 2020)
–Written by Peter Hanks, Junior Analyst for DailyFX.com
Contact and follow Peter on Twitter @PeterHanksFX


Be the first to comment