

PeopleImages
The Global X Income Outlook for Q3 2022 can be viewed here. This report seeks to provide macro-level data and insights across several income-oriented asset classes and strategies.
Last quarter, we discussed the ongoing trends of sticky inflation and a hawkish Federal Reserve (FED). These trends accelerated in Q2 as the U.S. Consumer Price Index (CPI) rose again to 9.1% in June. The Fed hiked rates by 50 basis points (bps) in May and 75bps in June, the latter being the largest rate hike since 1994.1 Other central banks like those in Australia, the UK and Canada have also been hiking rates rapidly, with the Bank of Canada surprising markets via a 100 bp hike in July.2 These conditions and their widespread impact can make it difficult for traditional equities and bonds to perform. However, we believe investors have options to generate income with alternative income strategies proving resilient in this environment.
Key Takeaways
- Rate hike expectations accelerated for the Fed, the European Central Bank (ECB) and central banks around the world, with markets expecting more aggressive hiking will be required to rein in inflation. Also, the Fed and the ECB have ended their stimulatory quantitative easing programs.
- Low duration instruments like variable rate preferreds may be an alternative for fixed income investors looking to mitigate interest rate risk but maintain their income objectives.
- Real assets and energy equities, such as MLPs (Master Limited Partnerships), have performed well year-to-date and continue to offer attractive fundamentals and valuations.
- Equity volatility remains elevated, but strategies such as covered calls can offer compelling opportunities for income investors.
Fed Rate Hike Expectations Rise As Inflation Proves Sticky
U.S. CPI reached 9.1% year-over-year (YoY) in June, its highest since 1981 and above the consensus forecast. The drivers were broad-based, but the June print indicated a shift from goods to services inflation as the predominant driver, with shelter price inflation one example. Core inflation was 5.9% in June, which was above forecast, although the annual figures have been trending down since March 2022. The fresh high in headline inflation led the market to price a high possibility of a 100bp rate hike at the Federal Open Market Committee’s (FOMC) July meeting. Fed Vice Chair Lael Brainard noted that she would be watching core inflation and viewed this would start to moderate over the coming months as the interest rate hikes take effect in the economy.3
In terms of the end Fed funds rate, or the terminal rate, the market is now pricing a peak of 3.7% in February 2023, compared to 2.6% priced in for February 2023 at the end of Q1.4 This increase suggests that the market expects more aggressive hiking will be required to control inflation. The ECB also noted in June that their quantitative easing program ended on July 1st and will be followed by a rate hike of 25bps at the next meeting which takes place later in July.
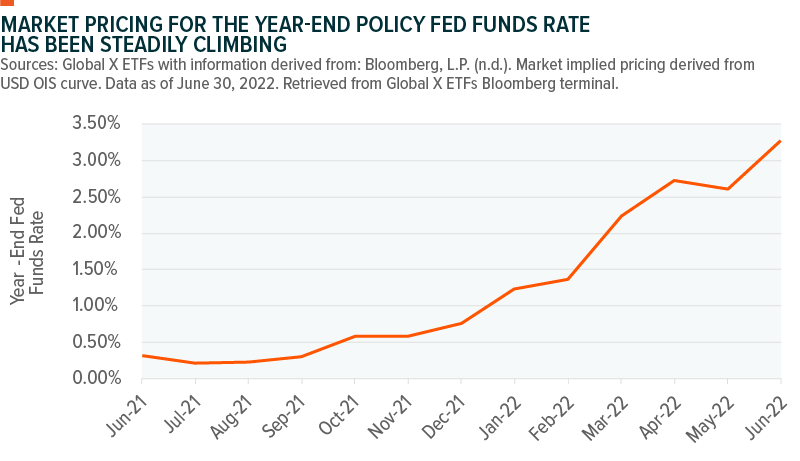
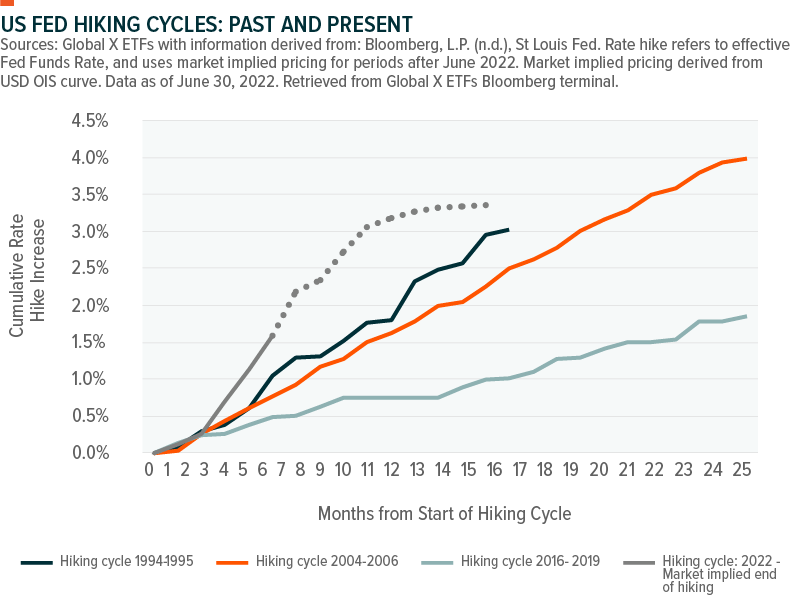
Compared to past hiking cycles, the now implied benchmark rate of 3.3% at year-end would be a rapid increase in a short time frame for the Fed. For perspective, in recent years the Fed viewed the long-term fed funds rate sitting in the 2-3% range (per Fed FOMC dot plots).
Accordingly, this level of hiking priced into markets has negatively affected interest rate-sensitive assets. Of course, one of the biggest topics of discussion is what inflation and the subsequent monetary policy response to it means for economic growth and the potential for a recession. The U.S. yield curve inverted in April and June, meaning the 2-year bond yielded more than the 10-year bond. As is typical, these inversions made headlines, given the yield curve’s history as a leading indicator of recessions. However, a yield curve inversion is not a perfect predictor, and the timing between inversion and the onset of recession is often not immediate, but with high likelihood of a recession in the next one to two years.5
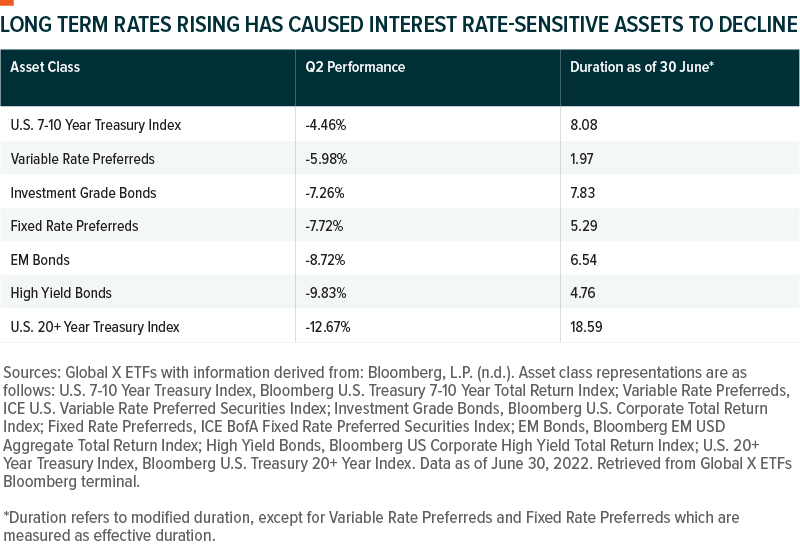
Long-term interest rates rose in Q2, with the US 20-year treasury rising from 2.59% to 3.38%.6 Long term rates rising caused interest rate-sensitive assets to decline, as the table below illustrates. Notable to this income discussion is that variable rate preferreds outperformed fixed rate preferreds due to their shorter durations, but U.S. Treasuries outperformed credit due to a widening of credit spreads.
Real Assets Such As Commodities-Based Equities Are Outperforming
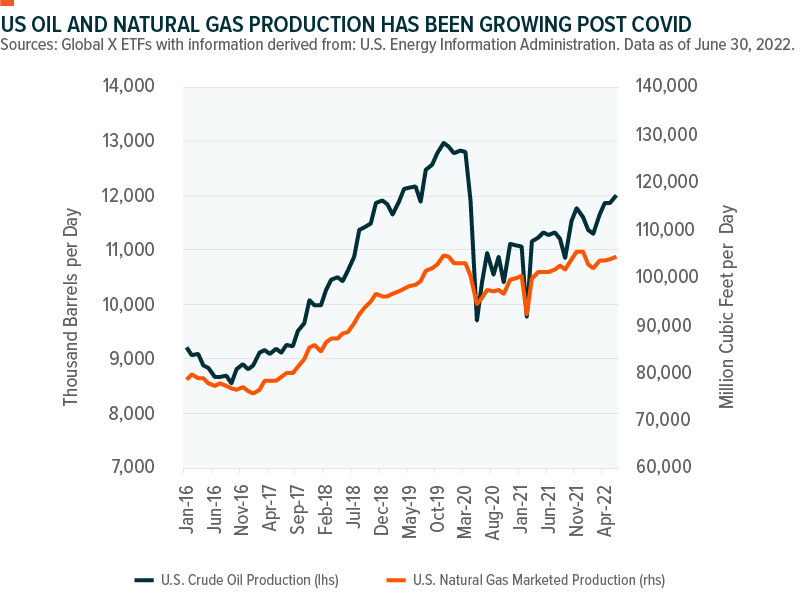
Commodities-based equities like MLPs tend to perform better in inflationary environments because their cash flows and asset values tend to rise with inflation. MLP sectors such as pipelines tend to have set rates which may include provisions to rise with producer price inflation. In Q2, MLPs returned -6.7% and the S&P 500 declined by -16.1%.7 U.S. energy production remained strong and continued to rebound from production cuts stemming from the initial COVID-19 response, reaching a post COVID high of just under 11.9 million barrels per day. Strong production is supportive of energy infrastructure companies, as they derive revenue from the volume of energy resources handled. The volume of energy produced is typically correlated to higher energy prices, as is the case now.
OPEC crude production reached 28.8 million barrels per day in June, compared to 30.0 million barrels per day in June 2019. Production growth has been limited year-to-date, with only a marginal increase from the rate of 28.1 million barrels per day at the end of 2021.8 As the chart below illustrates, U.S. production has been on an upswing. U.S. crude oil production increased by 6.3% over the last 12 months to June 30, while U.S. natural gas production had increased by 3.0% over the same period. US producers may be more likely to take advantage of a higher commodity price environment and step in to shore up the energy shortfall, benefiting midstream MLPs.
Oil prices traded in a range of $94 to $122 per barrel during the quarter before ending at $106.9 Supply side and demand side factors drove prices, and in our view these factors are likely to continue to dictate prices.
- Supply concerns include the European Union’s Q2 announcement of partial bans on imports of Russian oil. The EU’s measure follows a similar ban by the U.S. in Q1, which left the U.S. energy independent from Russia.10 Conversely, China has increased its proportion of imports from Russia, and secured a lower price in the process with many countries refusing to import from Russia.11
- OPEC recently announced production increases, but reports suggest that production may struggle to rise substantially. Some key oil-exporting nations, such as Saudi Arabia, Libya, and Nigeria, are already struggling to increase production from current levels.12
- China continues to struggle meeting its economic growth targets, largely due to restrictive COVID policy measures. As the world’s largest importer of crude, China’s difficulties negatively impact oil demand.13 However, institutions such as the World Bank forecast China’s growth to pick up later in 2022 with government policy expected to become more supportive.14
Overall, we are positive on the energy production outlook in the U.S., given the high resource prices and tightness in supply chains exacerbated by Russia’s invasion of Ukraine. Supporting this view is MLPs strong performance relative to broad equity markets this year. Also, as we can see in the chart below, MLP valuations are still low.
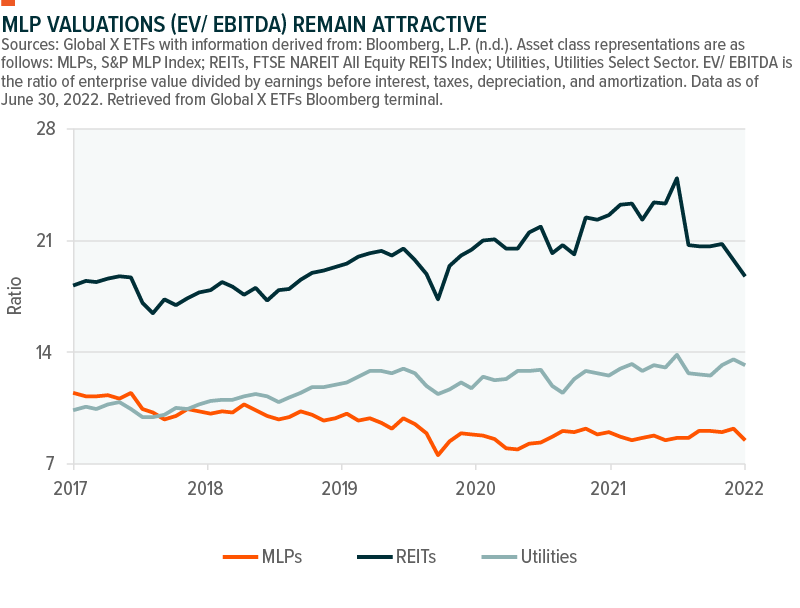
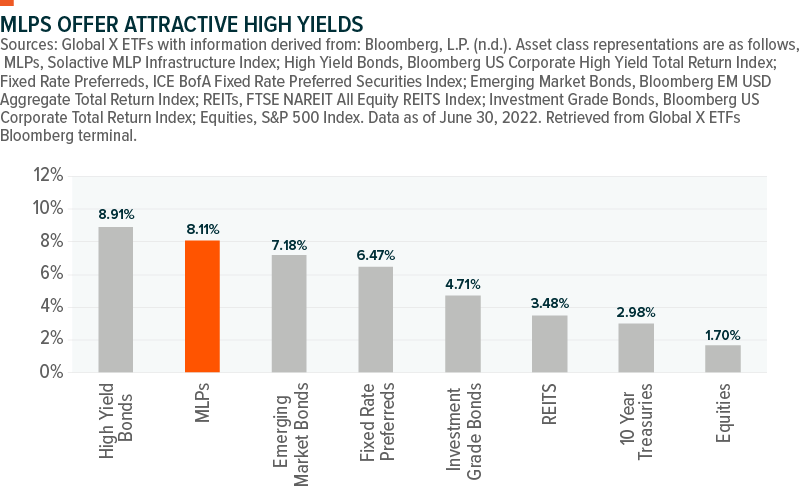
Midstream pipelines may be particularly well-situated with supply curtailed globally, as U.S. shale producers can be a main avenue to increasing supply. U.S. producers have been hesitant to raise production significantly thus far, but they are not a part of OPEC+ and prices remain high enough for most of them to profit from oil production. So, they could adjust the focus of their capital allocation policies from returning capital to shareholders to production growth. However, in our view, the dividend yields of MLPs are well supported by rising energy volumes and this should continue to support the high dividend yield MLPs offer.
Elevated Volatility Can Provide Opportunities
Rising volatility stemming from increasing rates is a challenge for equity and high yield fixed income investors because these assets have a high inverse correlation to the factor, essentially signaling a high inverse beta to volatility. The S&P 500 has a -0.71 correlation with the VIX index, while high yield bonds have a -0.40 correlation with the VIX index.15 Equity indexes fell in Q2, with much of the decline in broad equities stemming from multiple re-rating, with the S&P 500 forward P/E multiple falling from 20.0 to 16.6, which can be interpreted as investors moving away from riskier assets, while expectations are for S&P 500 earnings growth for Q2 to be 4.3%.16
Fixed income performance was also in line with this trend. In addition to rates rising, higher quality corporate credit spreads widened from 101bps to 144bps.17 This widening reflects the additional return investors would need to allocate to riskier bonds over safer bonds. In addition, this volatility also stemmed from rising rates and duration sensitive fixed income assets suffered from interest rate moves as well. So for fixed income investors, both spread widening and duration risk remains a challenge.
In Q2, the VIX, which measures S&P 500 volatility, and the VXN, which measures Nasdaq 100 volatility, averaged 27 and 34, respectively, notably higher than their five-year averages of 20 and 24.18 Volatility and equity markets tend to trade inversely, with volatility rising as equity markets fall. During periods of high implied volatility, meaning the volatility expected or priced in by markets, options-based strategies can be attractive for investors seeking income. In addition to income potential, options strategies can also reduce long volatility risk and adjust market beta exposure.
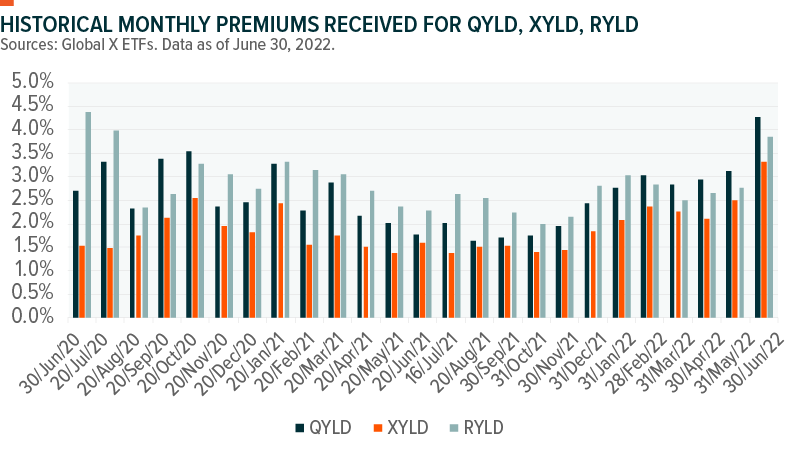
In the current environment, we are favorable on covered call strategies and risk-managed income strategies in particular. Covered call strategies work by buying the stocks in an index and selling call options on the index to generate income. We believe an at-the-money (ATM) covered call approach may be best suited for income-oriented investors, given the higher premiums generated relative to out-of-the-money (OTM) covered call strategies. Global X offers covered call strategy funds selling ATM calls on the Nasdaq 100 (QYLD), S&P 500 (XYLD), and the Russell 2000 (RYLD).
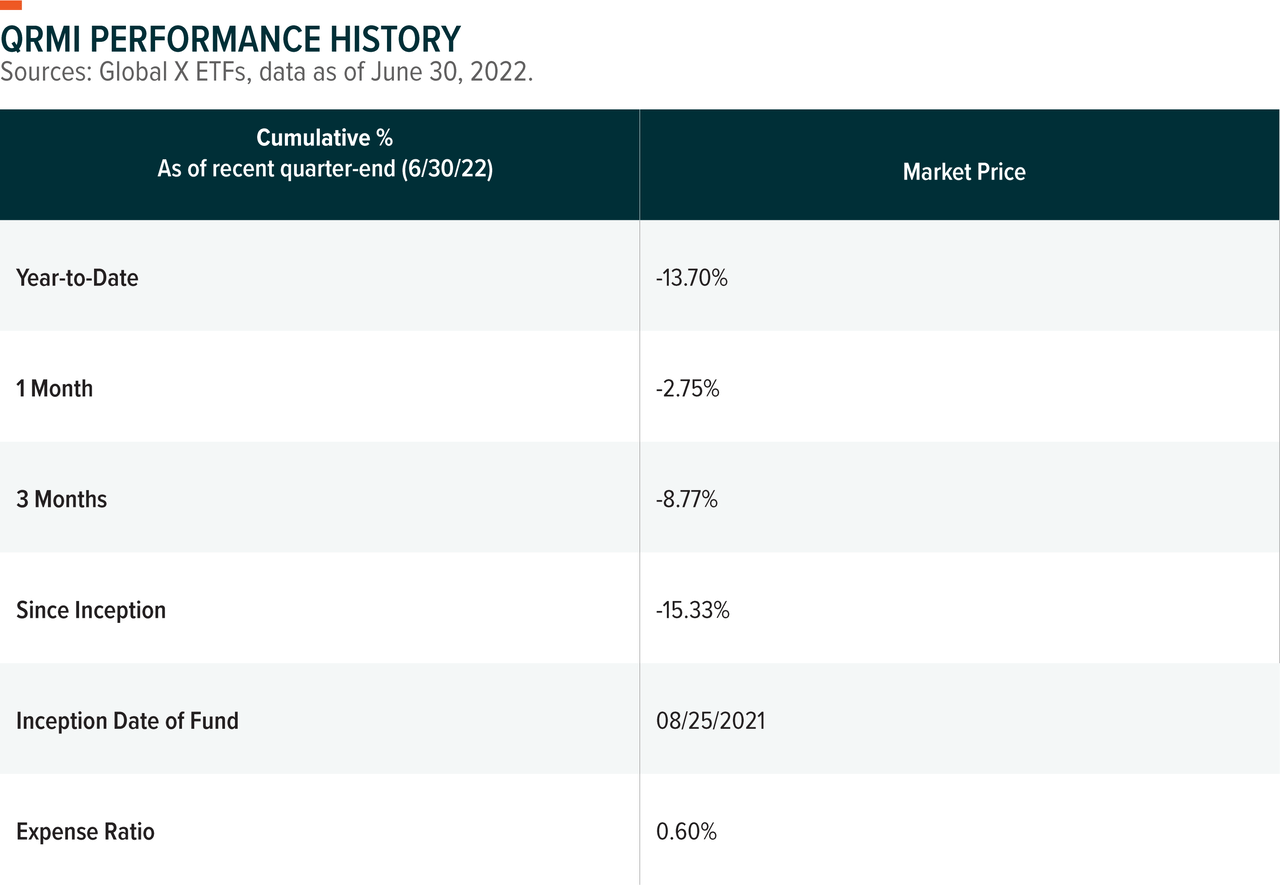
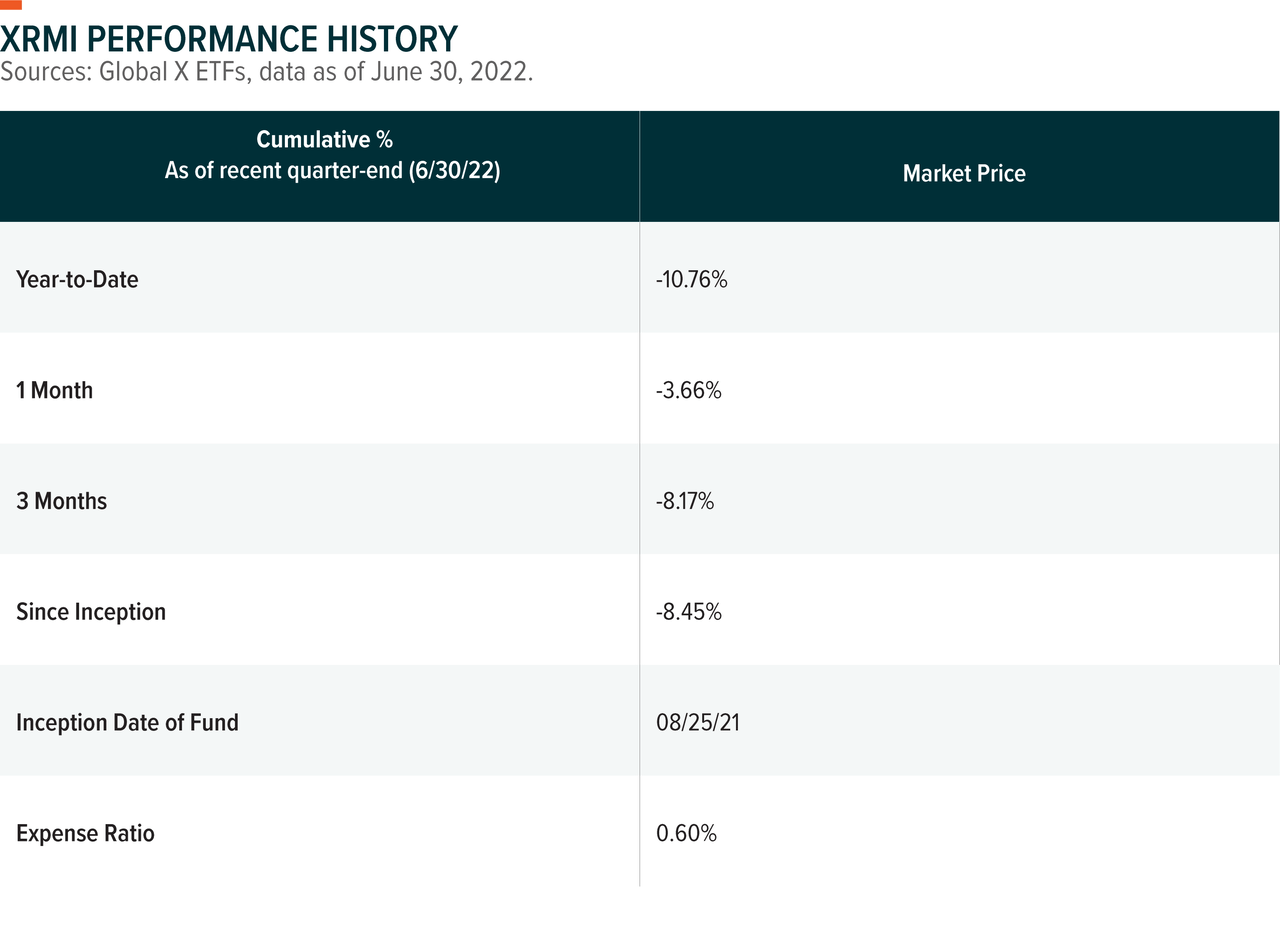
Risk-managed income (RMI) strategies are essentially covered call strategies overlaid with protective puts as well. RMI strategies buy the stocks in an index like the Nasdaq 100 or S&P 500, sell at-the-money (ATM) call options to generate income, and then also buy out-of-the-money (OTM) put options to provide a degree of downside risk mitigation. The premiums received from the call options are intended to exceed the premiums paid on the put options. These strategies can potentially outperform a traditional long broad equities strategy in a sideways or down trending market due to the higher levels of net premiums it receives from selling calls. This strategy is best suited for investors seeking higher income than provided for by typical equity dividends, or for investors who expect markets to trend sideways or modestly downward. Global X offers risk-managed income strategies covering the S&P 500 (XRMI) and Nasdaq 100 (QRMI). We can see below a comparison of both total return and volatility levels relative to their reference indexes since inception.
The performance data quoted represents past performance and does not guarantee future results. Investment return and principal value of an investment will fluctuate so that an investor’s shares, when sold or redeemed, may be worth more or less than their original cost. Current performance may be higher or lower than the performance quoted. For performance data current to the most recent month end, please call 1-888-493-8631, or visit www.globalxetfs.com.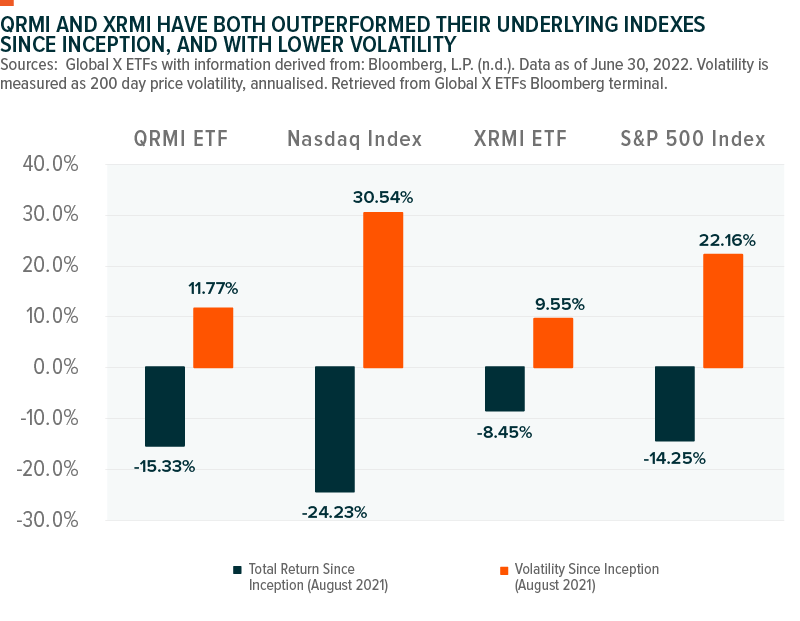
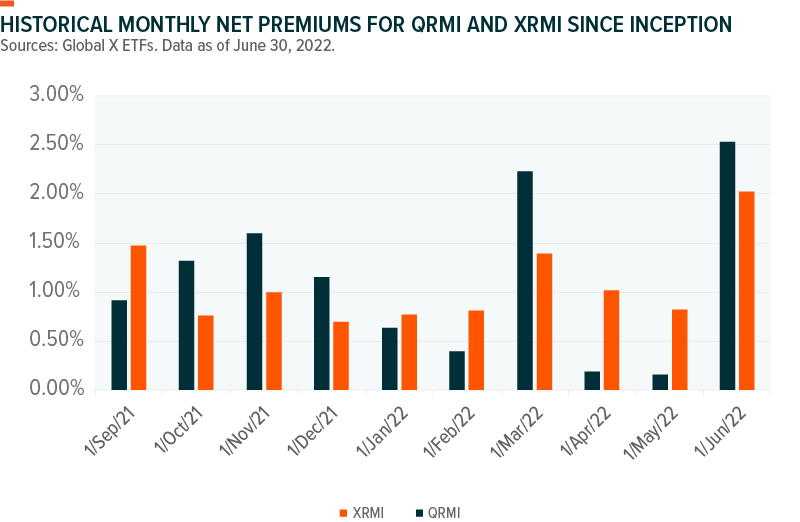
The higher volatility experienced by the NASDAQ and S&P 500 indexes has been supportive of the premiums earned by covered call and risk-managed income strategies. The higher volatility has similarly been beneficial to the net premiums (i.e., premiums received less premiums paid) earned by the risk-managed products, as shown below. We think risk-managed income strategies can also be potential effective income-oriented options for investors in this environment via the protective put overlay.
Conclusion
It’s understandable that many investors have looked to reduce their investment exposure in these market conditions, and traditional equities and bonds have underperformed as a result. We think investors looking for income can be more constructive with their portfolios and consider asset classes that could benefit from high inflation or high volatility for example. Shorter duration and higher-yielding preferreds now appear attractively valued. Energy and resources, and their related equities, have risen with inflation, and these companies are generally able to turn high energy prices and production volumes into returns for investors. Assets like MLPs are structured to provide strong cash flows, and many MLPs have share buyback programs in place. In addition, derivative strategies such as risk-managed income have delivered a materially higher yield than cash or broad equities’ dividends and are outperforming their traditional long equities counterparts year-to-date.
Footnotes
1. Cox, J. (2022, June 15). Fed hikes its benchmark interest rate by 0.75 percentage point, the biggest increase since 1994. CNBC. Fed hikes its benchmark interest rate by 0.75 percentage point, the biggest increase since 1994
2. Gordon, J., & Scherer, S. (2022, July 13). Bank of Canada surprises with 100bp rate hike to tame inflation. Reuters. Bank of Canada surprises with 100bp rate hike to tame inflation
3. Burns, D., & Saphir, A. (2022, April 13). Fed policymakers split on post-pandemic inflation landscape. Reuters. Fed policymakers split on post-pandemic inflation landscape
4. Bloomberg, L.P. (n.d.). [Market pricing implied by US Federal funds futures] [Data set]. Data as of July 14, 2022, and retrieved from Global X Bloomberg terminal.
5. Domm, P. (2022, July 5). Bonds flash recession warning light as key part of the yield curve inverts again. CNBC. Bonds flash recession warning light as key part of the yield curve inverts again
6. U.S. Department of the Treasury. (2022, February). Interest rate statistics. Interest Rate Statistics
7. Bloomberg, L.P. (n.d.). [Asset classes represented by: MLPs, S&P MLP total return index; S&P 500, S&P 500 total return index] [Data set]. Data as of June 30, 2022, and retrieved from Global X Bloomberg terminal.
8. Bloomberg, L.P. (n.d.) [Total OPEC Crude Oil Production based on surveys and subject to revisions] [Data set]. Data as of and retrieved on August 5, 2022 from Global X Bloomberg terminal.
9. Bloomberg, L.P. (n.d.). [Price per barrel. As measured by WTI generic first contract] [Data set]. Data as of June 30, 2022, and retrieved from Global X Bloomberg terminal.
10. Reuters. (2022, May 31). EU’s phased-in oil embargo allows Russia time to adjust, say analysts, sources. EU’s phased-in oil embargo allows Russia time to adjust, say analysts, sources
11. Aizhu, C., & Xu, M. (2022, July 6). China extends record imports of Russian oil into June, cuts Saudi supply – trade. Nasdaq. China extends record imports of Russian oil into June, cuts Saudi supply – trade
12. Tan, W., & Stevens, P. (2022, June 2). OPEC+ raises output faster than expected as Russia’s war roils global energy markets. CNBC. OPEC+ raises output faster than expected as Russia’s war roils global energy markets
13. Bloomberg News. (2022, April 22). China’s oil demand is tumbling the most since Wuhan lockdown.https://www.bloomberg.com/news/articles/2022-04-22/china-s-oil-demand-is-tumbling-the-most-since-wuhan-lockdown#xj4y7vzkg
14. The World Bank. (2022, June 8). China economic update – June 2022. China Economic Update – June 2022
15. Bloomberg, L.P. (n.d.) [Correlations measured as weekly correlation from June 30, 2017 to June 30, 2022, High yield bonds represented by Bloomberg US Corporate High Yield Total Return Index] [Data set]. Data as of June 30, 2022, and retrieved from Global X Bloomberg terminal.
16. Butters, J. (2022, July 8). S&P 500 likely to report earnings growth between 9% and 12% for Q2 2022. Factset. S&P 500 Likely to Report Earnings Growth Between 9% and 12% for Q2 2022
17. Bloomberg, L.P. (n.d.). [As measured by CSI a index (A rated corporate bond yield less 10 Year U.S. Treasury Yield)] [Data set]. Data as of June 30, 2022, and retrieved from Global X Bloomberg terminal.
18. Ibid.
Glossary
Consumer Price Index (CPI): CPI measures the average change in prices that consumers pay for a defined basket of goods and services.
Duration: A measure of a bond’s price sensitivity to changes in interest rates.
Credit Spreads: The difference in yield between a risky (i.e., non-government issued) security and a risk-free security.
S&P 500: S&P 500 Index tracks the performance of 500 leading U.S. stocks and captures approximately 80% coverage of available U.S. market capitalization. It is widely regarded as the best single gauge of large-cap U.S. equities.
VIX Index: The Chicago Board Options Exchange SPX Volatility Index commonly referred to as VIX, reflects a market estimate of future volatility of the S&P 500 index options, based on the weighted average of the implied volatilities.
Forward P/E Multiple: Represents the price of a share of a security divided by its per share expected earnings. It is used to determine whether a stock is cheap or expensive.
VXN: The Chicago Board Options Exchange NDX Volatility Index commonly referred to as VXN, reflects a market estimate of future volatility of the Nasdaq 100 index options, based on the weighted average of the implied volatilities.
Beta: Beta is a quantitative measure of volatility, also known as systematic risk, of a security or securities versus the market as a whole.
At-the-Money (ATM): Options that have a strike price equal to the value of the underlying.
Out-of-the-Money (OTM): Options that, if exercised, would require the payment of more money than the value received and therefore would not be currently exercised.
NASDAQ: The Nasdaq-100 Index includes 100 of the largest domestic and international non-financial companies listed on The Nasdaq Stock Market based on market capitalization. The Index reflects companies across major industry groups including computer hardware and software, telecommunications, retail/wholesale trade and biotechnology. It does not contain securities of financial companies including investment companies.
Index returns are for illustrative purposes only and do not represent actual fund performance. Index performance returns do not reflect any management fees, transaction costs or expenses. Indices are unmanaged and one cannot invest directly in an index. Past performance does not guarantee future results.
Shares of ETFs are bought and sold at market price (not NAV) and are not individually redeemed from the Fund. Brokerage commissions will reduce returns.
Investing involves risk, including possible loss of principal. International investments may involve risk of capital loss from unfavorable fluctuation in currency values, from differences in generally accepted accounting principles, or from economic or political instability in other nations. Emerging markets involve heightened risks related to the same factors as well as increased volatility and lower trading volume. Bonds will decrease in value as interest rates rise. High yield bonds involve greater risks of default or downgrade and are more volatile than investment grade securities, due to the speculative nature of their investments.
Real estate is highly sensitive to general and local economic conditions and developments, and characterized by intense competition and periodic overbuilding. Many real estate companies, including REITs, utilize leverage (and some may be highly leveraged), which increases risk and could adversely affect a real estate company’s operations and market value in periods of rising interest rates.
Investments in securities of MLPs involve risk that differ from investments in common stock including risks related to limited control and limited rights to vote on matters affecting the MLP. MLP common units and other equity securities can be affected by macro-economic and other factors affecting the stock market in general, expectations of interest rates, investor sentiment towards MLPs or the energy sector, changes in a particular issuer’s financial condition, or unfavorable or unanticipated poor performance of a particular issuer (in the case of MLPs, generally measured in terms of distributable cash flow).
MLPA has a different and more complex tax structure than traditional ETFs and investors should consider carefully the significant tax implications of an investment in the Fund. MLPA is taxed as a regular corporation for federal income tax purposes, which differs from most investment companies. Due to its investment in MLPs, the Fund will be obligated to pay applicable federal and state corporate income taxes on its taxable income, as opposed to most other investment companies. The Fund expects that a portion of the distributions it receives from MLPs may be treated as tax-deferred return of capital. The amount of taxes currently paid by the Fund will vary depending on the amount of income and gains derived from MLP interests and such taxes will reduce an investor’s return. The Fund will accrue deferred income taxes for any future tax liability associated certain MLP interests. Upon the sale of an MLP security, the Fund may be liable for previously deferred taxes which may increase expenses and lower the Fund’s NAV.
The potential tax benefits from investing in MLPs depend on them being treated as partnerships for federal income tax purposes. If the MLP is deemed to be a corporation then its income would be subject to federal taxation at the entity level, reducing the amount of cash available for distribution to the Fund which could result in a reduction of the Fund’s value.
Preferred stock is subject to many of the risks associated with debt securities, including interest rate risk. In addition, preferred stock may not pay a dividend, an issuer may suspend payment of dividends on preferred stock at any time, and in certain situations an issuer may call or redeem its preferred stock or convert it to common stock. High yielding stocks are often speculative, high-risk investments. These companies can be paying out more than they can support and may reduce their dividends or stop paying dividends at any time, which could have a material adverse effect on the stock price of these companies.
Variable and Floating Rate Securities may have limits on the maximum increases in coupon rates and may lag behind changes in market rates. A downward adjustment in coupon rates may decrease the Fund’s income as a result of its investment in variable or floating rate securities. Performance of companies in the Financials sector may be adversely impacted by many factors, including, among others, government regulations, economic conditions, credit rating downgrades, changes in interest rates, and decreased liquidity in credit markets.
An option is a contract sold by one party to another that gives the buyer the right, but not the obligation, to buy (call) or sell (put) a stock at an agreed upon price within a certain period or on a specific date. A covered call option involves holding a long position in a particular asset and writing a call option on that same asset with the goal of realizing additional income from the option premium. By selling covered call options, the investor limits their opportunity to profit from an increase in the price of the underlying asset above the exercise price, but continue to bear the risk of a decline in the underlying asset. By purchasing put options, in return for the payment of premiums, the investor may be protected from a significant decline in the price of the underlying asset if the put options become in the money (the underlying asset closes below the strike price as of the expiration date); but during periods where the underlying asset appreciates, the investor will underperform due to the cost of the premiums paid. While the seller receives a premium for writing the call options, the price it realizes from the exercise of the option could be substantially below the investment’s current market price. These strategies may not be appropriate for all investors.
This material is not intended as investment advice. There is no guarantee that strategies discussed will be successful. Please consult your financial advisor for further information.
Carefully consider the funds’ investment objectives, risks, and charges and expenses before investing. This and other information can be found in the fund’s full or summary prospectus, which may be obtained at globalxetfs.com. Please read the prospectus carefully before investing.
Global X Management Company LLC serves as an advisor to Global X Funds. The Funds are distributed by SEI Investments Distribution Co. (SIDCO), which is not affiliated with Global X Management Company LLC. Global X Funds are not sponsored, endorsed, issued, sold or promoted by Solactive AG, FTSE, Standard & Poor’s, NASDAQ, Indxx, or MSCI nor do these companies make any representations regarding the advisability of investing in the Global X Funds. Neither SIDCO nor Global X is affiliated with Solactive AG, FTSE, Standard & Poor’s, NASDAQ, Indxx, or MSCI.
Editor’s Note: The summary bullets for this article were chosen by Seeking Alpha editors.
Be the first to comment