


Andres Victorero
Ethereum (ETH-USD), for the uninitiated, is the second-most important of the crypto currencies, Second only to Bitcoin (BTC-USD) by market value and role, Ethereum is the main currency dominating the $100 billion industry of Decentralized Finance (see CoinDesk).
Before I launch into my technical analysis, the reader may want to know my biases: I confess I’m one of the Kool-Aid drinkers who believe that cryptos will be at the foundation of our economic system a decade or so from now.
I believe that Bitcoin will function as the future hard-currency savings instrument (similar to Gold until now), while ETH will largely play the role the dollar does today. It will be the preferred currency for international transactions.
Over the next decade, I have not doubt that both Bitcoin and Ethereum will flourish and be worth 20 to 50 times their current prices.
So I guess you could call me a crypto bull or – less generously – a crypto fool.
Despite that, I exited all but a small portion of my crypto holdings last January. I thought the Fed’s changing stance on inflation would cause a market rout where all assets would drop. Crypto assets, having been priced in a market of real negative interest rates, would be hit the hardest.
I was a bit late, but I avoided most of the ensuing plunge.
I know that soon enough, the Fed is likely to stop tightening. It is more a matter of months, than years, I believe. At some point it will start reinflating again.
When that happens, I’m convinced that fundamental factors will propel both ETH and BTC to heretofore unattained highs. My reasoning is beyond the scope of this article, but the gist is that we’re witnessing the last throes of a dying global monetary system that has proved its inadequacy. This is becoming more and more obvious to more and more people around the world.
I want to be ready for that reinflation. But when is the right moment?
So now I’ll pull out my crystal ball and astrological charts. Well at least the financial versions of those. I mean of course technical analysis. Let’s see what the crypto future holds.
When I started my professional career in finance, I thought logic would rule. management studies, product and service comparisons, spreadsheets, cash flows and the like. I quickly – and rather painfully for my earnings – discovered that mass psychology was more important in the near and mid-term.
In a nutshell, technical analysis is taking the pulse of mass investor psychology. It is assessing the degree of madness of crowds: the fear and greed that move us to buy and sell assets.
Wait, you might say. Do resistance levels, Fibonacci measurements, RSI – price divergences, etc. really work? Aren’t we just drawing random lines on a chart in the hope of discovering some obscure relationships that just are not there?
My conclusion after more than 14 years of trial and error: technical analysis works the majority of the time. It’s difficult to do right, and easy to misinterpret. But with all that said, technical analysis can give you a valuable edge. I put that edge at about 70%. That ain’t so bad.
Let’s take Fibonacci levels, for example. Why should they even work? Is it because our senses succumb to an innate sense of proportionality? Is it really because “on the molecular level, the nucleotide spirals of human DNA have Fibonacci proportions”? (source: Fibonacci in Humans)
Hmm. Until I measure the angstroms of human DNA under a microscope for myself (probably not happening any time soon) , I’ll reserve judgement. Meanwhile though, them darn Fibonacci levels sure have an uncanny way of hitting the mark time and again with surprising accuracy. And of course, some times they just don’t.
My theory on Fibonacci measurements: the relation of investing to biology is probably hogwash. But so many stock pickers think Fibonacci levels should work and so they start their buying and selling based on those magical proportions. So Fibonaccis are kind of like a set of admittedly bogus rules that most investors choose to follow. So they become self-fulfilling. It’s good to know where the crowd is going.
Ok, having gotten that out of the way, let me plunge into Ethereum’s longer term chart.
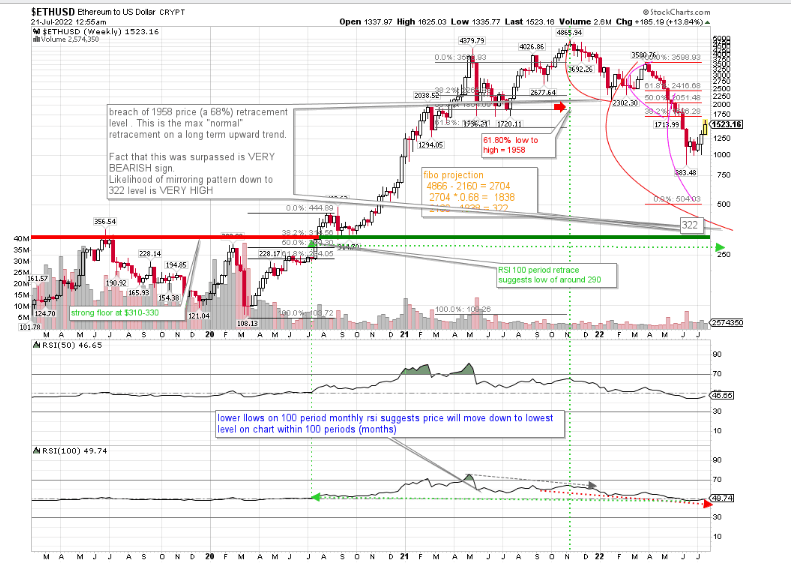
The chart above allows you to see on one chart the price action and a 50- and 100-week RSI indicator. (More on this below). The second chart is a zoomed version of the first, but only includes the price action. This makes it easier to read and follow along.
ETH full sized technical weekly candle chart (stockcharts.com)
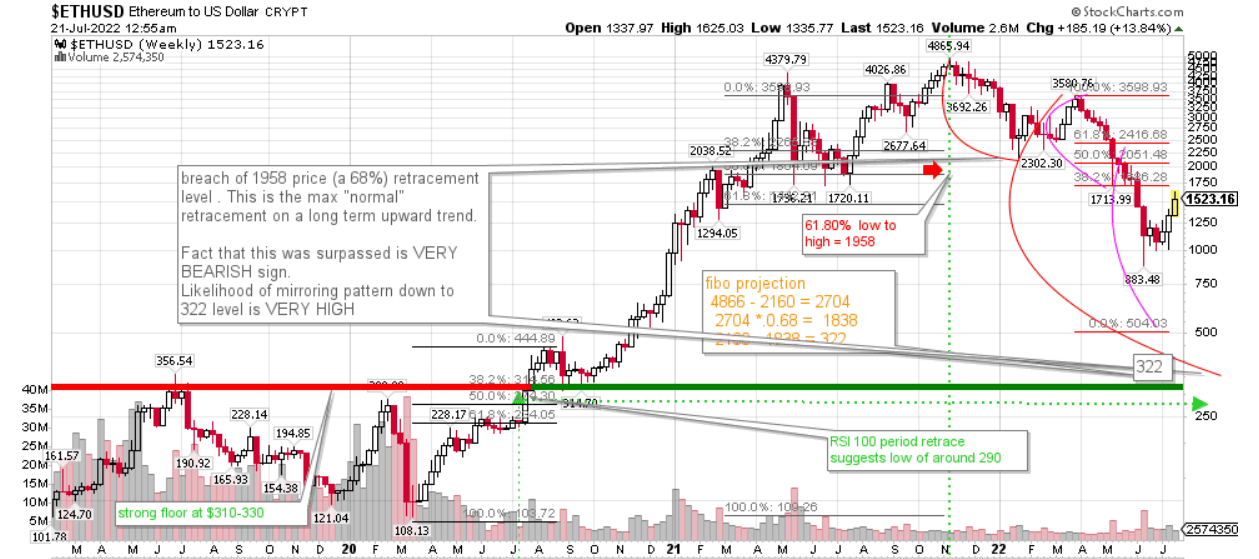
ETH price only weekly candles (stockcharts.com)
Take a look at the RSI chart with the 100 period moving average. Please note that if you trace the RSI highs from March to Nov of 2021, you get a downward sloping line (grey dotted arrow line). During the same period, the price highs was making higher highs. This is known as bearish divergence. It is very often a sign of a reversal from an upward trend to a downward trend.
So by late May, when ETH made a lower high, it was clear that the slope of the 100 period RSI was negative, and a new negative trend was starting.
At this point, with ETH trading at $2230, you could look for the lowest price reached between March 21 and May 22 and conclude that the price would drop to at least that low, namely $1720. This conclusion is not taught in many RSI discussions, but is my own learning from heavy use of this indicator over many years.
But by the time it got down to $1720 on May 16 2022, the RSI100 level traced over to an even lower point on the time scale, namely that of July 2020. At that point ETH was at a price of around $300.
This suggests that the RSI “wants” the price to revisit that level. Let’s call that clue #1. (Note if you ever attempt RSI tracing, you must make sure the period you trace back to does not exceed the calendar comparison validity: e.g. a 14 period RSI only can be compared to prices 14 weeks back, and so on.)
This RSI tracing level is interesting, but not enough to go on, so I look for confirmation in other patterns.
Look at the price lows made by both price and RSI (dotted red line). We’re still getting lower lows and lower highs. As price is making lower lows, so is the RSI tracing lower lows. It is in a convergent downtrend. Call that clue #2.
Now look at the two red elliptical curves drawn representing two possible bearish price waves, one already having occurred, the other one drawn using a Fibonacci-based mirroring of the first. (My ellipses only trace the extremes, not the curling of the wave regression.)
The first red wave down was formed when the price dropped from $4866 to $2160, then back up to $3311.
When this wave was breached to the downside (9th May 22) on better than average volume, this was critical. It meant there was a greater than 90% chance that a second downward wave would ensue, proportional to the first.
That’s a low of $322. Let’s call that clue #3.
If you want to know where I get that 90% stat, read the italicized section, otherwise skip this explanation.
Take a look at the following chart, which is an idealized version of how Fibonacci waves are supposed to evolve.
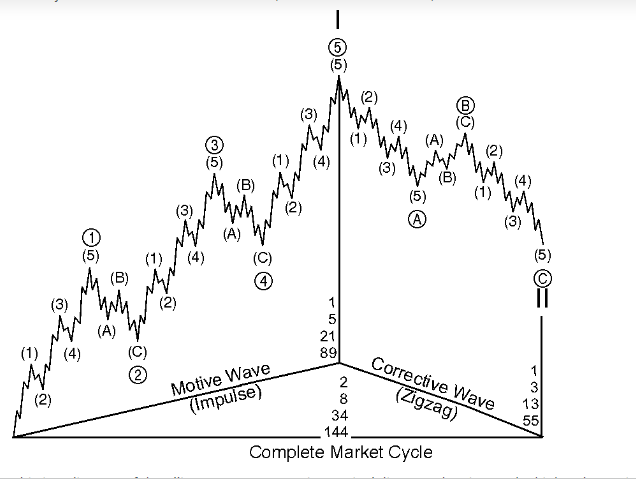
Idealized Fibonacci Wave Cycle (Elliotwave Plus)
Note that wave 3’s are always a 68% projection of distance from origin to wave 1, and wave C’s are always a 68% projection of distance from start of wave to wave A low, projected down.
So even if you’ve misinterpreted the direction of the dominant trend (whether up or down), since you’ve just breached the first defined wave from the last base, you know you’re in the either in a wave C of an otherwise bullish uptrend or in a wave 3 of a bearish downtrend that will have a wave 4 and a wave 5. Either way, you can count on that 68% projection further in the direction of the wave that was just breached.
If your interpretations of the charts was always accurate, you’d be able to count with a 100% success rate – according to Fibonacci theory anyways.
But either Fibonacci theory is a decent but imprecise way of measuring equity movements or my charting skills are deficient. In viewing hundreds of thousand of charts over the last 14 years, I’ve only succeed with these projections (on first wave breaches mind you) around 90% of the time. About 10% of the projected wave stop short of that 68%.
In the orange box on the chart, you’ll see the math behind the $322 calculation. Remember, according to Fibonacci theory, this is the minimum low, not the maximum low. The price could go even lower than $322.
Another chartist might look at volume and pivot points and suggests the drop could stop at $662 or $460 levels. I think those two will be bounce points, temporary floors, but the downtrend will then continue, until we get my Fibo projection of $322. That would then satisfy the mirroring pattern.
So if ETH does drop to $322, could it not go even lower? Maybe to the RSI tracing level mentioned in clue #1 of $300? Yes that could easily happen.
Note the pivot points formed on large volume in June-July 2019 and Feb 2020 highs and Sep-Oct 2021 lows. These form a broad resistance floor that is likely to halt any further drops. Call that clue #4.
Many people have called the crypto run a bubble. I would agree. The mania surrounding all things crypto in the last two years had many bubblish aspects. Well, the vast majorities of bubbles return to the base point from which they first erupted.
In the case of ETH, that would be to the base price of $129, reached in March of 2020. That would be a 100% drop of value since that period.
Is that possible? Of course, anything is possible. But is it likely? I don’t think so. But if ETH gets down to my expected low of $322, I’ll take another look. The chart will have evolved by then, and it may then suggest even lower lows.
So in conclusion, my technical analysis suggests that ETH must drop from its present levels of $1522, to a level of $322. That’s a portfolio-crushing 80%. And that prognosis comes from a die-hard believer in the future of crypto.
Don’t shoot the messenger.
Be the first to comment