

Khanchit Khirisutchalual/iStock via Getty Images
The S&P 500 endured its worst first half since 1970. Maybe you heard about it. On a total return basis, the -20.6% drubbing was actually the biggest drop since H1 of 1962 when it fell 26.5%. Digging into the poorest sectors, you will find Communication Services (XLC) and Consumer Discretionary (XLY) which were both down about 30% through last Friday. Between those two dreadful figures is the technology software industry fund, down 31.1% thus far in 2022.
2022 Sector Returns: IGV Among the Biggest Losers
Koyfin Charts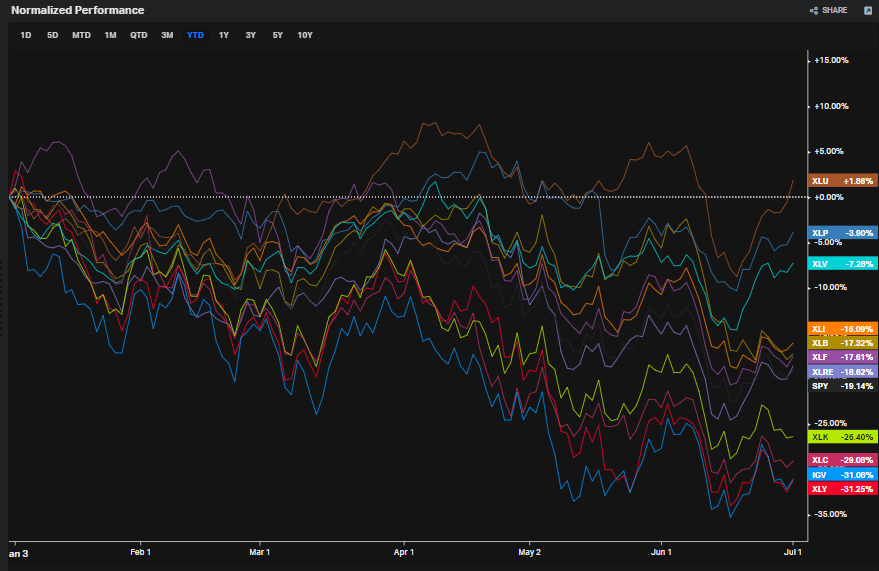
The iShares Expanded Tech-Software Sector ETF (BATS:IGV) seeks to track the investment results of an index composed of North American equities in the software industry and stocks from interactive home entertainment and media and services industries, according to iShares. With more than $4 billion in net assets and an expense ratio of 43 basis points, it’s a popular trading vehicle to play the volatile software niche.
IGV is currently in a massive drawdown off its November 2021 all-time high, but shares have found some support near the pre-pandemic peak and pullback lows from 2Q 2020. At a decline of 39%, this is far bigger of a bear market versus dips seen from 2011 through 2020.
IGV Historical Drawdowns: Biggest Since the GFC
Koyfin Charts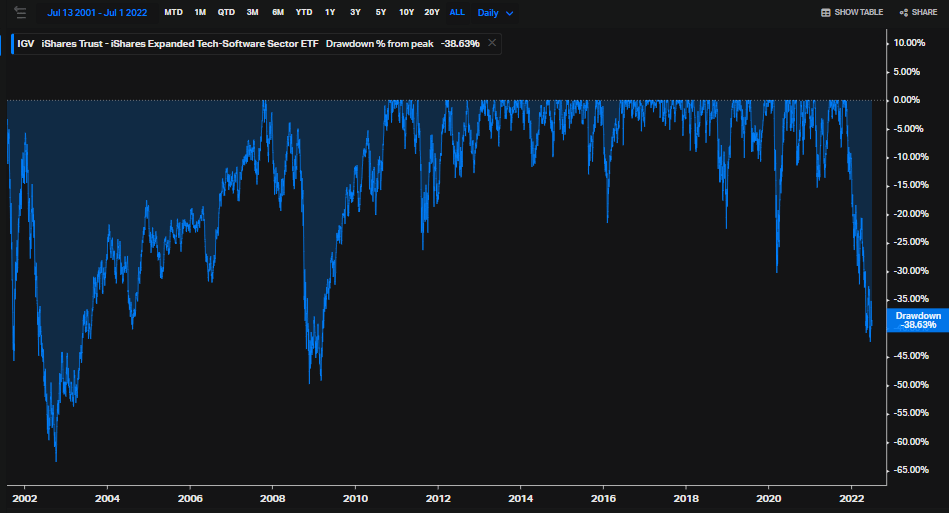
IGV is heavily weighted in a handful of big-name tech stocks. Microsoft (MSFT), Salesforce (CRM), and Adobe (ADBE) each represent about 8% of the fund’s portfolio. These companies feature relatively high price-to-earnings ratios, but with decent growth, their PEG ratios suggest reasonable valuation given the significant share price drops this year.
S&P 500 PEG Ratio Heat Map: Some Cheap Shares in Tech
Finviz.com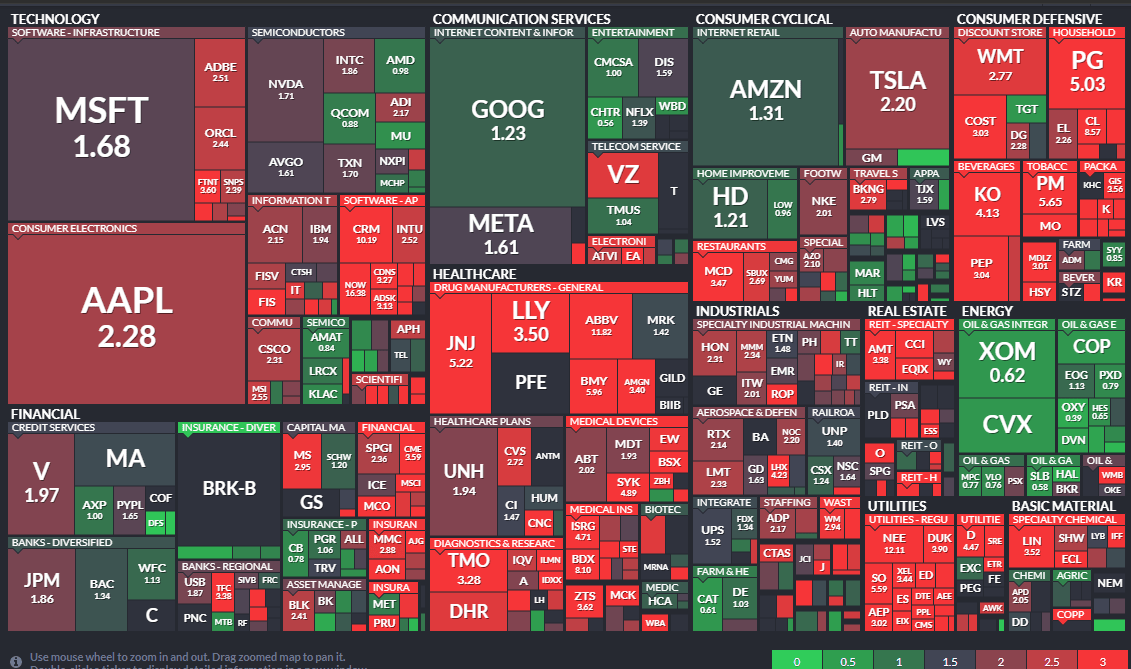
What will be particularly interesting to watch in the coming weeks is what happens during earnings season. Tech companies start reporting during the week of July 25, according to the corporate event calendar from Wall Street Horizon. That’s also when the next Fed decision arrives, so expect volatility to kick up as the month progresses.
Tech Earnings Begin During the Final Week of July
Wall Street Horizon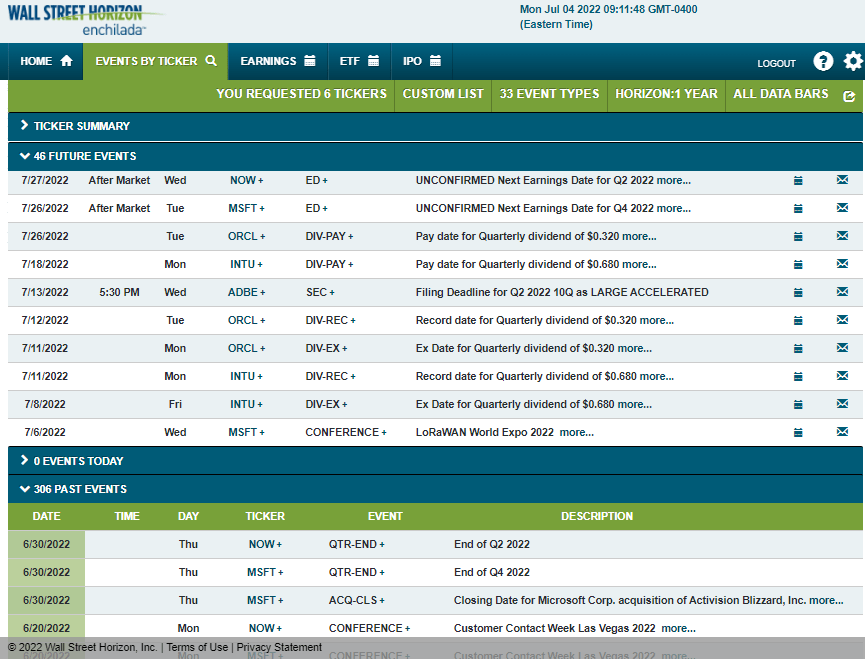
The Technical Take
Turning to the charts, IGV is near key long-term trend support. I prefer to analyze the rate of trend over prolonged periods with log-scale charts. From the GFC lows to the 2016 correction low and then through today, an uptrend support line is in play. A move below that line could lead to significant further losses.
Long-Term Support Line In-Play
StockCharts.com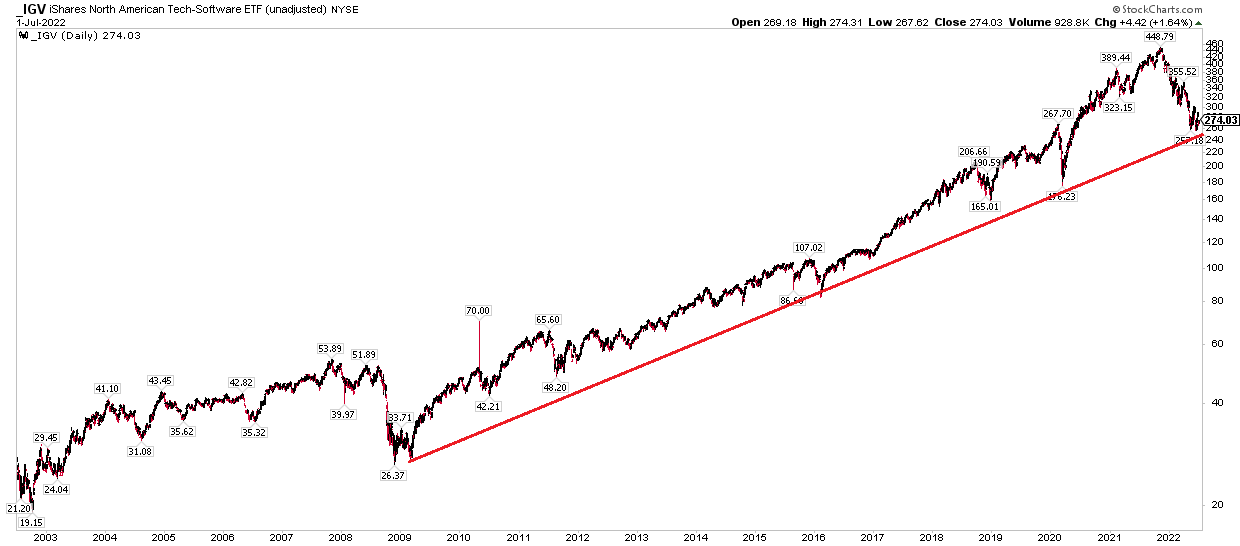
The near-term look yields more precise levels to watch. Traders can take a shot long here with a stop below the May and June lows in the mid-$250s. I don’t often show volume-by-price, but I think it is appropriate here. Notice the high volume of shares traded in the $335 to $365 range. A rally might pause when that zone is hit due to a supply of shares looking to sell at the psychologically important breakeven level. $300 to $305 might be tough slogging too.
IGV: Resistance Near $305 and Where Volume-by-Price Spikes
StockCharts.com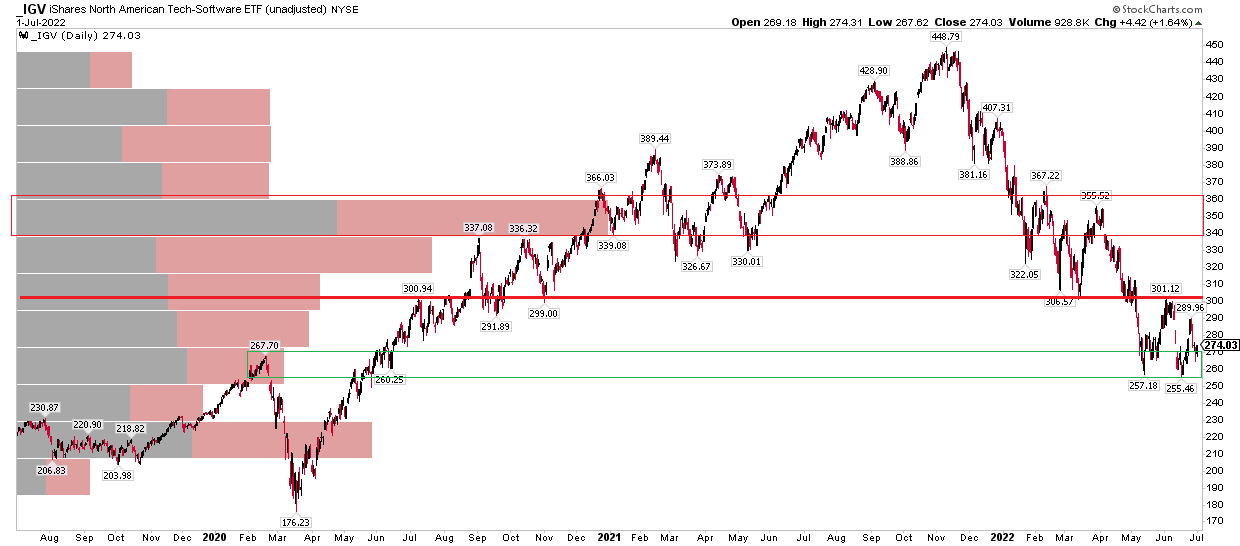
The Bottom Line
While in a big downtrend, the tech software ETF sets up for a bounce here, but profits should be taken first on an approach of $300, but more aggressive traders might look to the $335-$365 area for resistance. A stop below the May-June lows is prudent to cut losses.
Be the first to comment