


Solskin/DigitalVision via Getty Images
Investment Summary
After an extensive review of the ICON Plc (NASDAQ:ICLR) investment debate, I’ve retained our neutral stance on the name. There’s conflicting information to suggest if its latest rally is extendable beyond previous highs. Fundamentals look to be weakening in key areas, despite growth on face value in others. The stock trades at 39x forward earnings, above historical 26x, and has pushed off recent lows in unison with the SPX. However, this is a high-beta stock and the latest gains could also just be beta related as well with index inclusion, as seen in Exhibit 1.
In my previous analysis on ICLR I noted several points. Findings included:
- ICLR is a long-term cash compounder that averages triple-digit FCF conversion on a sequential basis.
- It has also consistently generated a positive return on capital in the years to date.
- Second quarter earnings came in strong with gross business wins of $2.76 billion.
- ICLR has continued to generate substantial return on invested capital over the period from FY16 to date.
Despite this, predictability of the company’s cash flows looking ahead has diminished, and cash earnings have tightened substantially YoY. Net-net, I retain the hold rating on ICLR.
Exhibit 1. Bounced from pandemic-level lows. Question is if latest rally is sustainable and backed by robust fundamental data.
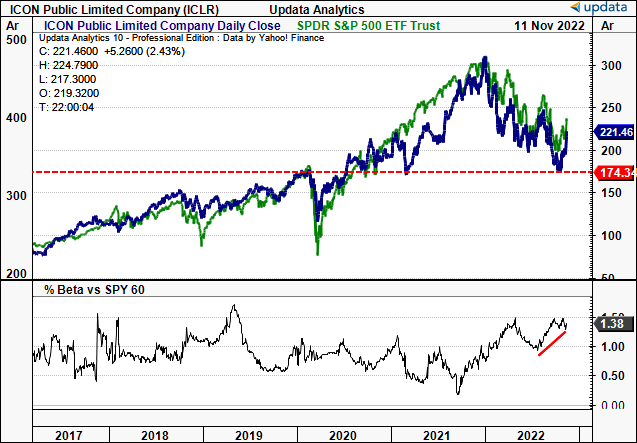
Data: Updata.
ICLR Quarterly growth trends back to range
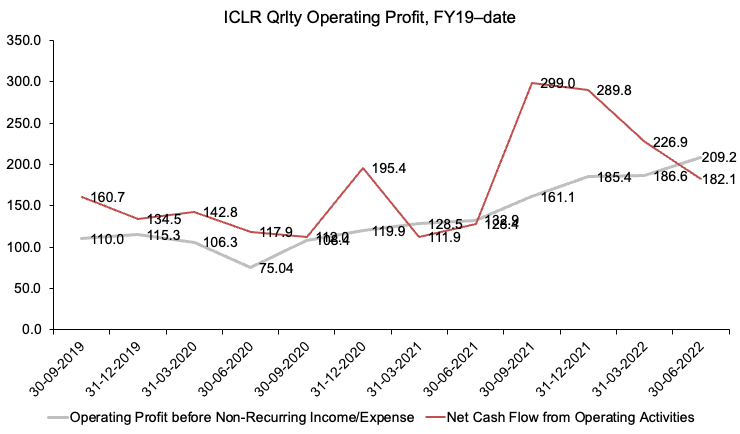
From my observations, ICLR continues to incrementally grow operating profit from FY19–date, clipping $209mm quarterly operating profit in Q3. This stemmed from quarterly revenue of $1.94Bn last period. It also achieved $2.74Bn in business wins for the quarter, with ~14% or $389mm of cancellations.
In Q2 FY22, cancellations were 16% or $441mm. Net awards were therefore $2.35Bn, up from $2.2Bn last quarter. From these numbers ICLR’s book-to-bill ratio for the quarter was $1.24Bn, down from $1.25Bn on a sequential basis. ICLR also saw 110bps of gross margin leverage to 29.5%, helping push Q3 operating margin to 10.77% of turnover.
Exhibit 2. Operating profit crawls higher whilst CFFO pulls back to range. Degree of cash backing valuation far narrower.
Data: HB Insights, ICLR SEC Filings
Despite this, quarterly CFFO has pulled back to long-term range, as seen in Exhibit 2. Growth in net cash flow is a notable headwind the company has faced these past 12 months, which I estimate has pulled through substantially to valuations.
To illustrate, as seen in Exhibit 3, The ICLR share price has appreciated 84% from 11/13/2017–11/13/2022, whereas its trailing P/E has expanded 79.2%. Meanwhile, ICLR’s CFFO has compressed 39% YoY to $182mm, with P/E multiples compressing heavily off FY22 highs. As such, the degree of cash flow backing ICLR’s valuation has narrowed substantially. Unsurprisingly, it has re-rated heavily to the downside these past 3 quarters. It now trades at 39x TTM earnings, still above its 5-year median of 26.3x.
Exhibit 3. Degree of cash flow backing valuation now tighter with 39% YoY decrease in CFFO, now at 1.6x net income.
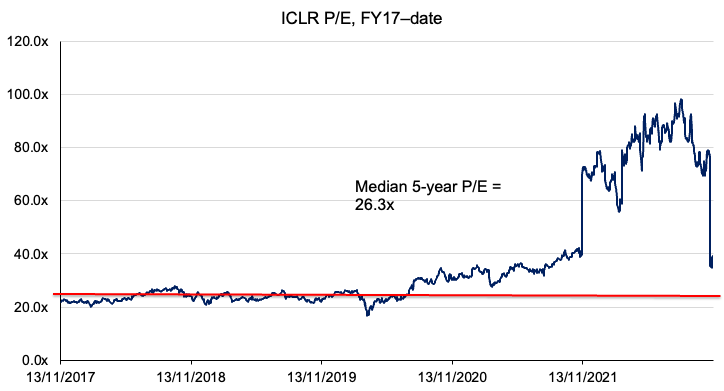
Note: Daily P/E from TTM earnings in respective period. Median P/E calculated over testing period as daily P/E. (Data: Refinitiv Eikon, HB Insights)
It’s not just ICLR’s stock valuation I’ve seen pullback in FY22. Looking at Exhibit 4, the marriage between FCF and return on invested capital (“ROIC”) has broken down in the latest 2–3 years. Prior to Q2 FY20, ICLR was seeing TTM return of ~20–21% per quarter from its investments. This occurred whilst FCF continued in a cyclical uptrend. Most importantly, in times where FCF contracted/was an outflow, ROIC held the line, indicating capital was invested wisely.
Turn to Q2 FY20, and the relationship began to breakdown. In particular, ICLR continues to grow FCF sequentially, however ROIC has counter-balanced this to the downside. Ideally, we’d see FCF and ROIC lifting together, not bifurcating away. This tells me of potential inefficiencies in ICLR’s capital budgeting cycle. The ROIC/WACC ratio for ICLR sits at a negative spread of 2.3 percentage points, compared to a 16.4-point positive spread in Q1 FY20.
With a rising cost of capital, economic value added [return above the cost of capital] is becoming increasingly difficult to achieve for ICLR. What was once a strong point for the company is now less so in my opinion. This data isn’t conducive to the forward economic climate and presents as a large headwind in the risk/reward symmetry.
Exhibit 4. ROIC reversing to the downside whilst FCF pushes north indicates potential inefficiency in capital budgeting cycle.
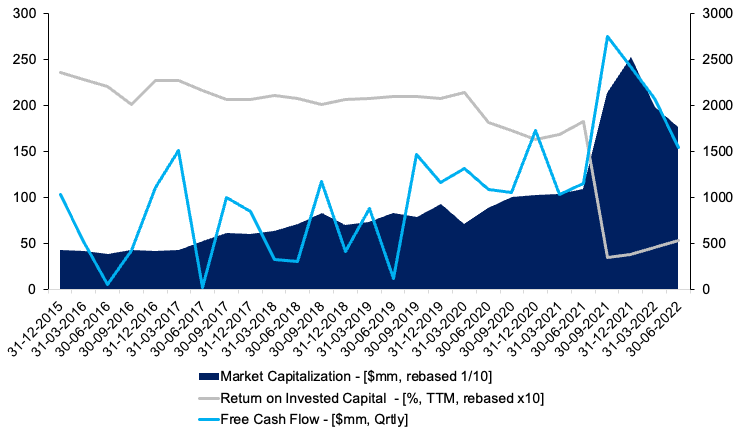
Note: Market cap and ROIC rebased by factor of 10 to demonstrate directional relationship. (Data: HB Insights, Refinitiv Datastream)
Forward EPS upside therefore looks contained until FY23/FY24. With a downturn in global economic activity more imminent, probabilities are this could hit ICLR with tighter growth rates.
From 2024 we see a lift in forecasted ICLR’s operating margins amid a return to long-term economic growth, by estimation. ICLR is therefore well placed at that time to demonstrate superior growth on the chart.
However, until then, the market will overlook ICLR in my estimation with lackluster non-GAAP EPS upside. This supports a neutral view by my estimation.
Exhibit 5. ICLR Forward earnings estimates.
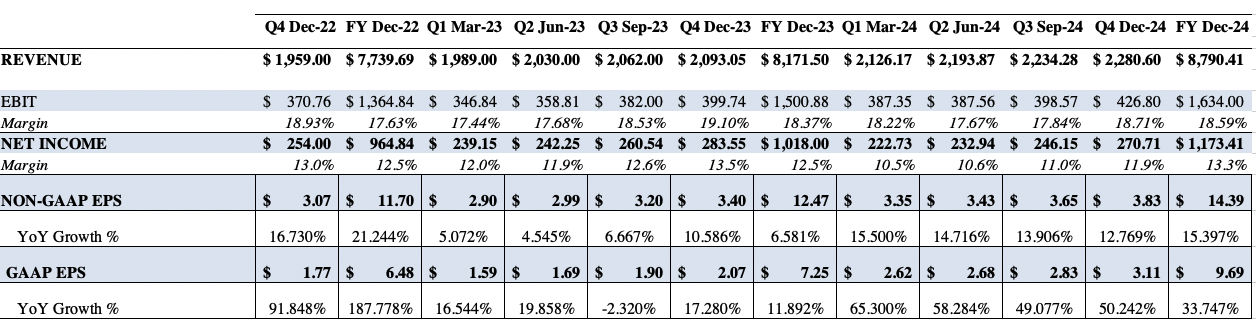
Data: HB Insights
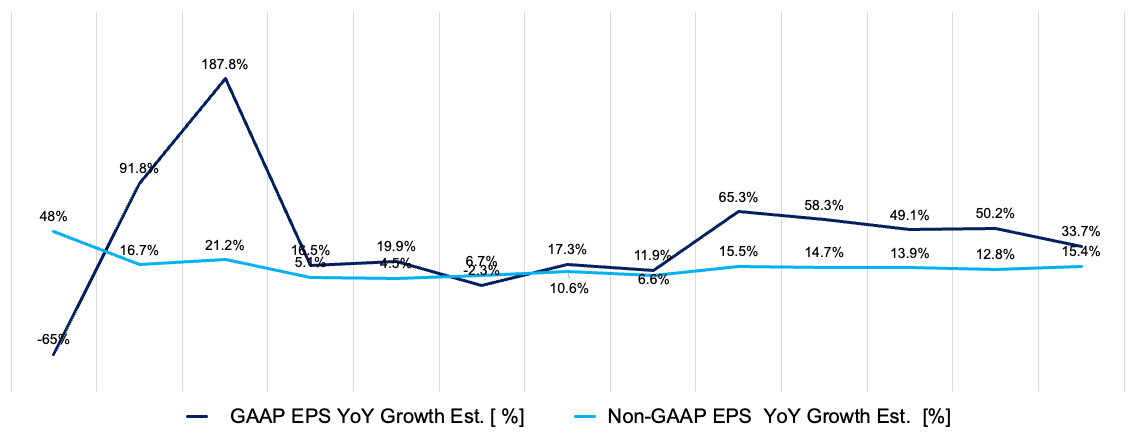
Data: HB Insights
Market data unsupportive of turnaround
Considering the current state of markets, I’m using technicals as additional market data for the company. Findings are in support of previously discussed items.
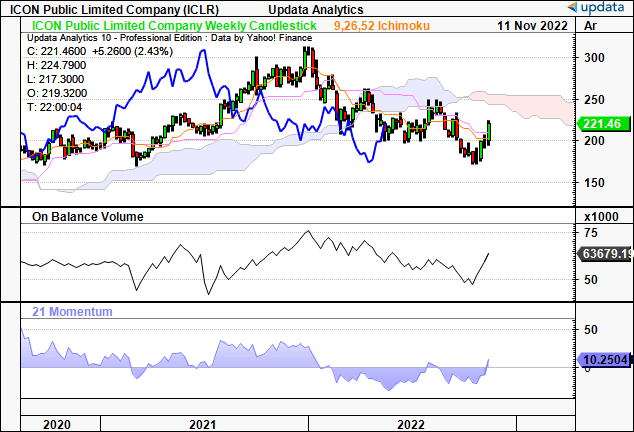
As seen in Exhibit 6, ICLR has traded down in a 45-week downtrend that begun the first session of FY22. Despite several attempts to recover and re-stabilize, volume continued to dry-up until we rolled into October. Each sideways consolidation with declining volume, whilst testing the 50DMA, is evidence of heavy resistance in my opinion.
Moreover, as the SPX has rallied off its double bottom in October, ICLR followed in pursuit, seen in the bottom right of the frame. ICLR now tests the outer resistance line shown in the chart below and has closed above the 50DMA the last 3/3 weeks.
We’ve now got shares back above the 50DMA, and we’ve got the company to grow non-GAAP EPS by 16.7% in Q4 FY22. Should it break through this mark there’s good evidence when tracing the fibs down from each successive high [FY21-date] for price targets at $231, $247 then $260.
However, I’m not so confident. The trend in relative strength vs. the benchmark remains in situ, seen in the bottom frame. This evidences continued counter-weakness to the benchmark.
Exhibit 6. Testing outer resistance line of long-term downtrend, closed above 50DMA last 3 weeks.
- Volume accumulation noted over the last 4 weeks.
- Need more evidence to imply a breakout.
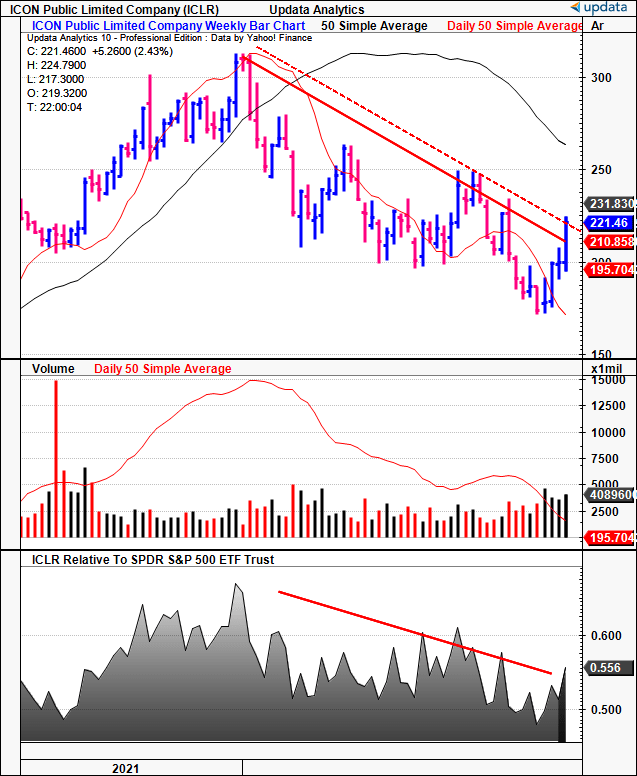
Data: Updata
Moreover, as seen in Exhibit 7, tracing the Fibonacci channel towards the previous high indicates downside targets to $210 and $195. Question is, what’s the likely direction looking ahead?
Exhibit 7. The stock has displayed tight confluence to Fibonacci levels at each down-wave from its previous high in FY21. Tracing down from last high implied potential reversal to $201–$210.
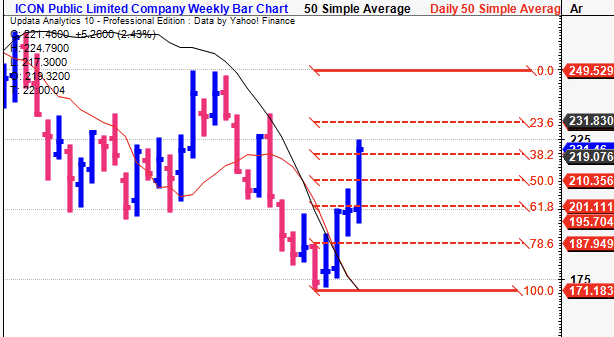
Data: Updata
Exhibits 8 and 9 give insight into this price visibility for ICLR. As seen on the daily cloud chart below, shares are still trading below cloud support, with the lag line in equal standing. It has faced resistance 2 times in the past year at the cloud, each time failing to push through.
Again there’s confluence from the cloud’s positioning with upside at $231, but it is trending downward and is widening, implying a continuation. Further, on-balance volume remains in a long-term down trend, whilst momentum hasn’t gathered any steam at all and is well below where it needs to be.
Consequently, these long-term trend indicators tell me there’s a fair way to go before we can consider a breakout. This tells me the latest upside move for ICLR has a low probability of success. I hold this view until the chart shows a reformation suggesting otherwise.
Exhibit 8. Long-term trend indicators aren’t showing any indication that a breakout is likely, invalidating the latest rally by estimate
Data: Updata
Point and figure charting also suggests further downside targets to $216, with an even lower target to $132. Should we see another pullback, these targets look increasingly be validated.
Exhibit 9. Downside targets to $216, $132
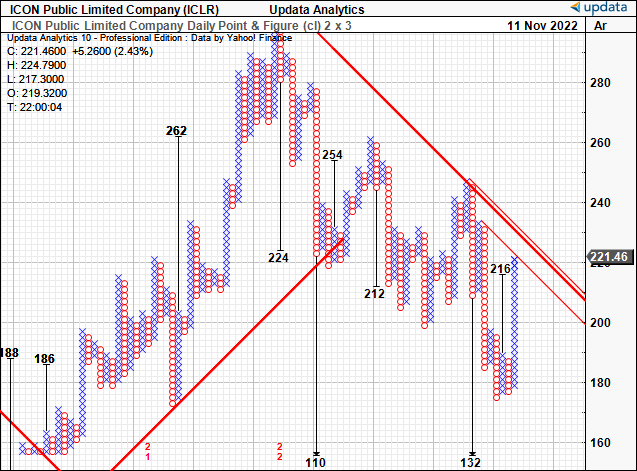
Data: Updata
I place heavy weight on the information derived from ICRL’s chart studies. There appears to be a lack of buying support into the latest recovery attempt, whereas trend indicators suggest the move is weak and lacks momentum. Price targets obtained from technical studies range from $216 to $231 in the medium term, with 1 target to $132.
Valuation and conclusion
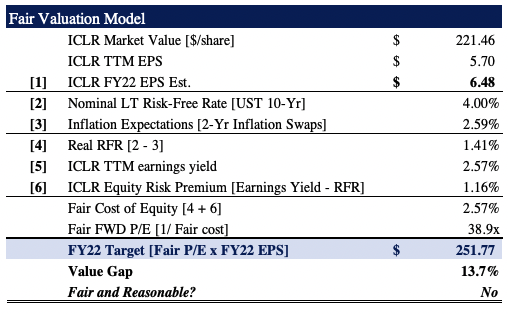
With the numbers given in Exhibit 5, we see ICLR fairly valued at 38.9x forward earnings, or $251.7 apiece. This is a high growth multiple that implies 13% upside from current value.
Given this view, I can’t help but remain neutral on the name as there’s multiple factors pointing in both directions for ICLR. On the one hand, 39x forward earnings is an attractive growth prospect. But investors receive a 1.16% real equity risk premium at this multiple and a c.3% forward earnings yield. These aren’t attractive numbers and rest behind starting yields achieved on corporate bonds with similar risk. Again, supportive of a neutral stance.
Exhibit 10.
HB Insights Estimates
Net-net, there’s conflicting data to suggest ICLR can extend its latest rally back towards previous highs. Without the flesh to put on the skeleton the distribution of potential outcomes dovetails and this reduces the visibility on a position going forward. Depending on one’s view of the market, there’s a chance investors will continue to sell ICLR towards new lows. I see it fairly valued in a range of $216 to $251, however – should it breach the $216 mark, there are downside targets to $132 in place. Rate hold.
Be the first to comment