

Madmaxer/iStock via Getty Images
Investment Thesis
“Green” energy is a prevalent theme among everyday investors fueled by a ‘common-sense’ thought process. ‘Save the world from climate change. Solve the energy crisis. Do it or you’ll miss out on the fruits of energy revolution.’ Saving the world from crisis while making money sounds exciting on paper. And yet, as Benjamin Felix, Portfolio Manager and Head of Research at PWL Capital would say,
If you’re excited about an investment, it’s probably not a good investment.
I believe the iShares Global Clean Energy ETF (NASDAQ:ICLN) is unlikely to benefit fund investors significantly. According to my analysis, while promising momentum characteristics may exist, the fund poses serious risks. Whether it’s the lackluster portfolio formation, political risks, historically sharp fluctuations in performance… ICLN offers long-term investors a horrible past and lackluster prospects going forward. As a result, recent performance may lack sustainability, lowering the fund’s rating to a Sell.
ICLN Strategy & Portfolio
iShares Global Clean Energy captures solar, wind, hydrogen, geothermal, and biofuel alternative energy companies. It holds 97 firms with a dividend yield of 0.87%, and an expense ratio of 0.40%. This passive indexed, $5.14 billion AUM Blackrock-sponsored ETF does this by following the S&P Global Clean Energy Index. The index includes firms that manufacture equipment meant for generating electricity as well as firms generating electricity directly.
Referring to the fund’s prospectus, its clean energy screening process executes the following steps:
- Take developed market firms with market caps of $300 million or more, greater than $100 million free-float cap.
- Screen for companies that either are in the renewable energy sector OR have at least 25% of clean-energy-associated revenue, with more than 20% of their energy generated via renewable sources.
- Ensure that the ratio of emissions-to-revenue and level of ‘brown’ revenue-generating pursuits are acceptable. The “brown” pursuits are checked against data provided by Sustainalytics and PepRisk.
- Assign a ‘green’ percentage value corresponding to the firm’s percentage of energy derived from clean/renewable energy generation.
- Finally, form the portfolio with less than 101 stocks, and greater than 85% weighted average ‘green’-ness.
The fund is so focused on ensuring companies are deeply clean in their energy production that it never directly accounts for drivers of expected return such as firm valuations or profitability. There is representative sampling relative to the index to ensure basic characteristics match up, however, this only relates to ensuring the passive portfolio accurately matches its index. On the other hand, this lack of optimization for higher expected returns helps the fund allocate more capital to the most ‘green’ firms instead of tilting to more ‘brown’ firms.
In this analysis, I will compare ICLN to two clean energy ETF competitors: the Invesco Global Clean Energy Portfolio ETF (PBD) and the Invesco MSCI Sustainable Future ETF (ERTH), before deep diving into analyzing whether its recent Momentum performance can be sustained.
The top 10 holdings, listed below with their weights, represent 48.05% of the total asset value. No holdings weigh more than 8%. ICLN may be substantially exposed to the idiosyncratic risks of its topmost holdings. I will discuss this further in the Risks section.
| Enphase Energy Inc (ENPH) | 7.57% |
| SolarEdge Technologies Inc (SEDG) | 6.75% |
| First Solar Inc (FSLR) | 6.17% |
| Iberdrola, S.A. (OTCPK:IBDRY) | 5.97% |
| Consolidated Edison Inc (ED) | 5.75% |
| Vestas Wind Systems A/S (OTCPK:VWDRY) | 4.20% |
| Plug power Inc (PLUG) | 3.46% |
| Ørsted A/S (OTCPK:DNNGY) | 3.09% |
| Centrais Eletricas Brasilieras S.A. (EBR) | 2.75% |
| EDP Energais de Portugal S.A. (OTCPK:EDPFY) | 2.34% |
| Total | 48.05% |
| # of Holdings | 97 |
*As of 2023-02-05, compiled by Author using data from the fund website.
Below I compare ICLN to PBD and ERTH by sector weighting. ICLN is exceptionally concentrated with allocations in only the four specific sectors of Utilities, Technology, Industrials, and Basic Materials. The 3% allocation to Basic Materials seems inconsequential, essentially turning the strategy into a tri-sector bet. As seen with the other ETFs’ similar ignorance of the Financials, Energy, Health Care, and Communication sectors, this sector concentration is par for the course within clean energy strategies.
Data: Seeking Alpha; Chart: Canva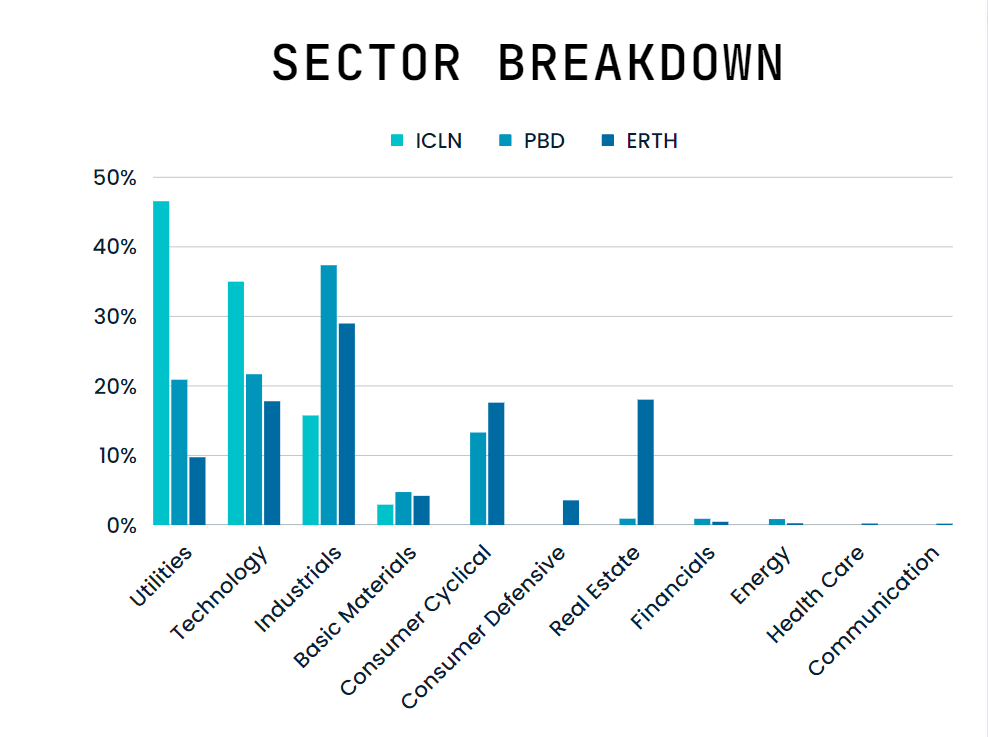
Confusingly, each fund calls themselves ‘Clean Energy’ ETFs, with ERTH previously referred to as the ‘Invesco Cleantech ETF’ under ticker PZD. Vast differences in sector weightings persist despite the similar naming scheme. Relative to the competition, ICLN extremely overweights the Utilities sector and is slightly overweight Technology. This results in an Industrials and Basic Materials underweighting relative to both. Not to mention noticeably unique weighting between PBD and ERTH across sectors.
Not only that, the geographical allocations of these funds are significantly different from one another as well. The only significant similarity is that all three maintain their greatest geographic allocations toward firms based in the United States and China. Quite the double-edged pairing.
In my view, allocating a large portion of the portfolio toward US equity markets could be a dangerous proposition amidst current treasury rates. In fact, Ray Micaletti of Relative Sentiment Technologies just tweeted the following on Monday:
Regrettably, despite positive returns of late, the evidence indicates there may be serious risk present in US equity markets.
I believe investing in China amidst the current semiconductor trade wars between the two nations could also prove risky. Tensions are intensifying following last weekend’s balloon hostilities. Worse, any sanctions could restrict access to the three ETFs’ 13%, 11%, and 16% China allocations, respectively. That’s over a tenth of the investment of each fund.
It’s also worth noting the high turnover ratios of these funds. Higher turnover doesn’t necessarily mean much for US-based investors due to the tax efficiency of the ETF wrapper. The wrapper can shield them from a lot of the trading inefficiency inside the ETF itself. On the other hand, for international investors high turnover tends to correspond with high taxes.
Data: Seeking Alpha; Chart: Canva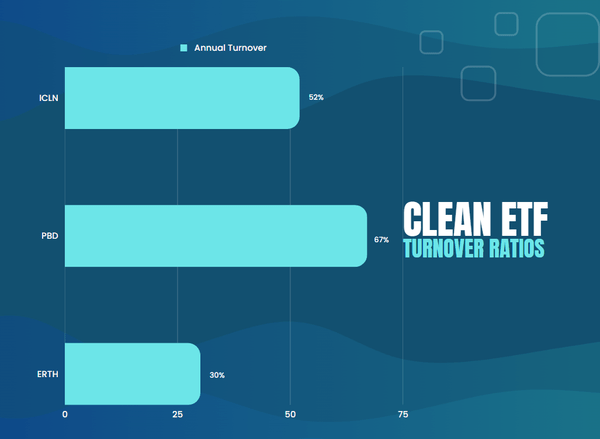
Such stark differences between similarly named funds are not uncommon in the ‘Green’ investing space. As we will see, wide disparity in methodologies carries over to a similarly wide disparity in the returns investors achieve.
Performance
ICLN underperforms both its peers. This persists over the full time period and over the most recent month, both in risk-adjusted and real terms. ICLN is also the riskiest of the 3, as its max drawdowns and volatility are far higher than its peers, doubling the max drawdown of ERTH.
| 1/1/09 to 2/1/23 | CAGR | January Return | 1-Year Return | Max Drawdown | Volatility |
| iShares Global Clean Energy ETF | 2.00% | 4.48% | 11.58% | -70.79% | 29.29% |
| Invesco Global Clean Energy Portfolio ETF | 5.00% | 13.62% | -3.28% | -56.98% | 27.83% |
| Invesco MSCI Sustainable Future ETF | 9.67% | 10.19% | -10.66% | -33.20% | 21.68% |
Compiled by Author using data from PortfolioVisualizer
That -70.79% drawdown was a dip that started in June of 2009 and reached its trench over 3 years later in July of 2012. It finally recovered just over 8 years later in September of 2020 to suffer another year-long drawdown in February of 2021. That drawdown of -36.37% was still deeper than the Invesco MSCI candidate’s worst drawdown.
PortfolioVisualizer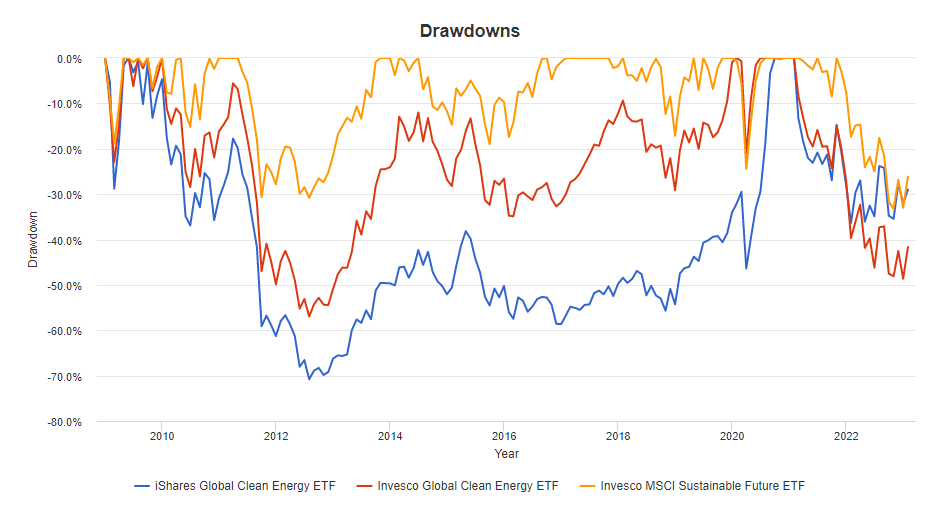
At the same time, ICLN has demonstrated significant positive performance over the past 12-month timeframe. This, combined with the underperformance over the most recent month, may prove a relatively significant indicator of a Momentum trade opportunity if it persists. With ICLN’s positive performance over the preceding 12 months in mind, I will analyze past performance data ending Friday, February 3rd, 2023 in the following section.
Momentum Persistence Analysis
Momentum persistence is the concept that strong stock performance continues and weak stock performance lingers. This style of analysis is commonly used to identify and track securities with exceptionally above or below-average performance over a given period.
Momentum is one of several factors that empirical evidence indicates may be driving stock returns. The factor’s underlying signals can help determine the likely direction of a trade going forward, at least for a short period. I previously explained the theory behind the factor as follows:
Momentum (WmL; Winners minus Losers) – The tendency for assets that have had positive, or negative, performance recently to continue performing similarly in the near future.
First, we can take a look at Seeking Alpha’s Quant Ratings for a preview of the possibility of ICLN as a momentum play:
Seeking Alpha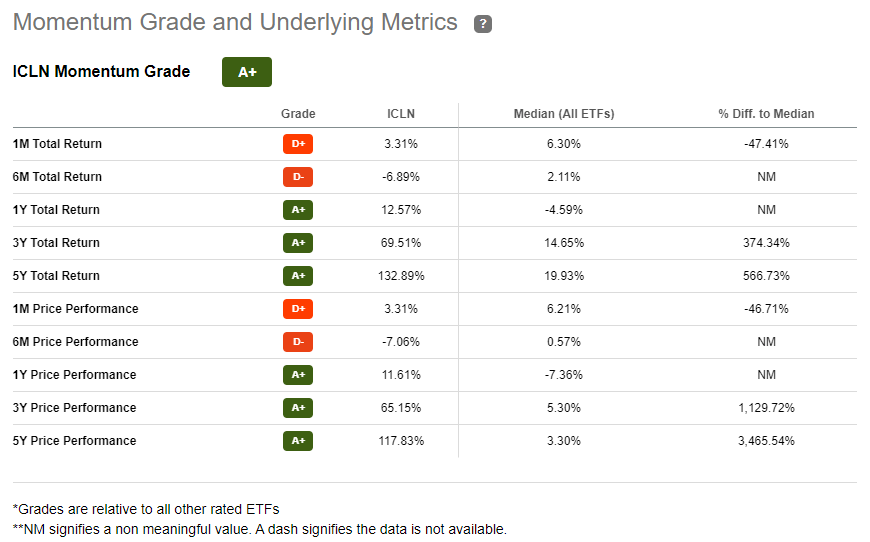
To expand on this, we can look to more specific metrics that drive Momentum’s predictive power. In the order of the most significant predictor of the following quarter’s direction of performance to the least significant and most likely to reverse:
| Momentum Signal | Performance Over Period (as of Friday, February 3rd) |
| 12-Month Momentum (excluding the past 2 week’s Momentum) | 12.13% |
| 12-Month Momentum | 10.58% |
| 9-Month Momentum | 5.79% |
| 6-Month Momentum | -9.50% |
| 2-Week Momentum | -1.55% |
Compiled by Author using data from YCharts
The 2-week Momentum is likely to reverse, while 6-month and longer durations – up to a full year – are increasingly more likely to predict a continued performance direction over the following quarter. My initial calculations align with Seeking Alpha’s A+ Momentum score. Momentum signals indicate continued positive performance over the upcoming months.
The question remains. Can ICLN sustain its performance in the long term?
ICLN’s Risks of Unsustainable Performance
ICLN still faces serious risks. Whether from political risks, or simply the methodology behind portfolio construction, ICLN’s underwhelming overall past performance may indicate the future results investors can expect.
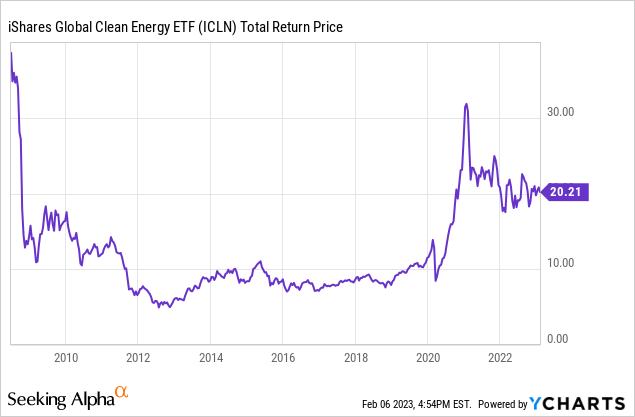
Worse yet, I believe evidence indicates that thematic investing and any technological revolution investing tend to have progressively lower returns on a go-forward basis as more investors pour in. These investments may be marketed exceptionally well, thanks to qualitative political and macro reasoning. At the same time, a lack of effective quantitative screening may make them more likely to underperform even if they experience large, exciting spikes in performance, as ICLN did with its 300% spike from 2020 to 2021. That spike was followed shortly thereafter by a steep fall, another smaller spike, and a similarly steep fall.
Although the Momentum metrics point towards positive performance over the following months, the ‘Frog-in-the-Pan‘ theory states that momentum strategies tend to be more profitable in upward-facing markets and markets with lower volatility. As discussed earlier, these aren’t necessarily upward-facing markets, given lower expected returns than riskless treasuries. To make matters worse, the volatility of the underlying holdings is a chaotic 51.25%. According to FactSet data from Alpha Architect, that’s higher volatility than over 87% of other equity ETFs in the FactSet database. This high degree of risk also aligns with Seeking Alpha’s Quant ratings.
Seeking Alpha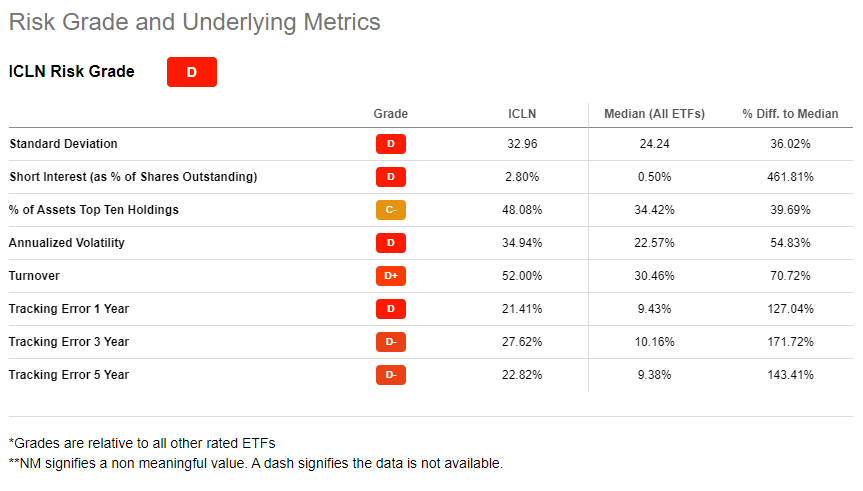
As indicated by the corresponding letter grades above, the tracking error of ICLN is extreme. It has only a 1% overlap in weighting with the iShares MSCI World ETF (URTH), representative of the developed markets in which the Clean Energy strategy resides. According to this calculation, the strategy only consists of a tiny sliver of the market. This extreme tracking error and lack of overlap is to be expected of the high degrees of concentration and idiosyncratic risk the fund offers through its construction methodology.
Takeaway
Investors increasingly turn to alternative energy investments to combine altruism with potential financial gain. Resolve the energy crisis, cure climate change, and reap the rewards of energy revolution! It’s quite appealing.
ICLN is a deep ‘Clean Energy’ ETF designed for these investors to buy. Unfortunately, the sore lacking of portfolio optimization signals to me that the fund may not currently be a solid long-term investment, despite some solid bursts of performance here and there.
While ICLN offers strong short-term potential, the political risks, choppy return patterns, un-optimal construction, overall negative performance, and potential for quick reversals weigh its rating down to a Sell.
Editor’s Note: This article discusses one or more securities that do not trade on a major U.S. exchange. Please be aware of the risks associated with these stocks.
Be the first to comment