

Kameleon007
In the 1990s, we used to call the opening hour of trade “amateur hour,” because that was when the less experienced and more emotional investors would make their moves. The final hour was coined “power hour,” as that was when experienced professionals and astute investors would act after more careful consideration of the day’s events. Therefore, weak openings followed by strong closes became the glue that sustained a developing uptrend in the market. In other words, it’s a bullish sign. Yesterday was a textbook example, and it was also the fourth day in a row we closed higher than we opened. Most are still calling this a bear-market rally, assuming that the Fed will bring it to an end next week with another interest-rate increase accompanied by more hawkish rhetoric, but I think the market is telling us that the rate-hiking cycle is over come next Wednesday with one more hike of 25 basis points.
Finviz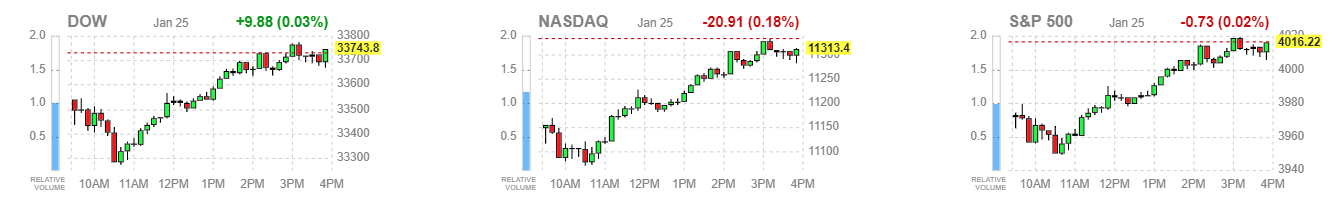
I have been recommending that investors listen to the market rather than the jawboning from Fed officials for months. Bears who have been eyeing a retest of the October lows would prefer to listen to the Fed for obvious reasons, but the Fed has consistently followed the market and not the other way around. Another market message is coming from the NY Fed’s Corporate Bond Distress Index, which shows that both investment grade and high-yield corporate bond pricing, liquidity, and trading are all exhibiting a declining level of stress from their October 21 peak. That peak came just two weeks after the S&P 500 hit its bear market low. This easing of distress is also a bullish sign.
NY Fed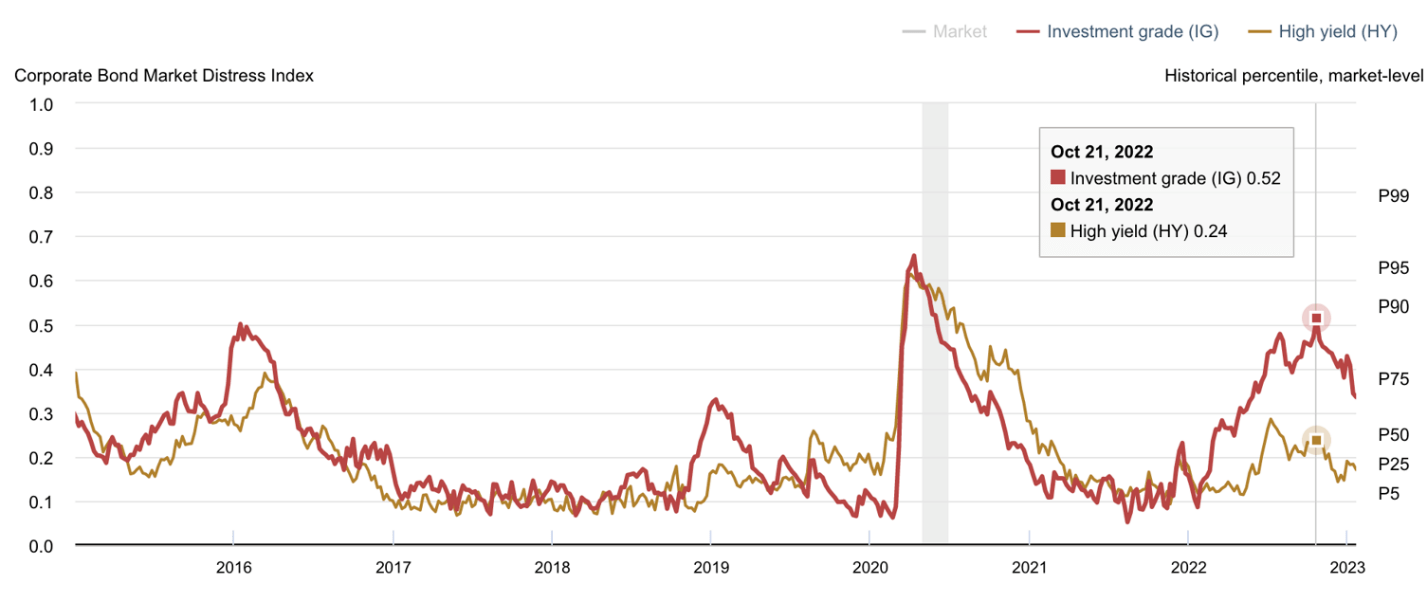
Lastly, we had a breadth indicator give a remarkably rare buy signal two weeks ago today, which I discussed in more detail last week, so it’s time for an update on its success. The Breakaway Momentum buy signal is registered when the ratio of advancing to declining stocks on the NYSE exceeds 1.97 over a ten-day period. It has only occurred 24 times since 1945, and last week’s buy signal makes it 25. The forward returns after achieving a Breakaway Momentum buy signal speak for themselves. The S&P 500 has been higher 96% of the time in the 6- and 12-month periods that followed the buy signal. Therefore, if you are betting against the market in 2023, you are running with a probability of 4%, according to this historical indicator.
TheStreet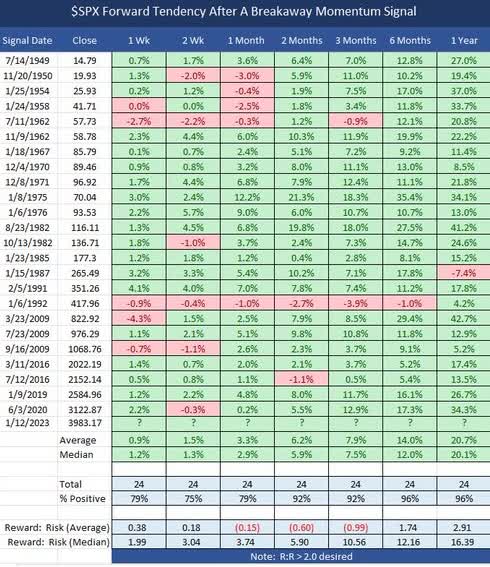
If the S&P 500 can close above 3983.17 at the end of today, we will have a gain for the 2-week period following the buy that was triggered on January 12. The odds of a gain have been 75%, and we look to be on track with a close of 4016 yesterday, but the odds of success steadily improve from 79% to 96% over the coming six monthly periods. It should be interesting to see how this pans out.
These market signals strengthen my resolve that we will see a lower terminal short-term rate from the Federal Reserve than the consensus expects, a more rapid deceleration in the rate of inflation than the consensus expects, and a soft landing for the economy that skirts recession. That should mean that the bear market is over and that a new bull market has begun, but we won’t have confirmation of that until new highs are achieved at some point far down the road. I’m more concerned right now about putting the lows behind us, which I have more confidence by the day that we have accomplished. A modest gain of 10-15% for the S&P 500 this year is my base case, but with lots of tug-of-war between bulls and bears over the major market averages on the way there.
Lots of services offer investment ideas, but few offer a comprehensive top-down investment strategy that helps you tactically shift your asset allocation between offense and defense. That is how The Portfolio Architect compliments other services that focus on the bottom-ups security analysis of REITs, CEFs, ETFs, dividend-paying stocks and other securities.
Be the first to comment