

Nature/iStock via Getty Images
Hudson Technologies, Inc. (NASDAQ:HDSN), was founded in 1991 and has been fighting in the refrigerant gas market for more than 30 years. We can say that it has gone through various market turmoil and arrived in 2022 with a particularly captivating gift. This dowry is represented by a huge market opportunity: the AIM Act in 2020 created a virgin HFC phase down of 40% in just over 2 Years.
And the real question is: will Hudson be able to take advantage of this new opportunity offered by the market?
Hudson is the largest reclaimer in the US with a 35% market share. The company has also the 50% of all certified (in reclaiming) laboratories in the US and is recognized as an industry expert. From the point of view of the general structure, the company has the capabilities to deal with the new challenge.
From the point of view of financial solidity, we can see how the profitability indices are heavily influenced by exogenous factors such as the price of gas on the market on the one hand and by the company’s ability to optimize inventory.
This has generated in the past (2018) a strongly negative EBIT Margin (-25.6%) and represents an element of high risk both in terms of future performance. The valuation of the share price seems fair and constitutes a good investment opportunity.
A great opportunity has appeared at the window and I think Hudson may have the right keys to open it. My rating is Strong Buy.
General Overview
Industry & Regulatory
Simplistically the main refrigerant gases can be divided as follows:
• CFC – chlorofluorocarbon: the production of virgin CFC was prohibited from 1996
• HCFC – hydrochlorofluorocarbon: the production of virgin HCFC was limited in 1996 and 2004 and was partially phased out in 2019. The total phase-out is scheduled by 2030
• HFC – hydrofluorocarbon: today may be used by industries instead of CFC and HCFC but in 2016 (Montreal Protocol) was decided to phase down the production by 85% by 2047. In 2020 the American Innovation and Manufacturing (AIM Act) established a 40% reduction in the baseline for 2024
• HFO – hydro fluoro-olefins: free to be produced and used
Company Overview
Hudson Technologies is a service company (with more than 30 years of activity) that buys and resells refrigerant gases and takes care of all the recovery, reuse, and reclamation services up to the final disposal of the refrigerant through its own or third-party industrial processes.
The company offers its services mainly in industries with refrigeration systems, air conditioning, and in industrial processes where a cooling system is required. Hudson also offers on-site customer service which aims to put the refrigerant system back into operation through high-value-added activities such as gas decontamination.
To date, Hudson buys HFO and HFC from its suppliers and resells them on the market, and deals with reclaimable gas from its customers (HCFC and CFC) through its services.
The big HFC opportunity
Investor Presentation 2022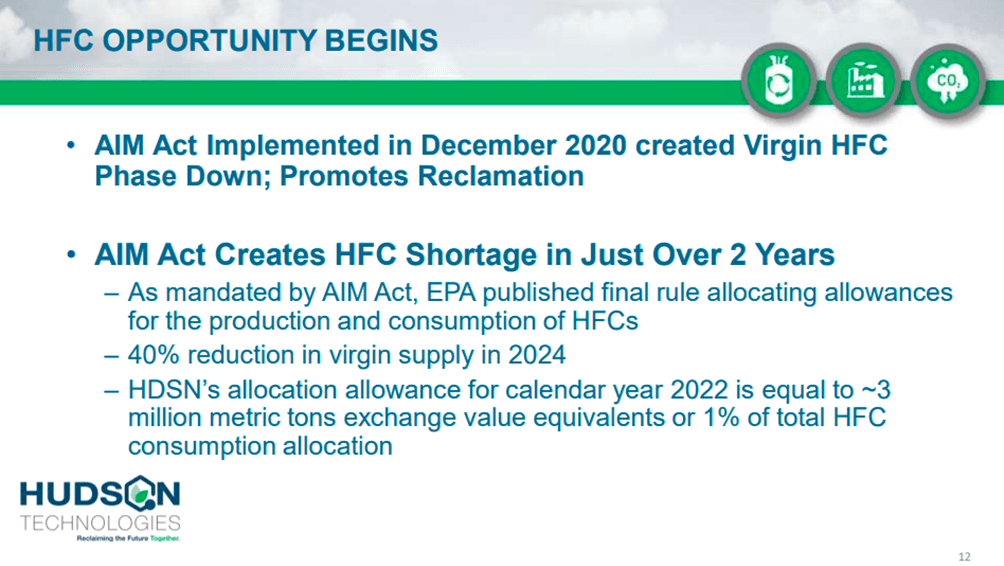
The AIM Act established a 40% reduction in the baseline for 2024. The total market is estimated to be 300 million Metric Tons Exchange Value Equivalents.
In 2022 Hudson received an allocation allowance of 3 million or 1% of the total market opportunity.
Hudson has the 35% of the total reclaim market.
Hudson could have a new business opportunity of 40% of 300M Metric Tons or 120M Metric Tons for a 35% market share equal to 42M Metric Tons.
In 2022 the Company has worked 3M and has a new 39M (= 42-3) of business opportunities. In other words, it means the company could more than tenfold its reclaim business (with a 50% Gross Margin) within 2 years. After 2024, the remaining 60% of the market has to be attacked.
The question is: Hudson Technologies, Inc. will be able to compete and win in this new market?
Financial & Highlight
Revenue and Profitability
10-K Forms + Author Graph
The graph shows an increasing revenue trend with a certain stability. the EBIT Margin data instead has a positive trend but the absolute data show substantial and worrying differences. 2018 sees an EBIT Margin of -25.6% while 2022 is at 42.4%. How is all this possible?
Starting from 2022 we can see at the last Q3 earnings call:
The growth was driven by increased selling prices for certain refrigerants during the quarter. The gross margin increase is mainly due to the significant increase in selling price without a material appreciation in the cost basis of certain refrigerants sold.
The great result of the EBIT Margin derives from a high appreciation of the selling price without a corresponding increase in the cost of the raw material (in inventory).
Back to 2018 reading the 2018 10-Q Form
The cost of sales for the year ended December 31, 2018, was $173.9 million, or 104% of sales. The Company’s performance has been negatively impacted by the challenging pricing environment affecting the industry and the market during 2018, leading to an increase in inventory reserves for certain gases. The increase in the cost of sales percentage between the periods is primarily due to the decrease in the selling price per pound of certain refrigerants sold for the year ended December 31, 2018, compared to the same period in 2017.
In conclusion, we can deduce that the main issue that determines the business profitability, beyond the correct operational management, mainly concerns the gap between the sale price and the purchase cost of the gas (or inventory cost). Unfortunately, this gap can be attributed also to company external factors and this represents a high source of structural risk.
Free Cash Flow and CapEx
10-K Forms + Author Graph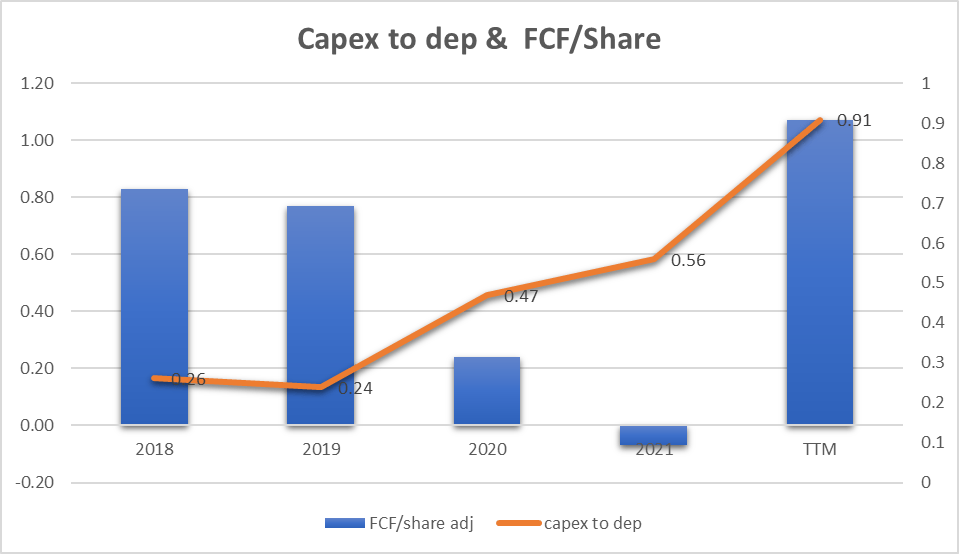
The graph shows the FCF/Share trend (blue bars): we can see how the FCF has a non-linear trend and it too is heavily influenced by net profit and above all by the change in inventory. When inventory is increased year-on-year as in 2021 ($46.9M increase in cost) free cash flow suffers heavily. 2022 sees a high FCF/Share parameter and this value could be used precisely for a further increase in inventory next year as we can hear from the last earnings call.
As we continue to generate additional cash flow into 2023, we expect to, one, further de-lever our balance sheet; two, ensure we have adequate inventory on hand; and three, consider other opportunities as they arise.
The orange line shows the ratio of CapEx to Depreciation. To evaluate the investments made by the company to keep its assets efficient, this ratio should be equal to or greater than 1. As regards Hudson, we can see how the ratio has gone from 0.26 (2018) to 0.91 (2022). The trend is improving but identifies a possible lack of sufficient investments for growth.
Hudson capabilities for HFC opportunity
Investor Presentation 2022
As we can see Hudson is the largest refrigerant reclaimer in the United States. This represents a structural competitive advantage over its competitors and puts the company, which is also the market leader with a 35% share, in the position of being the best alternative for customers’ choice.
Valuation
Earnings Power Value Model
Assuming that the cash profit remains constant over the long term, I use the EPV (earnings power value) method to calculate the share price
The method starts with EBIT. The second step is to add depreciation and amortization and then subtract stay-in-business CAPEX.
The result is the Cash Trading Profit
I then subtract the taxes by calculating the amount using the actual tax rate that the company pays.
The result is the After-Tax Cash Trading Profit
At least to calculate the total company enterprise value I divide the After-Tax Cash Profit by the interest Rate I define as fine for this kind of Company (HDSN is a risky company so I decided to use 12%)
The result is the Total Company Earnings Power Value. Dividing the result by the total number of shares we find the value per single share.
The table below shows the calculation for HDSN
| EBIT | 133.70 |
| Dep & amort | 3.30 |
| CAPEX | -3.00 |
| Cash Trading Profit | 134.00 |
| TAX | 22.00% |
| TAX | -29.48 |
| After TAX cash profit | 104.52 |
| Interest Rate | 12% |
| EPV | 871 |
| Share in issue | 45.1 |
| EPV per share | 19.3 |
$19.3 represents the share price valuation using the EPV method. If we compare the data with the current market price ($11.7) we see that the current price could be seen as cheap.
FCF/Share Model
To define a maximum buying price, I use also a formula based on FCF/Share and interest rate.
The formula is:
Maximum buying price = Cash profit per Share/interest rate – 20% (safety discount)
If TTM Cash Profit per share is $1.07
Interest Rate=inflation Rate = 7.75%
Maximum price before Safety discount = 1.07/7.75%= $14.3
The maximum price at 20% discount = $11.9
Under the FCF/Share analysis, it seems that the actual price of $11.7 is fair.
Peer Comparison
To compare HDSN with similar companies in terms of market capitalization in the Trading Companies and Distributors sector I have defined the following peers:
• Transcat, Inc. (TRNS)
• DXP Enterprises, Inc. (DXPE)
• BlueLinx Holdings Inc. (BXC)
• Alta Equipment Group Inc. (ALTG)
• Karat Packaging Inc. (KRT)
Using Seeking Alpha’s Quant Ratings we have a ‘Strong Buy’ verdict related to the ‘Hold’ or ‘Buy’ rating of the others company.
Seeking Alpha Seeking Alpha
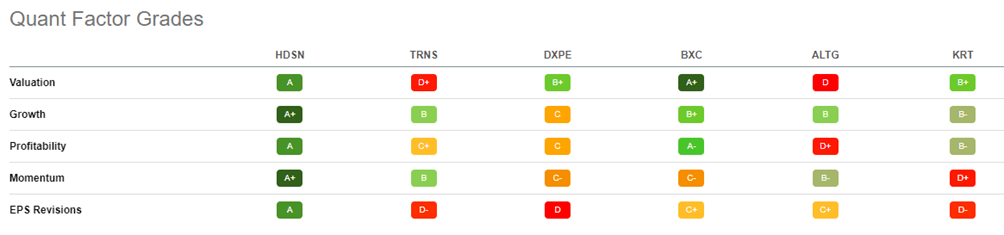
Under the Quant Factor Grades point of view, we can see how Hudson is outstanding in Growth and Momentum and I would like to underline also the Profitability Factor:
Seeking Alpha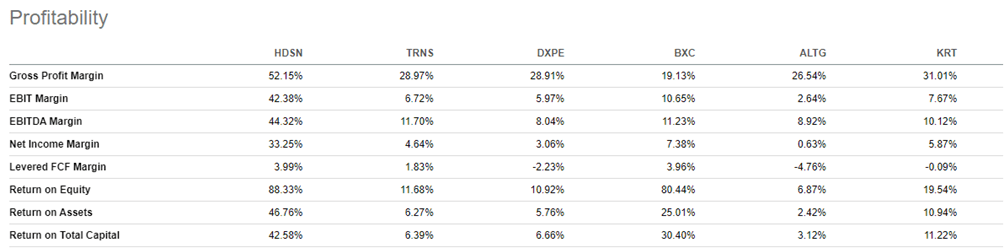
Hudson has 42.38% in EBIT Margin which is at least 4x better than the runner-up (BXC with 10.65%).
RISKS
Selling price versus inventory cost gap
Reading the 10-K Form we can see that one of the underlined risks is:
The Company’s ability to sell and replace its inventory on a timely basis and the prices at which it can be sold are subject, among other things, to current market conditions and the nature of supplier or customer arrangements, and the Company’s ability to source CFC and HCFC based refrigerants (which are no longer being produced) and HFC refrigerants (virgin production currently in the process of being phased down).
I think that this aspect can represent the key to success or, on the other hand, the failure of the company. If the supplies of a quarter or a year are wrong concerning the following period, the company could find itself in a situation of loss of profits and also in a strong cash flow deficit. This can become a show-stopper and, in extreme cases, also decree the end of the business.
CapEx for Reclaimer
We have seen in the previous paragraphs how the CapEx to depreciation ratio has been well below 1 in the last 5 years. This indicates that the company has probably spent little on maintenance or building new facilities. If we look at the great opportunity of HFC in the next 2 years, we cannot fail to underline how the reclaim structures must be suitable to support a much higher volume. If there is a lack of production capacity, this represents a risk of loss of turnover and marginality.
Conclusion
Hudson Technologies doubled revenue from $166.5M (2018) to $315.6M (TTM) in 5 years. The latest EBIT Margin is 42.38% and this does not need to be commented on. But is all of this generated by the company as a result of constant and linear growth? Unfortunately, the answer is negative as the determining factor of profitability is represented by the sale price of the refrigerant on the market and also by the value of the inventory built up in the previous quarters. Exogenous factors that require great management skills from the company are also in the future. However, the great opportunity is also an exogenous factor determined by the HFC Reclaim which could potentially increase the company’s business tenfold in the next two years. I think Hudson has a chance to fight and win this challenge and, for me, the rating is Strong Buy.
Be the first to comment