

Darren415
One of the biggest problems facing most Americans today is the pervasive inflation that has been pushing up the prices of many of the necessities that we have all come to depend on, such as food and energy. This has forced many people to take on second jobs or find other ways to increase their incomes just to keep the bills paid. Fortunately, as investors, we have many other options available to us to generate extra income in order to support ourselves. One of these options is to purchase shares of a closed-end fund that specializes in the generation of income. This is a good option because these funds can provide an investor with easy access to a diversified portfolio in one trade and these funds can usually deliver a higher yield than any of the underlying assets possesses. In this article, we will discuss one of these funds, the John Hancock Tax-Advantaged Dividend Income Fund (NYSE:HTD). This fund currently yields 7.30%, which is easily enough to turn anyone’s eye, and has a history of raising its distribution over time. In fact, this one has one of the best track records of any closed-end fund when it comes to its distribution history. I have discussed this fund before but that article was published over a year ago so obviously, a great many things have changed. This article will focus specifically on these changes as well as provide an updated analysis of the fund’s finances. Let us continue on and see if this fund could be a good addition to a portfolio today.
About The Fund
According to the fund’s webpage, the John Hancock Tax-Advantaged Dividend Income Fund has the stated objective of providing its investors with a high level of after-tax total return. This is not exactly surprising considering that the fund invests in equities and equities are by their nature a total return instrument. After all, we typically purchase equities in order to get both dividend income and capital gains. This is exactly what the fund is attempting to do as it states that it is targeting both dividend income and capital appreciation for its returns. As we might expect then, the fund primarily invests in dividend-paying securities. Interestingly, it does not state whether or not this only includes common equities or if preferred equity can also play a role in the portfolio. If it can include preferred equity, then it may work out to the benefit of shareholders, particularly shareholders that are risk-averse. This is because preferred equity is typically more stable than common equity in difficult markets. Unfortunately, preferred stock also does not have the same capital gains potential but it does usually have higher yields. Thus, including these securities in the portfolio could increase the fund’s income and reduce its volatility compared to an all-common stock portfolio. Although including preferred stock would reduce the fund’s upside somewhat, that may not be a big problem today considering that every sector except for energy is down year-to-date.
As I mentioned in my previous article on the fund, the portfolio consists primarily of utility stocks even though this is not, strictly speaking, a utility fund. We can see the bias toward these companies by looking at the largest positions in the fund:
John Hancock Funds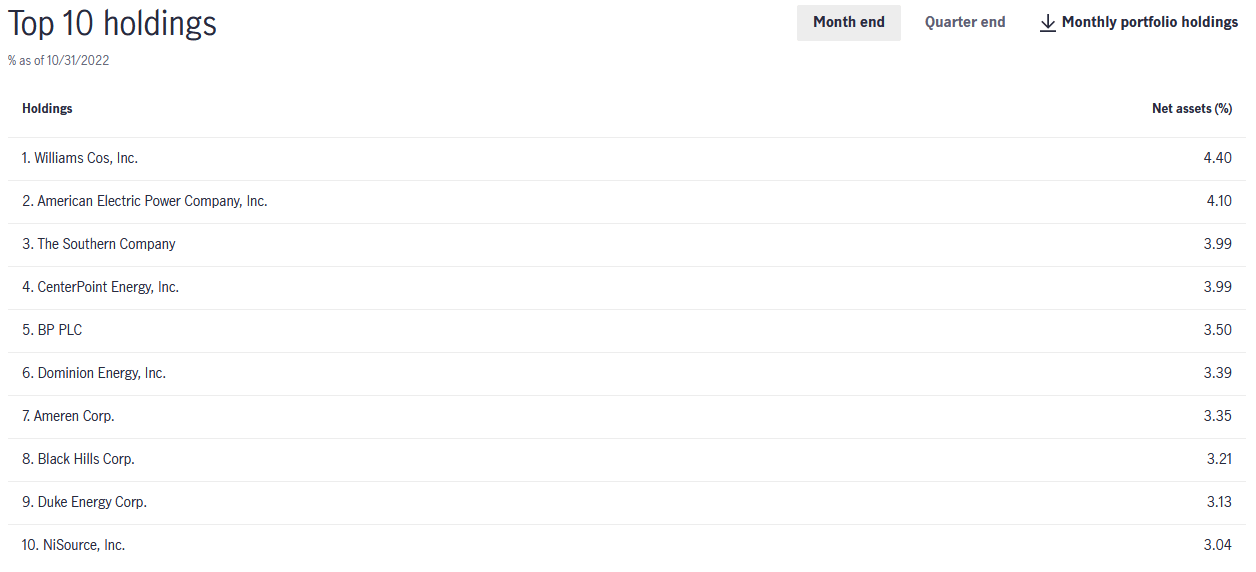
All of the companies on this list except for The Williams Companies (WMB) and BP (BP) are utilities. However, Williams Companies has many of the same characteristics as utilities such as stable cash flows and regulated operations. The only company here that does not have the same sort of stability over time is BP, but considering that is one of the largest energy companies in the world, it is also likely to be a somewhat safe pick. Overall, conservative investors should not really need to worry too much about outsized risks here.
One thing that we notice by looking at the fund’s largest positions list is that very few of the positions have changed over the past year. The only changes were Interstate Power and Light (LNT), Eversource Energy (ES), and NextEra Energy (NEE) with CenterPoint Energy (CNP), BP, and NiSource (NI). These were not all necessarily bad changes as NextEra Energy has been overvalued for quite a while and Eversource Energy is currently somewhat questionable considering the possible divestment of its offshore wind operations. NiSource, meanwhile, is substantially undervalued and BP diversifies the fund somewhat away from utilities, which is nice to see.
The fact that so few of the fund’s assets have changed over the past year may lead some to believe that it has a low annual turnover. That is indeed the case as the John Hancock Tax-Advantaged Dividend Income Fund has a 15.00% annual turnover, which is one of the lowest levels that can be found among equity closed-end funds. This could be an advantage because it costs money to trade stocks or other assets and these expenses are billed to the shareholders. This creates a drag on the fund’s performance that management would struggle to overcome. Fortunately, it does not appear that this is a huge problem here.
With that said, the John Hancock Tax-Advantaged Dividend Income Fund has somewhat underperformed its benchmark index year-to-date. The fund uses a blended benchmark index and not one that we could easily purchase an index fund to recreate. As we can see here though, the fund has underperformed that index year-to-date, although not by very much:
John Hancock Funds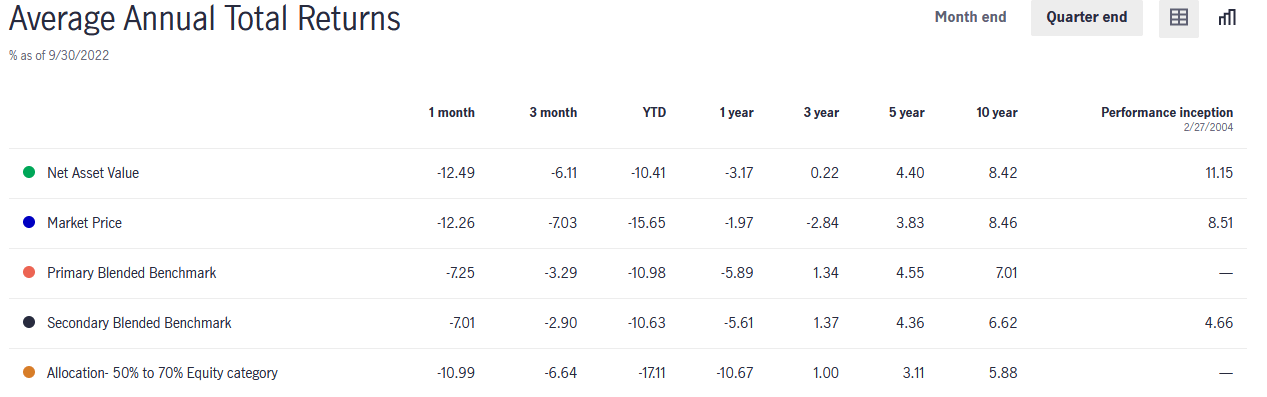
We do see that the fund has outperformed the benchmark index over the trailing ten-year period. However, as this benchmark is a proprietary index we cannot easily verify this. The fund has underperformed the iShares Global Utilities ETF (JXI) year-to-date, however:
Seeking Alpha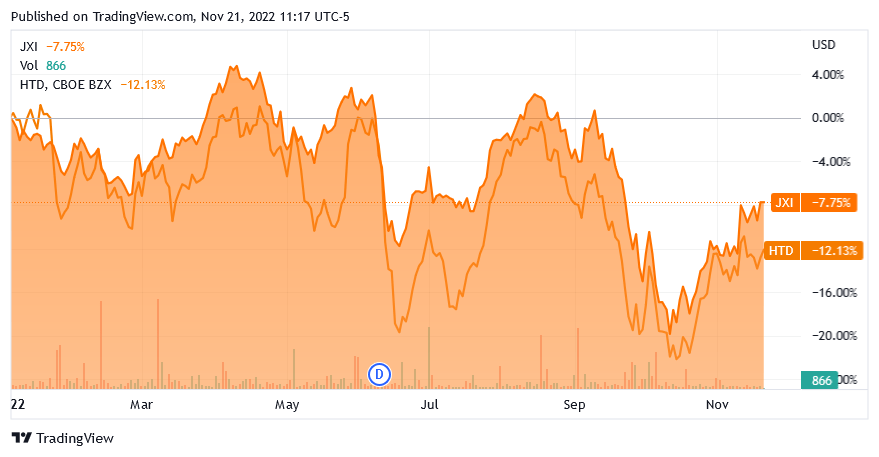
This index may be the closest to the fund that actually has an index fund available to track it and it has outperformed the John Hancock fund. However, when you include the fact that the John Hancock fund has a much higher yield, the two are very close. The S&P 500 index (SPY) is down 17.54% year-to-date so the John Hancock fund has certainly outperformed that and paid out a much higher yield to boot! Overall, we can see that the John Hancock Tax-Advantaged Dividend Income Fund has had a very solid performance track record recently, which is something that more conservative investors will likely appreciate.
Despite the fact that nearly all of the largest positions in the fund are utilities, the fund’s overall holdings are much less weighted to that sector than most would think. In fact, only 58% of the fund’s assets are invested in utilities:
John Hancock Funds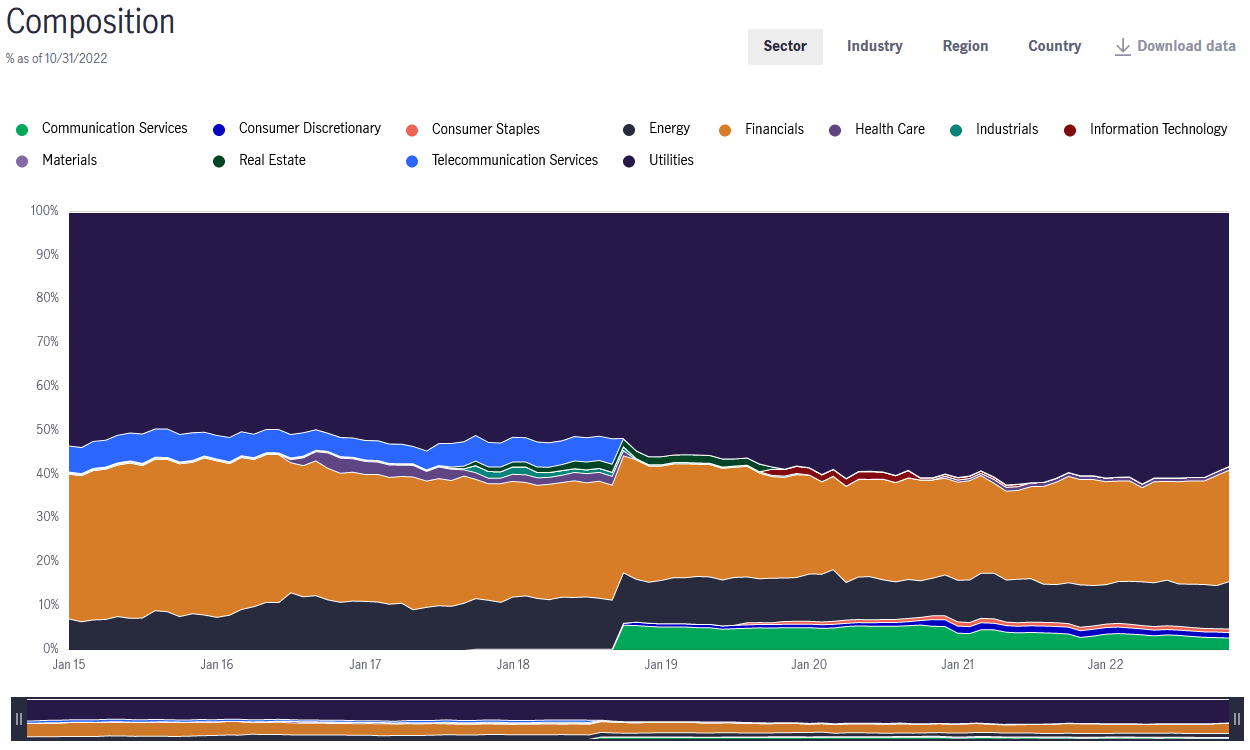
This further confirms that a utility index is not the best index to use for comparison despite this being by far the largest sector in the fund. This is because of the fact that a sizable minority of the fund’s assets are not invested in that sector. Still, though, it does have sufficient exposure that we should be able to benefit somewhat from the stability that utilities provide.
Distribution Analysis
As mentioned earlier, one of the objectives of the John Hancock Tax-Advantaged Dividend Income Fund is to provide investors with a high level of total return in the form of dividend income. In addition, the fund invests heavily in utilities, which tend to have higher dividend yields than most stocks. We might therefore assume that the fund boasts a high yield. This is indeed the case as the fund pays out a monthly distribution of $0.1380 per share ($1.656 per share annually), which gives it a 7.30% yield at the current price. The fund has not only been remarkably consistent about this payout over its history but it has in fact increased its distribution over time:
CEF Connect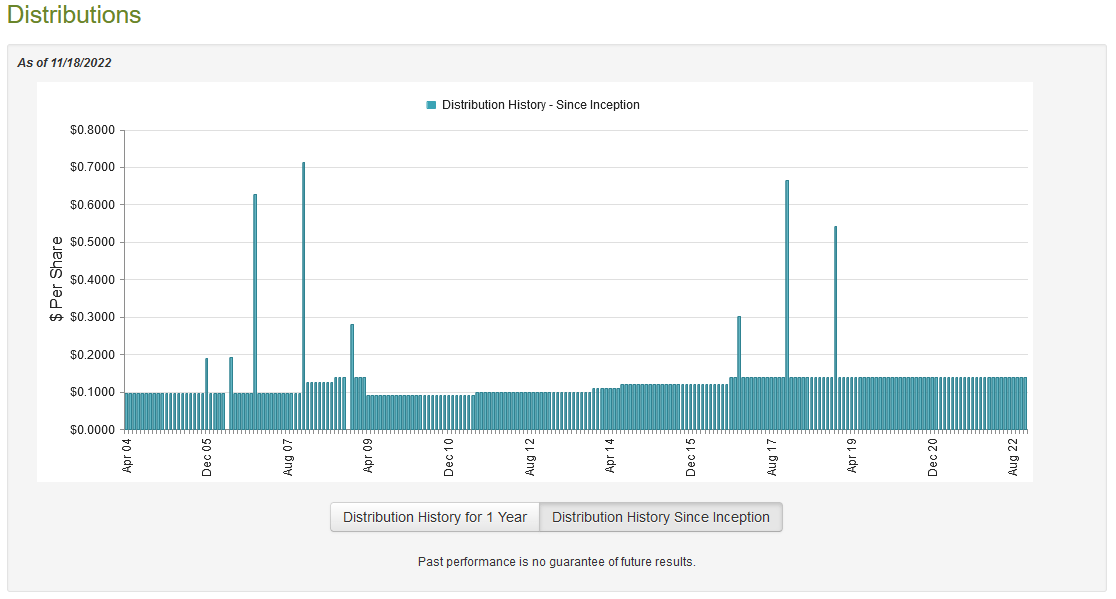
The fact that the fund is increasing its distribution over time is something that is very nice to see in inflationary times such as those we are seeing today. This is because inflation is constantly reducing the number of goods and services that we can purchase with the distribution. This makes it seem as though we are constantly getting poorer and poorer. However, a growing distribution helps to offset this and makes it easier to maintain our purchasing power. With that said though, the current distribution has been flat since 2016 so the track record of rising distributions has not really helped us lately. In addition, the fund has made a not insignificant amount of return of capital distributions over the years:
Fidelity Investments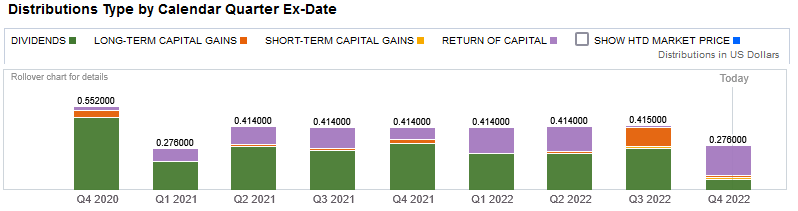
This is something that may concern some investors because a return of capital distribution can be a sign that the fund is returning the investors’ own money back to them. This is obviously not sustainable over any sort of extended period. However, there are other things that can cause a distribution to be classified in this way. One possibility is that the fund is distributing unrealized capital gains. As such, we should investigate the fund’s finances in order to determine exactly where this money is coming from and how sustainable the distributions are likely to be.
Unfortunately, we do not have a particularly recent report to consult for this purpose. The fund’s most recent financial report corresponds to the six-month period ending April 30, 2022. As such, it will not include any information about the fund’s performance over the past several months, which was certainly a period of volatility for the market. However, the report will likely provide us with some insight into the source of those return of capital distributions that we see in the first quarter of the year, which are some people’s biggest concerns. During the six-month period, the John Hancock Tax-Advantaged Dividend Income Fund received $25,314,819 in dividends and $5,842,616 in interest from the assets in its portfolio. After we net out foreign withholding taxes, the fund had a total income of $31,019,979 during the period. The fund paid its expenses out of this amount, leaving it with $24,063,389 available for investors. This was not enough to cover the $29,324,476 that the fund actually paid out in distributions but it did get much closer than most equity funds do.
It should not be surprising though that the fund has other methods available to it to obtain the money that it needs to cover its distribution. The most important of these is capital gains. The fund, perhaps surprisingly, had a reasonable amount of success at this as it had net realized gains of $3,571,639 and benefited from another $6,685,372 net unrealized gains. In total, the fund’s assets increased by $5,213,880 during the period even after covering its distribution. This is the sort of thing that we like to see as it clearly indicates that the fund is covering its distributions. It managed to achieve the same feat during the full-year period that ended October 31, 2021, which adds to our confidence here. Overall, the fund’s distribution appears to be reasonably safe.
Valuation
It is always critical that we do not overpay for any asset in our portfolios. This is because overpaying for any asset is a surefire way to generate a suboptimal return on that asset. In the case of a closed-end fund like the John Hancock Tax-Advantaged Dividend Income Fund, the usual way to value it is by looking at the fund’s net asset value. The net asset value of a fund is the total current market value of all the fund’s assets minus any outstanding debt. It is therefore the amount that the shareholders would receive if the fund were immediately shut down and liquidated.
Ideally, we want to purchase shares of a fund when we can acquire them at a price that is less than the net asset value. This is because such a scenario implies that we are purchasing the fund’s assets for less than they are actually worth. That is fortunately the case here. As of November 18, 2022 (the most recent date for which data is currently available), the John Hancock Tax-Advantaged Dividend Income Fund had a net asset value of $23.30 per share but the fund currently trades for $22.87 per share. This gives the fund’s shares a discount of 1.85%. This is a much better price than the 0.26% premium that the fund’s shares have had on average over the past thirty days. Thus, this current price looks like a very good entry price.
Conclusion
In conclusion, the John Hancock Tax-Advantaged Dividend Income Fund appears to offer a great deal to investors today. The fund is invested in reasonably safe dividend-paying companies, primarily utilities, that have held up better than many other things in today’s market turbulence. When we combine this with a very solid and secure 7.30% yield at the current price, the fund’s appeal becomes even more apparent. Finally, the fact that the fund is trading at a discount to net asset value makes it very deserving of consideration today.
Be the first to comment