

Maximusnd
We all learn our lessons when things go wrong. It is unlikely that we will anticipate the next crisis in the stock market. It can be the internet bubble (2000), the financial meltdown (2008), the trade tariff policy (2019), Covid (2020), or inflation (2022). We react late, which is better than doing nothing but not as good as anticipation.
In 2000 I learned that a simple moving average rule would have limited losses to 10% or 15% in Nasdaq rather than the 85% that buy-and hold-traders suffered. In 2008 I learned that extreme volatility was a good way to recognize when risks were too high and we should reduce exposure or exit everything.
Then there was a 10-year bull market (2010 to 2019) and profits make us forget the risks. And here we are again in a prolonged bear market with some financial institutions saying that it is going to get worse and others that it will end this year. That’s not much help.
The Fed
The U.S. Federal Reserve (the “Fed”) tries to be transparent about their policy. They have been repeating their intention to raise rates, and hold them high, until inflation falls back to 2% — well, maybe 3%.
Equity and futures traders always try to anticipate a change of direction. Despite rising rates, the 10-Year Treasury Note futures have not made new lows since November (Chart 1), even though rates have been raised twice.
Source: CSI data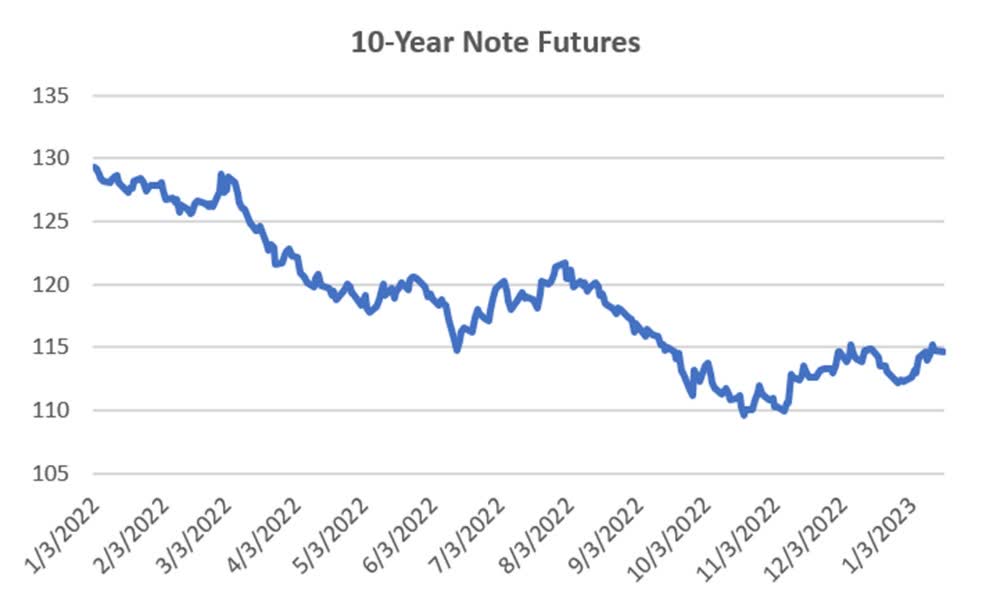
Chart 1. 10-Year T-Note Futures from January 2022.
And while the S&P is off its highs by 16% and Nasdaq by 30%, they also keep resisting making new lows. What can we do?
The Way the Fed Works
The Fed is chartered to keep the economy stable. That means controlling inflation and encouraging employment. It can do that only by raising and lowering interest rates. It does not do that erratically. It does it methodically – one step at a time.
There are three scenarios that we have seen since 2000.
- Lowering rates after the Internet Bubble of 2000, and lowering rates after the Financial Crisis of 2008. In both cases to stimulate the economy and help the recovery.
- The second case was raising rates from 2004 through 2007 to “normalize” rates and possibly to dampen an aggressive stock market.
- Then there is now, raising rates to lower inflation.
If we can mirror the way the Fed acts, we will know how to hedge the S&P and avoid the steep drawdowns.
Find the Interest Rate that Reflects Fed Action
We start by looking for an interest rate series that shows what the Fed is doing. We can see immediately (Chart 2) that interest rate futures include a lot of trader anticipation. The longer the maturity, the more speculation. In Chart 3 the 5-year Note is smoother than either the 10-year Note or 30-Year Bond.
Source: CSI data.
Chart 2. Interest rate futures price history.
But none of these are smooth enough to give us a reliable direction on where rates are going. If we try smoothing the data using a moving average, even the “best” moving average, we would be jumping in and out and probably losing money.
We need to look for a short maturity interest rate that shows us what the Fed is doing. Chart 3 is the 30-Day T-Bill rate. It looks much better, but it is still too noisy.
Source: CSI data.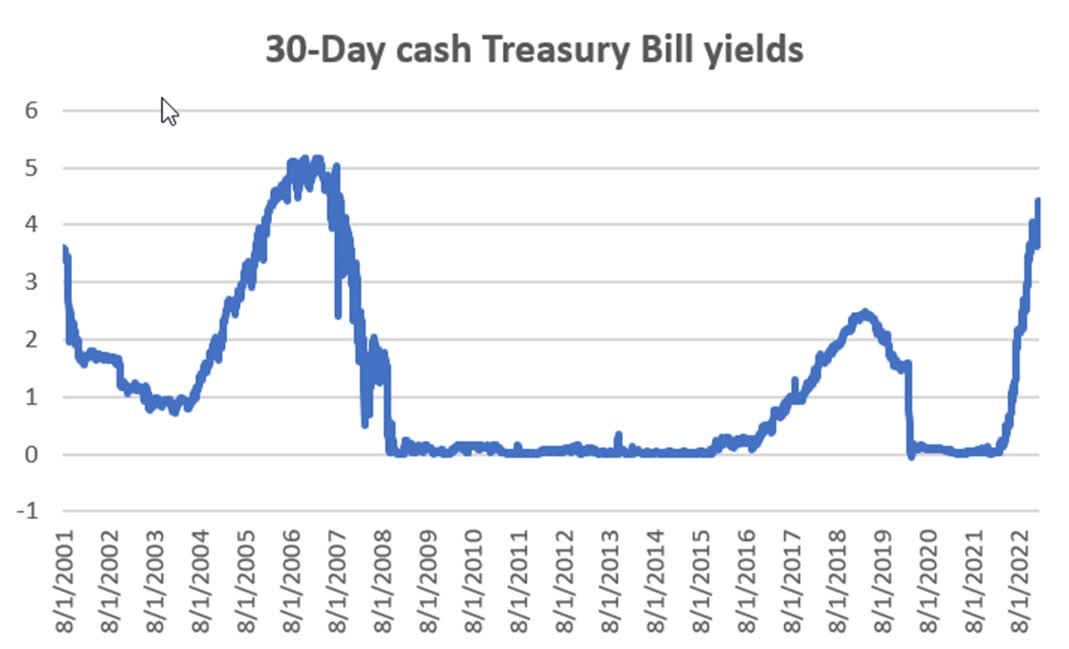
Chart 4. Cash 30-day Treasury Bill yields.
It turns out that the Fed Discount Window rate is what we want. I found that using CSI data under the code E0RY. It reflects Fed action in clear steps.
Source: CSI data.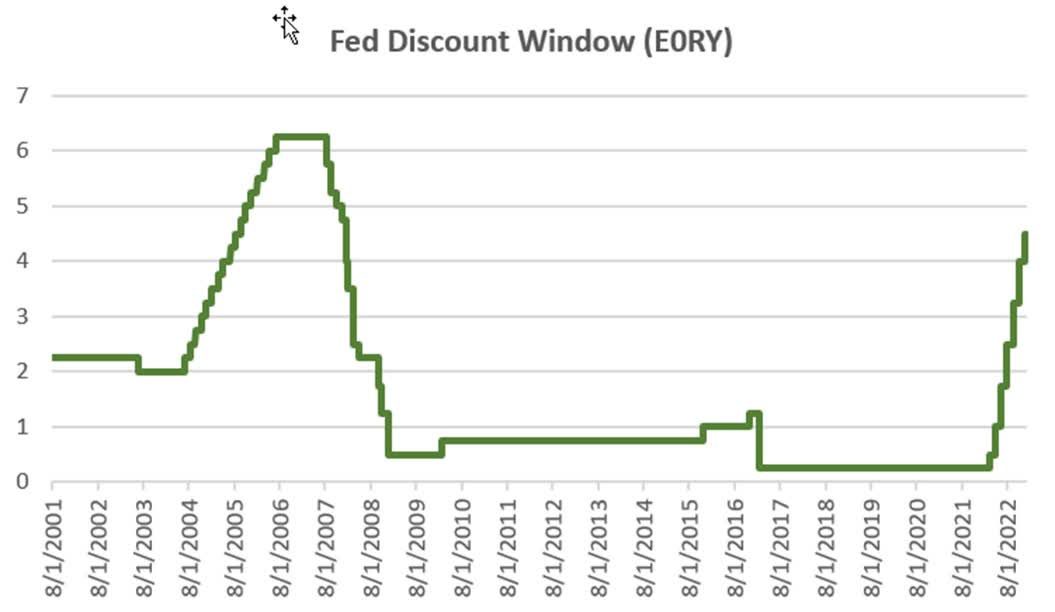
Chart 5. The Fed Discount Window interest rate (E0RY)
To represent inflation, we use the basic CPI (without food and energy). That data is monthly (Chart 6) and has periodic spikes. They don’t make this easy.
Source: CSI data.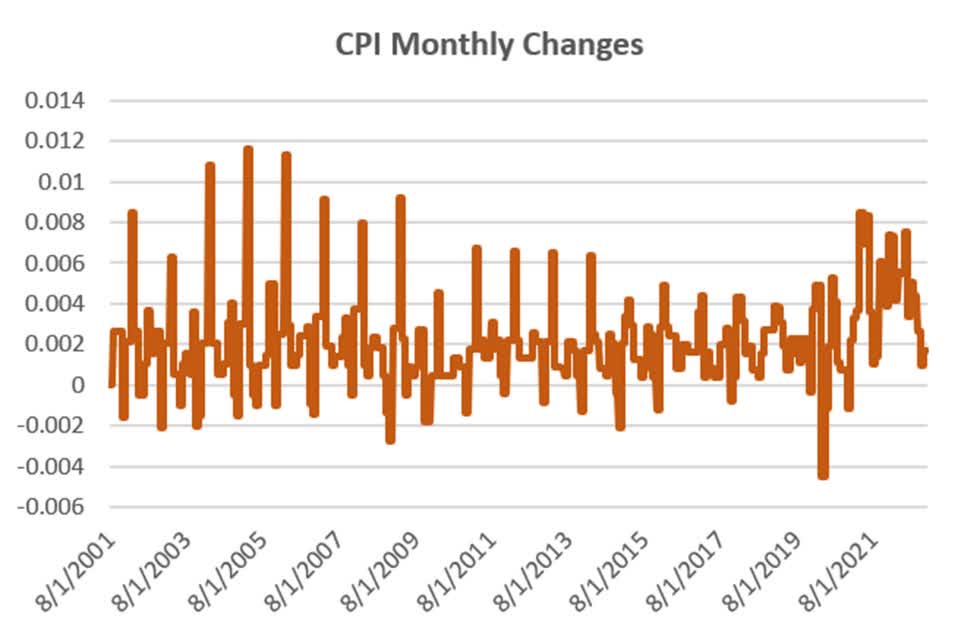
Chart 6. CPI monthly data without food and energy.
We can fix this by removing the seasonality, easily done by averaging every 12 months. We can then see what we expect in Chart 7. Inflation has remained mostly below 2% until recently.
Source: CSI data.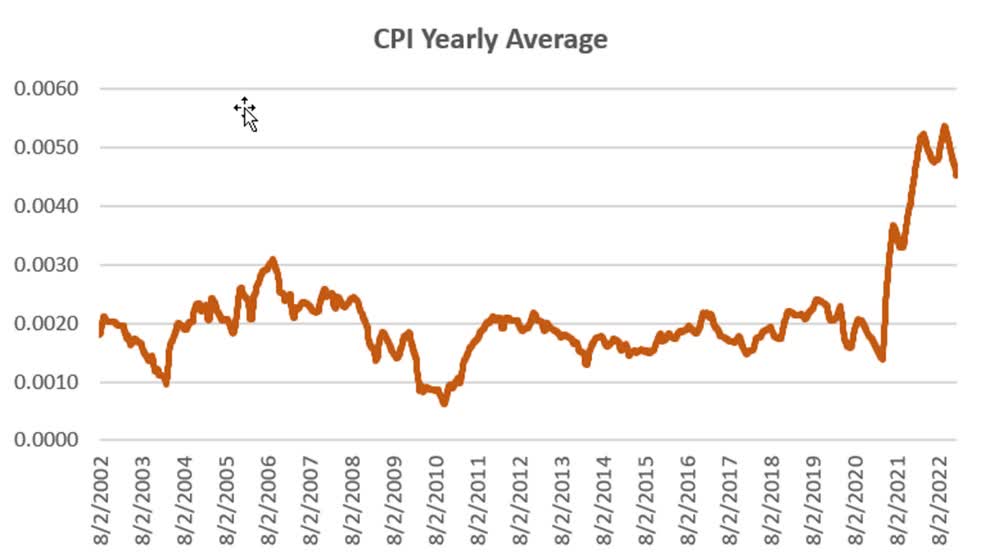
Chart 7. Removing the seasonality of the CPI using a 12-month average.
Now we have everything we need: a view of the Fed action, a measure of inflation, and, of course, the direction of the S&P.
The Hedge Rules
Remember that there are three scenarios we need to resolve:
- If the discount rate is below 1.25% or the discount rate is declining, and the CPI is below 3%, then we have no hedge.
- If the discount rate is rising and the CPI is above 3%, then we are hedged.
- If the discount rate is rising and SPY is falling, then we are hedged.
- If none of the above, we are not hedged.
To decide rule 3, we use a 23-day breakout signal, 1 month, applied to SPY. If SPY makes a new 1-month high, then it is rising. If it makes a new 1-month low, it is falling. We use the CPI in Chart 7 to decide the rate of inflation.
Hedging Results
As hard as I try, nothing is perfect. Chart 8 compares the SPY prices with the results of the hedged SPY. Clearly the hedged results are better. They have an AROR of 11.35% compared to SPY of 6.61% and a risk of 16.6% compared to 19.1%. The hedged method has a payout ratio of 0.68 compared to SPY with 0.35.
Source: CSI data.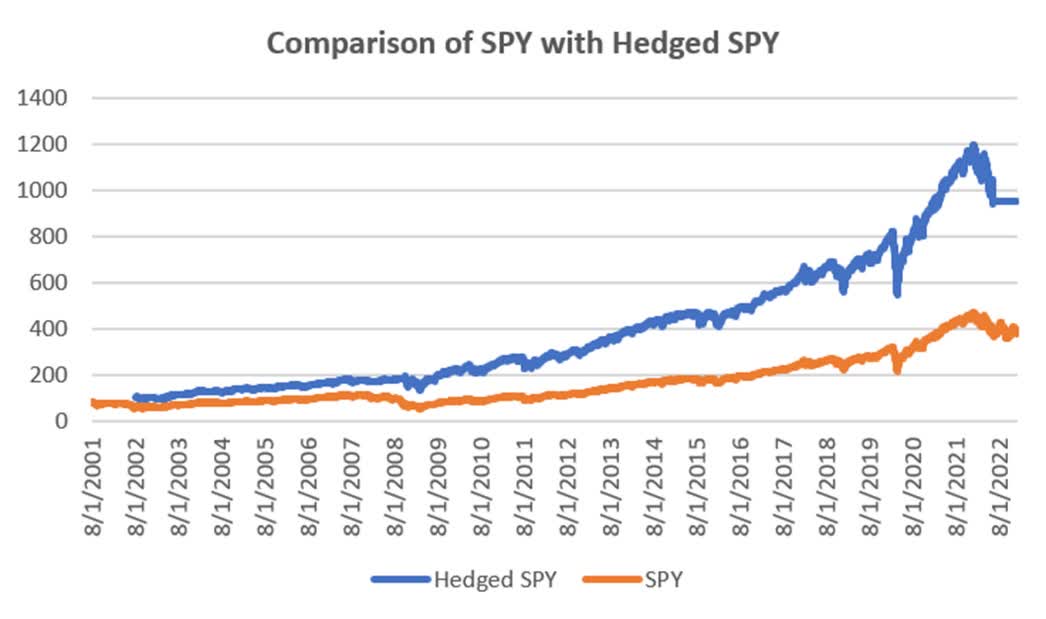
Chart 8. Comparison of SPY with the hedged SPY.
The disappointment is that I could not remove the 20% drawdown at the end of 2022. If the market continues lower, it will look good. If the Fed starts lowering rates the hedge will be lifted. It’s safe.
A Little Effort but a Good Return
There are only four rules but they require setting up a spreadsheet to monitor the CPI and the trend of the S&P. The Discount Window can be used as is. I think these rules reflect the way the Fed works, and it accounts for the three cases we’ve seen since 2000.
You will find that it will be necessary to exit your portfolio for a month at a time, sometimes longer. Most of those exits came during the sell-off following the internet bubble, and then during the financial crisis of 2008. In exchange, you can earn interest on your investment. The results would seem to make this a worthwhile effort.
Be the first to comment