

JimVallee
The IMF in its World Economic Outlook (WEO) has endorsed central banks fighting inflation, but has warned that statistical evidence suggests that it could take three or four years for inflation to come under control when central banks have finished fighting inflation. The IMF cites two studies: one from 2012 and one from 2016, suggesting that these lags are relatively long.
As investors, we are not particularly interested in the econometrics or what the IMF thinks. What we’re interested in is what the facts are and how long it will take for inflation to fall. Do these studies really shed light on that phenomenon? I think there’s a real possibility that the answer is “no.” The Federal Reserve failed to acknowledge that the rise of inflation in this business cycle was real in part because it used a model that was estimated over a period with such tranquil inflation that it became incapable of identifying inflation when it came along. The Fed’s model thought that since nothing created inflation for such a long time, nothing would create inflation in the future… This was wrong. And this is the problem with looking at models, particularly models that are not particularly up to date.
The world changed in 2020. Let’s look at a chart on inflation – because the world also changed after about 1985; certainly after 1990. I suspect that the real answer is that the speed of bringing inflation to heel will depend on the Fed’s vigor – regardless of these studies – more on that below.
Chart 1
PCE Versus Real Fed Funds (Haver Analytics and FAO Economics)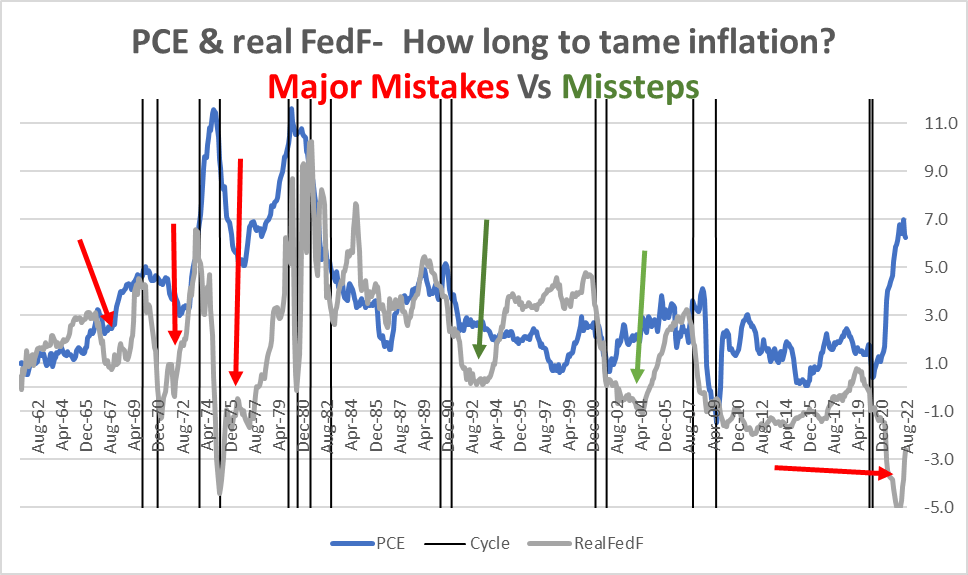
The chart above looks at the rate of inflation that the Fed targets, the Personal Consumption Expenditures Price Index (PCE). These are the year-over-year percent changes in the PCE from early in the 1960s to date. Plotted on the same chart is the real fed funds rate, which is the nominal fed funds rate with the very same 12-month PCE inflation rate subtracted from it. I have placed six arrows on the chart to identify policy mistakes during this period. The four red arrows represent serious mistakes; the two green arrows represent missteps that the Fed was able to correct.
Policy Mistakes
The Fed’s most common monetary policy errors have been allowing the real fed funds rate to fall while inflation is rising or letting the real funds rate fall extremely low even into negative territory even if inflation is falling but is still far too high (remember the underlined portion). The problem faced in 2021-22 is new; the Fed did not use to have a problem getting the Fed funds rate up high enough as inflation rose… But it is still not too late for the Fed to make its ‘traditional mistake as well.
Monetary policy lags
There is an expression in economics about how monetary policy works that was made famous by Milton Friedman. After a long study of monetary policy in the real world, he concluded that monetary policy works with “long and variable lags.” This phrase has now become enshrined in the pantheon of economic stylized phrases that are true. However, I want to suggest here that this phrase is – in fact – not true (what I suggest is economic heresy). And here is how I’d like you to consider that rebellious thought:
A thought experiment– If monetary policy were conducted the same way time after time under the same circumstances, do we really think that there would be quite different results and that the lags on under which policy worked would be of varying length? I don’t think so. I think Friedman came to his conclusion about monetary policy after looking at how monetary policy worked over broad periods in the “real world” when there were a series of very different economic conditions. It’s not monetary policy that works with long and variable lags, it’s the monetary authorities who may become confused and may not realize the proper dose or tack of monetary policy that is required under differing economic circumstances. Or, who simply lack the will to do what’s needed. And I think you see an examples of that in the chart above (Chart1).
Do ice cubes melt with variable lags?
If that’s a little bit too abstract, let me try a different explanation. Suppose I were to ask you, how long does it take for an ice cube to melt? You may not know the answer off the top of your head. And if you want to give me a precise answer, you may start pulling ice cubes out of the refrigerator and timing them to see how long it takes them to melt. However, what you are going to find out is going to depend on whether you take the ice cube directly out of the freezer and start to time it immediately, or whether you let it sit out of the fridge for a while before you begin to time its melting. It will also depend on whether you time its melting when the room is warm or when it’s cold. It will depend on the treatment of the cube itself: is it floating in water or out in the open air? Did you put it in a pan on the stove? And then there’s the question of how are you going to answer the question? Are you going to measure the time until the ice cube begins to melt or are you going to wait until the ice cube is completely melted and has become only a puddle of water? And when you grab ice cubes from the freezer compartment to test, are they all the same size or not? So many ice cubes, so little time.
So this is a fairly straightforward question about how long it takes to melt an ice cube. It’s not very complicated. We can all consider it and understand it. But when I ask for a precise answer to the question, you begin to realize all the different variables that might be involved in trying to answer that question… with precision. Just imagine all the different circumstances monetary policy faces in an economy when the central bank is trying to conduct policy.
As in the example above, the main variable concerning melting an ice cube is not the ice cube itself, the main variable is the environment. When the Fed conducts monetary policy, we know pretty much what the tools are that the Fed has. The question is, how is the Fed going to conduct its policy? Is it going to use its tools aggressively, or not? Is it going to act soon? Or is it going to wait and see what the environment is like? And what IS the environment like?
How long…normal times
Turning more specifically to the question at hand, my answer is that for the most part the lags in monetary policy are not particularly long and they’re not particularly variable. If you’ll let me skip ahead to the less interesting part of the story, after 1980, it’s quite clear that the various recessions marked on the chart (Chart 1) show inflation popping up in the recession and then going down very quickly early in the recovery. That happens in 1990, it happens in 2000, it happens in 2007, it even happens during the very short Covid recession. If the Federal Reserve is dealing with a moderate inflation problem or with stable prices ahead of the recession and inflation rises, then, if the Fed wields its monetary authority properly, the rise in inflation proves to be very short.
How long if the Fed fumbles?
However, if the Fed is not vigilant… If monetary policy is sloppy… If the Fed gets distracted and has other objectives (like global warming, or “creating jobs” by keeping the unemployment rate “too low”), then it might allow inflation to creep up and the higher that inflation is before recession starts the more difficult it’s going to be for the Fed to get rid of that inflation. We see that in the 1970 recession, we see that in the 1973 to 75 recession, and we see that in the 1980 and 1981 couplet of recessions created by the extremely tight monetary policy under Paul Volcker. In those cases, 3 to 4 years seems about right to control inflation…or not even enough (see Table 1, below).
The Fed made mistake by cutting rates too soon before the 1969-70 recession; it did that early in the recovery from the 1969-70 recession; it did that early in the recovery from the 1973-75 recession. Those were mistakes; those were costly mistakes. The PCE inflation rate in the recovery from the 1973-75 recession could not even get back DOWN TO its pre-recession peak! That’s a formula for disaster.
The Omen
Also notice how having high inflation ahead of recession is a bad omen (1969, 1973, 1980, 1981 – table below). Three of those recessions had even higher inflation in the year after recession than in the two years before (Yikes!). 1981 was the exception because it was the healing recession. Even though 1990 also had a high inflation reading ahead of recession, inflation was on a downtrend, and in 1990, 2001, and 2007 inflation was lower after recession (…or if not, it was still below 2%!). Note 2020 inflation beforehand is 1.8% a year after it averages 1.6%, but at the 13-month mark inflation already is running at a 3.5% pace- whoa! If recession were to start today, the two-year period ahead of (the upcoming) recession has inflation at 3.6% – and every month we go without having recession start, the two-year ahead inflation rate will get higher! Our current situation is looking more and more like those in the past with bad omens for policy. This is what the Fed’s delay in acting to raise rates has produced – this delay was not benign…
So now the relevant question is how long will it take for the Fed to knock this inflation rate down to target?
The Fed’s actions in recessions
We can see in both the 1973-75 and also the 1980 recessions that when the Fed reacted to very high inflation by raising interest rates, it did get some control over the inflation rate and brought it down, but in the case of the 1969 recession and the 1973-75 recessions the Fed did not stick with its tight policies long enough.
Table 1
Inflation And real fed funds around recession episodes
Recession Policy Metrics (Haver Analytics and FAO Economics)
In the table, I’ve color-coded the two early recessions as pink, representing the too-hot inflation that was allowed to develop. I’ve coded the 1980 and 81 recessions as yellow, reflecting the fact that these are remedial recessions in which the Fed was taking steps to get inflation under control. And the rest of the table is left with a white background. Will the next recession be pink?
For each of these recessions, I’ve looked at the PCE inflation rate average two years before the recession started, the PC inflation rate average 12 months after the recession ended, and then at the year-over-year PCE rate that existed in that 13th month of the recovery. The Real fed funds rates in the table are the nominal fed funds rate with the year-over-year PCE inflation rate subtracted from it. I look at the real fed funds rate average for two years before the recession starts. I also look at the average one year after the recession ends, and I look at the level of the real fed funds rate in the 13th month of recovery – paralleling the data harvest metrics on the PCE data in the table.
The answer is…drum roll please:
For a number of different reasons, I will not explore at this time, the Federal Reserve mis-analyzed the tensions in 2021 and waited way too long to raise rates in 2022. The question in front of us today is what does that mean for inflation in the future?
Given the inflation episodes we’ve seen in the past what do we learn from them that tells us how quickly the Fed will get control of inflation? I think what this exercise teaches us is that the answer to that question is completely and wholly up to the Fed.
The answer is that it depends on what the Fed does – The Fed can be aggressive and raise rates and knock the inflation rate down relatively quickly, or it can worry about the economy and it can worry about unemployment and it can worry about political backlash and it can take a longer time, in which case inflation expectations may become entrenched and in which case it may find that it is either politically or logistically unable to raise rates at the appropriate time and inflation will get further out of control again – and linger as it did before the 1980s.
Look at the real interest rate columns in the table. Look at the pink entries ahead of recession. In 1973, the real funds rate stood at 2.7%, in 1969 at 2.3%. In the aftermath of having had severe inflation, in the next 4 recessions the Fed had to keep the real funds rate much higher even going into recessionary episodes (4.6, 4.1, 2.7) but not in 2020.
The Fed really got in trouble in recessions over its willingness to keep rates high enough long enough. And you see that from the arrows on Chart 1 at the top of this paper. The real fed funds rate in the first year of recovery was negative in 1969 (-0.1) and negative in 1973 (-2.0). Contrast that to when the Fed was trying to squeeze inflation out of the system in 1981-82 when the real fed funds rate was 6.5% in 1980 and 3.8% in 1981 one year after the recession ended (of course, for the 1980 recession, that span includes part of the actual 1981 recession because the recovery from 1980 was so short).
But after the Fed gets inflation down to moderate levels, look at what happens to the real fed funds rate in the first year of recovery… After inflation becomes tamed, in 1992 in the first year of recovery inflation is at 1.7%; in 2001 it settled at zero; in 2007 it’s -1.2%. But that no longer describes our dilemma, does it? Inflation no longer is “too low.”
What is the Fed planning? Is the Fed waiting for Godot?
The Fed, in fact, has been telling us that it is expecting inflation to fall by itself for a while. You can see this in its dots. My article, “Roaring inflation dominates Fed policy and the outlook” (here), discusses this phenomenon. For our purposes here it’s not important to understand the “whys,” just the “what.” The Fed expects this to happen – inflation to fall by itself – and so the Fed is only moving the federal funds rate up part way and expecting inflation to fall the rest of the way. It expects the drop in inflation to be severe enough to put the federal funds rate in a position above the inflation rate. This curious “expectation” by the Fed is waiting for something to happen that never happened in the past. Yet it is the keystone of this policy regime…Policy would be much better off resting on actions that the bank controls than on a forecast that it hopes will be true.
The Fed’s plan – its “dots” projection – is below. It shows very little planned rise in the Fed funds rate from the end of 2022 to end 2023… yet it sees the real Fed funds rate (Fed funds deflated by either the core or headline PCE) rising in 2023! Why does that happen? It is not because of aggressive Fed tightening in 2023. The Fed does not raise rates much in 2023. Real Fed funds rise because the Fed FORECASTS and ASSUMES inflation will fall even though monetary policy is still simulative (Fed funds< PCE inflation). So, this is a warning…
Chart 2
The Fed’s ‘plan’
Fed Policy Dots (Federal Reserve System and FAO Economics)
What does history say about what the Fed has done so far?
Chart 3
Interest rate cycles: Feal Fed funds
Real rates in past rate hike cycles (Haver Analytics and FAO Economics)
This chart looks at the real Fed funds rate (Fed funds less the 12-month percentage change in the PCE). The chart tracks the level of the real Fed funds rate by month from the month before a nominal rate hike begins, historically. This chart is about rate cycles not recession cycles. Despite all the fuss about how fast Fed rate hikes have been, the real Fed funds rate lags behind where it would be at this point in any previous rate hike cycle, let be rephrase – LAGS BEHIND EVERY PREVIOUS RATE HIKE CYCLE- by a lot. It’s not even close. The Fed is hardly moving in a way to restrict growth and reduce inflation – its policies are heading in the right direction, but at a slow pace… and the Fed… is… way behind the curve…
Chart 4
Interest rate cycles: changes in Nominal fed funds
Speed of rate hikes historically (Haver Analytics and FAO Economics)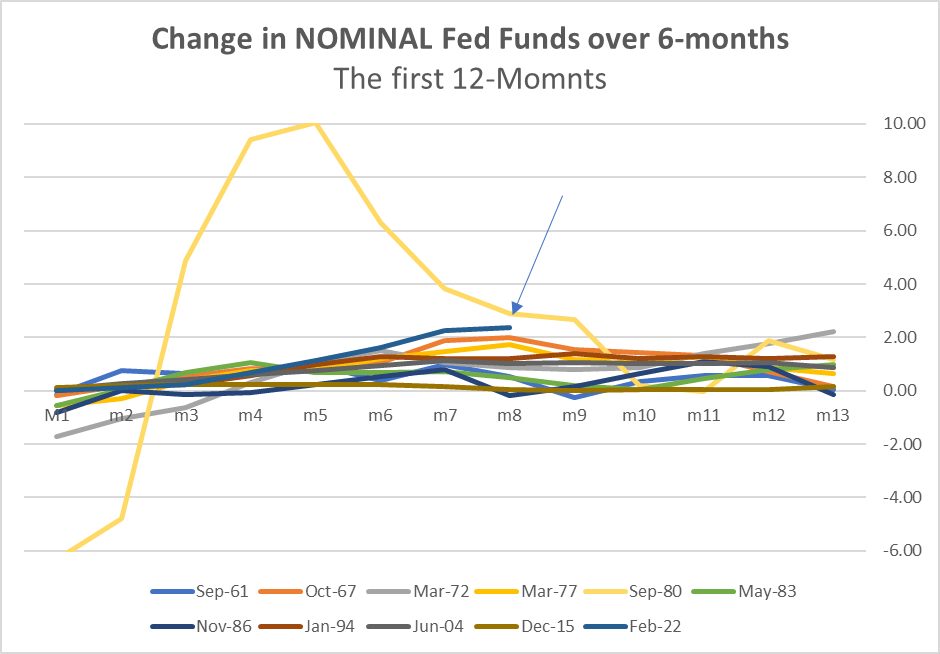
This chart compares rate hikes over six-month intervals, from the first rate hike in this cycle in past cycles. Here we see that the raw speed of the rate hikes in the current cycle has been fast but not a record, and that the speed is not that much faster than in several earlier episodes. The earlier chart makes it clear that fast and even faster rate hikes are required to get the real Fed funds rate up to a “normal” position in the current tightening cycle. If the Fed desires to fight inflation in a conventional manner that we can understand through the lens of history, it MUST continue to go fast and not pivot soon.
FYI: There is no example of this happening in any of the business cycles going back to 1970. If you are wondering if the Fed is waiting for Godot, get in line. If the Fed waits for too long and if the inflation rate does not drop on its own, that will become a policy mistake that is severe. Or inflation may fall part way to its (the Fed’s) goal and that may encourage the Fed to be somewhat less aggressive and to hope that inflation still will fall the rest of the way. These are just other ways that the Fed can make further policy mistakes to intensify inflation and drag out the inflation problem.
Forward “guidance” from the IMF? (or permission for the Fed?)
When I look at the IMF’s World Economic Outlook and what it has laid down as its base case for inflation, it seems to me that its base case is that the Fed is not going to be aggressive and it’s going to allow inflation to linger, and that by laying this down as its base case, the IMF has given the Fed the go ahead to do EXACTLY that, because if the Fed acts that way and that’s what happens, it will be exactly what was forecast – and nobody will think the Fed has made a mistake.
Will the Fed pivot take a large divot? (Fore!)
I won’t be a member of that club. I will call the Fed out on its mistake. I am doing it now to try to PREVENT THAT VERY MISTAKE right now. Because of the low yields on long-term U.S. Treasuries, it doesn’t look like the bond market is a member of the club that is prepared for more tightening, either, and that could mean if inflation does linger at high levels, the bond market is going to have a much rougher road ahead of it than what it expects right now. I see nothing from the Fed suggesting it is willing to get control of inflation faster rather than slower. The Fed is all about convincing us it will stamp inflation out…eventually.
So, my warning is two-fold: (1) it does not have to be that way; and, (2) but batten down the hatches because it will be that way. Mr. Powell is far more political in his schemes than Mr. Volcker. The Fed has come as close to its Volcker moment as it is going to get. Recession is coming and inflation is still going to linger; the Fed will make its second mistake, easing policy (stopping it tightening) too early on the belief that recession will reduce inflation by “enough.” Without the right interest rate policy, it won’t. History tells us that: see 1969 and 1973-75 if you have any doubts. The first recession was mild, the second severe, neither reduced inflation.
Be the first to comment