

M. Suhail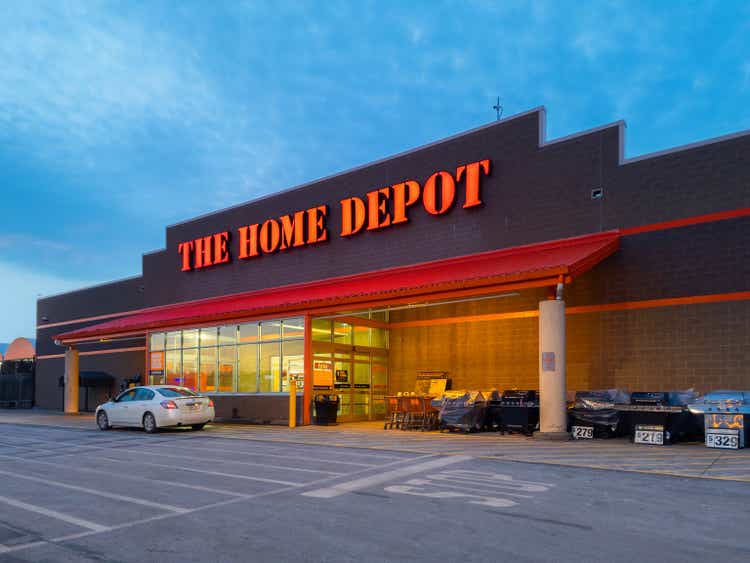
By Valuentum Analysts.
At Valuentum, we use discounted cash flow (DCF) analysis as the bedrock of our process. However, we also use relative valuation and technical and momentum indicators and blend that into an output called the Valuentum Buying Index (VBI) rating. We like to help members sort ideas in a systematic fashion so they can apply our work in any way that they would like. As shown in the flow chart below, we’ll show how The Home Depot, Inc. (NYSE:HD) registers a 3 on the VBI, as it garners a fairly valued perspective on our DCF process, a neutral view from a relative valuation basis, and bearish technical assessment. A pretty neat, process, with so much embedded in one number, no? Let us know in the comments below.
The flow chart shows how we derive a rating for each company. (Image; Valuentum)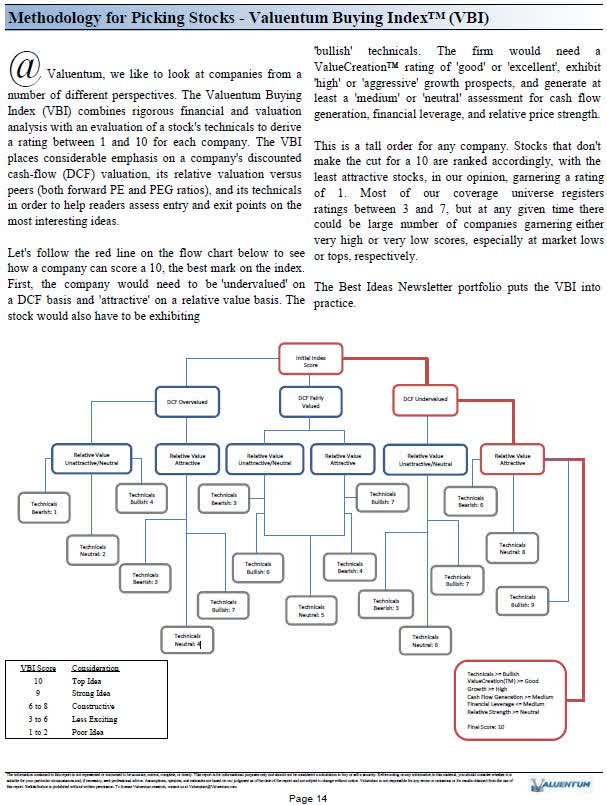
Let’s now talk Home Depot, in particular. One of the things that has amazed us about the company is that it continues to hold up regardless of what happens during the homebuilding cycle. Though the company faced some pressures during the Great Financial Crisis, it powered through tough times, and for that, we’ve been mighty impressed. It stands to reason that when home sales falter, consumers tend to stay at their existing homes longer and make renovations, and this plays into the hands of the home improvement retailers.
Furthermore, there are a number of trends such as stay-at-home parents doing more and more Do-It-Yourself projects, and then of course, COVID-19 has revealed that many need more living and working space, which is driving more demand. Home Depot has a lot of things going for it, in our view, and it has stood the test of time.
Home Depot’s Key Investment Considerations
Image Source: Valuentum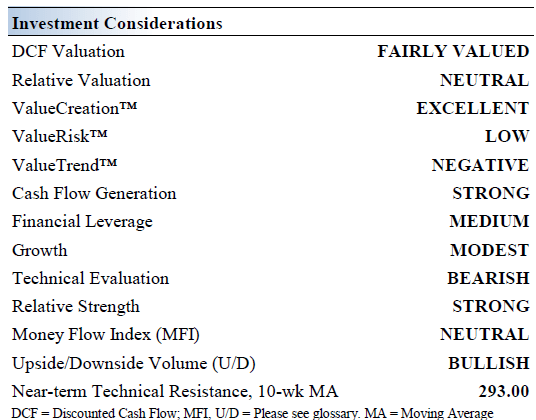
Home Depot is the world’s largest home improvement specialty retailer. Its stores sell an assortment of building materials, home improvement and lawn/garden products. Its stores average ~104,000 square feet of enclosed space, with ~24,000 additional square feet of outside garden area. The company was founded in 1978.
Though we’re big fans of the firm and we note that the company is extremely resilient during tough times, Home Depot’s financial performance still depends in part on the stability of the housing, residential construction, and home improvement markets. The outlook for new home construction activity in the U.S. has weakened significantly of late, and this is something that investors will have to keep a close eye on.
Image: Homebuyer mortgage payments on new homes have increased more than 50% since last year due to rising interest rates. We think this is a precursor to lower housing prices, which could have implications across the banking and financials sector. (Image Source: Redfin)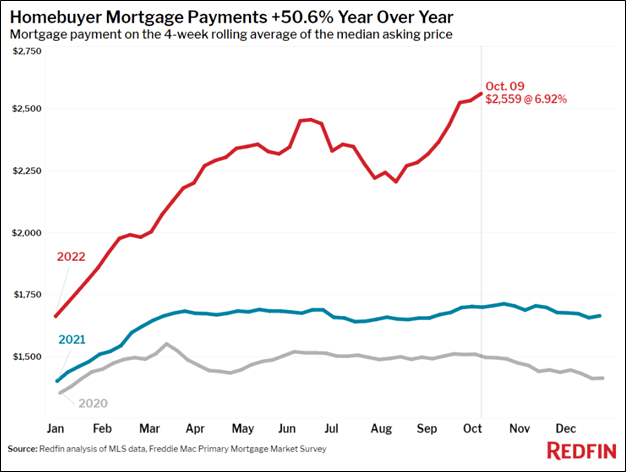
In December 2020, Home Depot acquired HD Supply through an ~$8.0 billion all-cash deal. This acquisition significantly grew Home Depot’s exposure to the maintenance, repair, and operations (“MRO”) space, a highly fragmented market that Home Depot estimates is worth ~$55 billion. Rising federal infrastructure investments support Home Depot’s outlook.
Home Depot serves three primary customer groups: Do-It-Yourself customers, Do-It-For-Me customers, and professional customers (tradesmen). Home Depot plans to focus more on its professional customers, where average tickets are substantially larger, with an eye towards growing its MRO business.
Home Depot significantly improved its omni-channel selling capabilities by integrating its evolving digital presence with its expansive physical operations. The firm has placed a great emphasis on further improving its e-commerce business to support sales growth.
Home Depot’s Dividend Health Evaluation
Dividend Cushion Cash Flow Bridge (Image Source: Valuentum)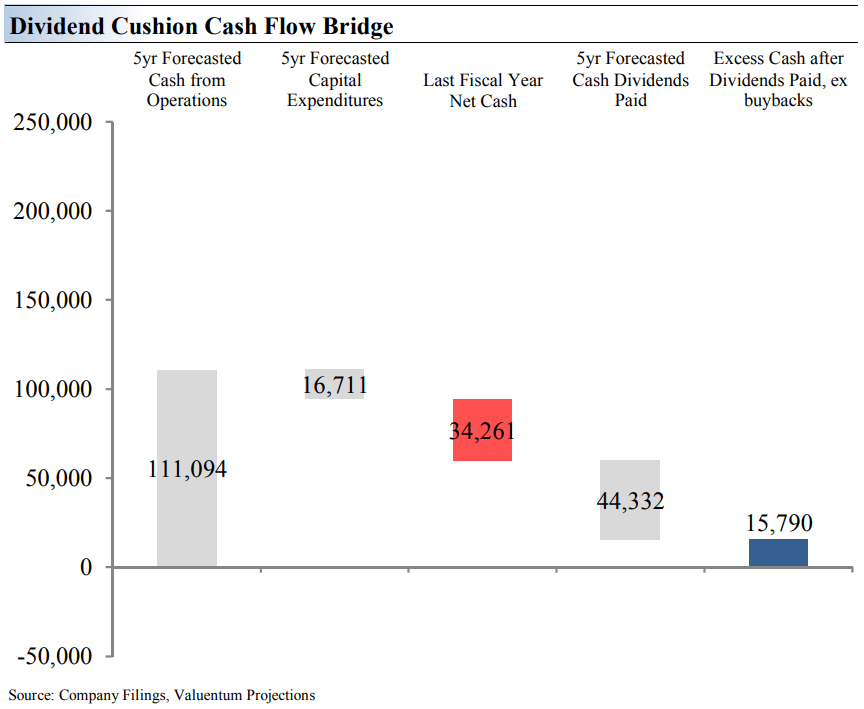
The Dividend Cushion Cash Flow Bridge, shown in the image above, illustrates the components of the Dividend Cushion ratio and highlights in detail the many drivers behind it. Home Depot’s Dividend Cushion Cash Flow Bridge reveals that the sum of the company’s 5-year cumulative free cash flow generation, as measured by cash flow from operations less all capital spending, plus its net cash/debt position on the balance sheet, as of the last fiscal year, is greater than the sum of the next 5 years of expected cash dividends paid.
Because the Dividend Cushion ratio is forward-looking and captures the trajectory of the company’s free cash flow generation and dividend growth, it reveals whether there will be a cash surplus or a cash shortfall at the end of the 5-year period, taking into consideration the leverage on the balance sheet, a key source of risk.
On a fundamental basis, we believe companies that have a strong net cash position on the balance sheet and are generating a significant amount of free cash flow are better able to pay and grow their dividend over time. Firms that are buried under a mountain of debt and do not sufficiently cover their dividend with free cash flow are more at risk of a dividend cut or a suspension of growth, all else equal, in our opinion. Generally speaking, the greater the “blue bar” to the right is in the positive, the more durable a company’s dividend, and the greater the “blue bar” to the right is in the negative, the less durable a company’s dividend. In Home Depot’s case, its dividend is looking pretty good.
Home Depot’s Economic Profit Analysis
The best measure of a company’s ability to create value for shareholders is expressed by comparing its return on invested capital (ROIC) with its weighted average cost of capital (WACC). The gap or difference between ROIC and WACC is called the firm’s economic profit spread. Home Depot’s 3-year historical return on invested capital (without goodwill) is 61.4%, which is above the estimate of its cost of capital of 8.7%.
As such, we assign the company a ValueCreation rating of EXCELLENT. In the chart below, we show the probable path of ROIC in the years ahead based on the estimated volatility of key drivers behind the measure. The solid grey line reflects the most likely outcome, in our opinion, and represents the scenario that results in our fair value estimate. Home Depot remains a strong economic profit generator.
Image Source: Valuentum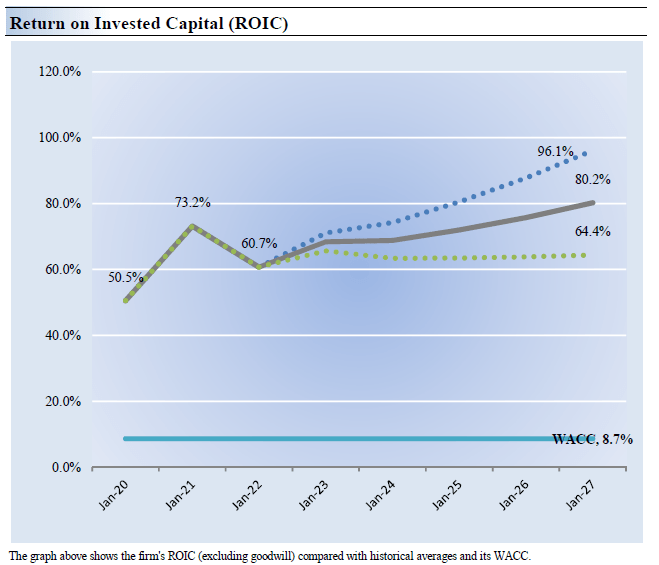
Home Depot’s Latest Quarterly Results
On August 16, Home Depot reported second-quarter earnings for fiscal 2022 (period ended July 31, 2022) that beat both consensus top- and bottom-line estimates. The home improvement retailer also reaffirmed its guidance for fiscal 2022 in conjunction with its latest earnings update.
In the fiscal second quarter, Home Depot reported that its customer transactions declined by 3.0% year-over-year. However, its strong pricing power saw its average ticket size grow 9.1% year-over-year resulting in its retail sales per square foot advancing by 5.7%, enabling its comparable sales to grow by 5.8% year-over-year last fiscal quarter. The company’s U.S. comparable sales were up 5.4% year-over-year last fiscal quarter. Sustained strength at its Do-It-Yourself customer base and rock-solid demand from its professional customer base were key here.
Home Depot’s GAAP revenues were up 7% year-over-year in the fiscal second quarter, reaching $43.8 billion. Its GAAP gross profit rose 6% year-over-year as its GAAP gross margin fell by ~15 basis points to hit 33.1% last fiscal quarter. Aided by economies of scale, Home Depot’s GAAP operating income rose 9% year-over-year last fiscal quarter as its GAAP operating margin rose ~30 basis points to reach 16.5%. The firm’s GAAP diluted EPS rose over 11% year-over-year in the fiscal second quarter to hit $5.05 as Home Depot benefited from nice net income growth and a sizable reduction in its outstanding diluted share count.
Overall, Home Depot put up tremendous performance last fiscal quarter, and we appreciate the retailer reaffirming its full-year guidance for fiscal 2022. This fiscal year, Home Depot is guiding for both its comparable and reported sales to grow by 3% on an annual basis, its operating margin to come in at 15.4%, and for its diluted EPS to grow in the mid-single-digit range on an annual basis. In relation to its fiscal second quarter performance, Home Depot appears to expect that exogenous factors (such as inflationary headwinds, supply chain hurdles, and rising labor costs) will weigh negatively on its performance in the second half of this fiscal year. With that in mind, Home Depot’s business is still holding up quite well.
As of July 31, Home Depot had a net debt load of $39.8 billion (inclusive of short-term debt) on the books along with sizable operating lease liabilities. We caution that its large net debt load is concerning, though given Home Depot’s stellar cash flow generating abilities, we view that burden as manageable. Home Depot generated $5.7 billion in free cash flow during the first half of fiscal 2022, even in the face of a $3.9 billion build in its working capital, while spending $3.9 billion covering its dividend obligations. The firm also spent $4.0 billion buying back its common stock during this period, and Home Depot’s share buyback programs are a key reason why its net debt load is large and steadily growing.
Home Depot’s Cash Flow Valuation Analysis
Image Source: Valuentum
On the basis of our DCF analysis, we think Home Depot is worth $302 per share with a fair value range of $242-$362. Shares of Home Depot are trading at ~$287 each. The margin of safety around our fair value estimate is driven by the firm’s LOW ValueRisk rating, which is derived from an evaluation of the historical volatility of key valuation drivers and a future assessment of them.
Our near-term operating forecasts, including revenue and earnings, do not differ much from consensus estimates or management guidance. Our model reflects a compound annual revenue growth rate of 3.8% during the next five years, a pace that is lower than the firm’s 3- year historical compound annual growth rate of 11.8%.
Our valuation model reflects a 5-year projected average operating margin of 15.6%, which is above Home Depot’s trailing 3- year average. Beyond year 5, we assume free cash flow will grow at an annual rate of 3.1% for the next 15 years and 3% in perpetuity. For Home Depot, we use a 8.7% weighted average cost of capital to discount future free cash flows.
Home Depot’s Margin of Safety Analysis
Image Source: Valuentum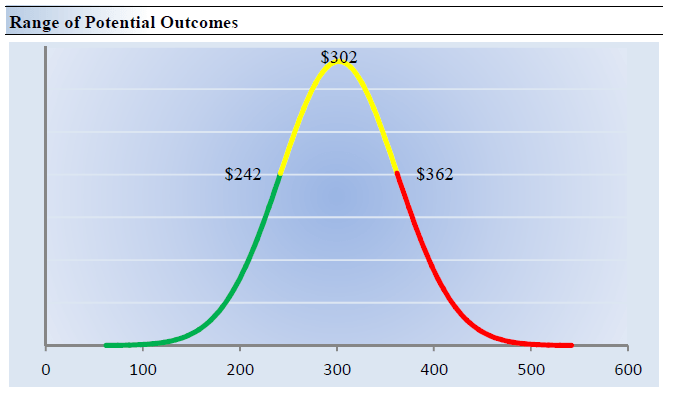
Our discounted cash flow process values each firm on the basis of the present value of all future free cash flows. Although we estimate Home Depot’s fair value at about $302 per share, every company has a range of probable fair values that’s created by the uncertainty of key valuation drivers (like future revenue or earnings, for example). After all, if the future were known with certainty, we wouldn’t see much volatility in the markets as stocks would trade precisely at their known fair values.
Our ValueRisk rating sets the margin of safety or the fair value range we assign to each stock. In the graph above, we show this probable range of fair values for Home Depot. We think the firm is attractive below $242 per share (the green line), but quite expensive above $362 per share (the red line). The prices that fall along the yellow line, which includes our fair value estimate, represent a reasonable valuation for the firm, in our opinion.
Concluding Thoughts
Home Depot’s performance over the past several fiscal years has been nothing short of impressive, and the home improvement market held up well during the COVID-19 pandemic. Home Depot acquired HD Supply through an all-cash deal worth ~$8 billion by enterprise value in December 2020, significantly bolstering its presence in the maintenance, repair, and operations (“MRO”) space. There is a lot to like about Home Depot, including its strong ~2.7% dividend yield, but its large net debt position weighs negatively against its Dividend Cushion ratio.
All things considered, however, Home Depot remains a stellar generator of free cash flow and should be able to keep a handle on that burden while continuing to grow its dividend going forward. We caution, of course, that share repurchases compete for capital against its dividend program, but these tend to be more discretionary than dividends.
The various digital initiatives Home Depot implemented during the past several fiscal years, such as integrating online orders with instore pickup fulfillment options to support its omni-channel selling capabilities, have gone a long way in supporting growth at its e-commerce business. Home Depot shares have modest upside relative to our point fair value estimate and considerable upside potential on the basis of the high end of our fair value estimate range.
Be the first to comment