Naypong/iStock via Getty Images
As my regulars know, I’m of the view that in the domain of investing, everything’s relative. For instance, in a world of limited capital, we have to judge the investment merits of company X against every other potential investment. We have to judge the investment merits of one asset class against every other available to us, and so on. Additionally, when we judge a company’s financial results, we do so against its own past. This is a helpful way to judge how the company’s doing, but it poses a challenge. Against which past do we judge the company? There’s a risk that the most recent past is atypical as a result of the influence of a global pandemic to pick a factor at random. With that as a preamble, it’s time to write about Big 5 Sporting Goods Corporation (NASDAQ:BGFV). The shares have been absolutely crushed since I bought more three months ago, down ~25% against a loss of ~3.6% for the S&P 500.
The company’s just reported earnings, and it’s time to write about that. I want to work out whether or not it makes sense to buy more, hold, or take my lumps and drive on. I’ll review the latest financials, and will look at the valuation. Additionally, I’m still short the January 2023 puts with a strike of $8. In case you don’t have your almanac of my trades handy, I’ll let you know that I sold them for $.90 each. These deserve commentary also.
In case you missed the title of this article, and somehow skimmed past the bullet points above, I’ll make the point as succinctly as possible. So far, the financial results have been terrible relative to 2021. The issue for me is that this says less about 2022 than it does 2021, because the latter is far more anomalous than the former. For instance, revenue and profitability during the first six months of 2022 are quite good relative to 2017, 2018, and 2019. Thus, it seems a bit excessive to get too despondent about forecasts of a slowdown relative to 2021. The problem for me is the fact that while the shares are “cheaper” than they have been in a while, they’re not objectively cheap. Relative to the pre-pandemic period, valuations remain high, and the dividend yield remains relatively low. Thus, I won’t be adding to my position out of respect for trying to be disciplined about my position sizing. If you’re just coming to this position now, I think it makes sense to buy a few hundred shares, as I think the dividend is reasonably well covered. Finally, I should point out that the puts I wrote in March have done well in spite of the fact that shares have collapsed in price. This is yet another example that demonstrates the risk-reducing, yield-enhancing potential of these instruments.
Financial Snapshot
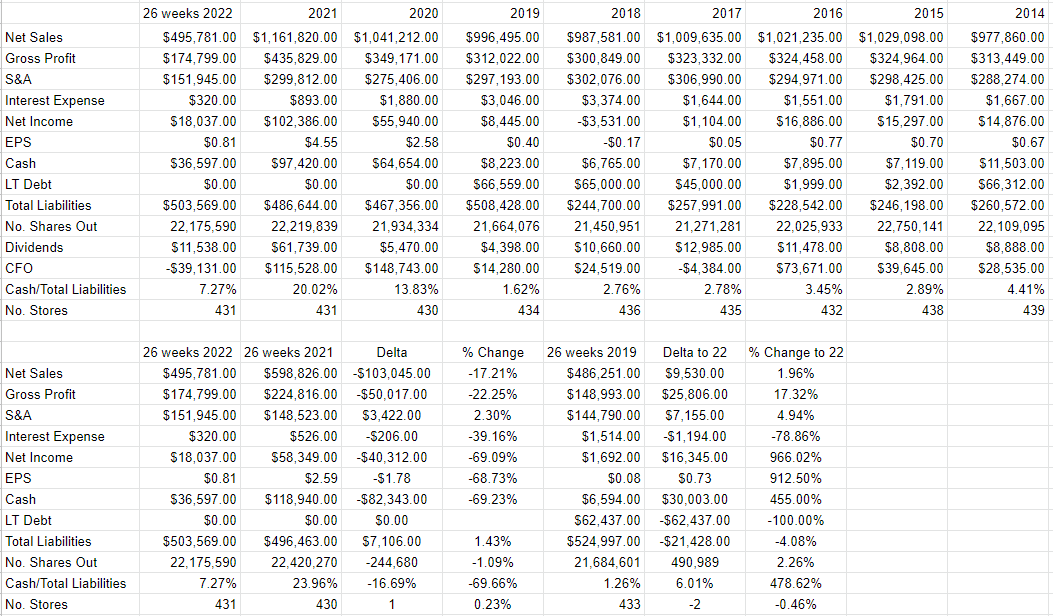
Depending on how you measure it, relative to the same period in 2021, the most recent financial results could be described as somewhere between “catastrophic” and “disastrous.” For instance, the top and bottom lines are down by 17.2% and 69% respectively, while sales and administrative expenses barely budged, up 2.3%. You can’t blame this performance on store count either, as there is 1 more store today than there was in 2021. Additionally, the company’s capital structure has deteriorated, with cash down by about $82.3 million or 69% relative to the same period last year. Add to this the fact that the company itself isn’t expecting an end to the pain, forecasting a “high-single-digit decline” in same-store sales from the same period a year ago. If 2021 were a typical year, you’d think that the best course of action at this point would be to take my lumps and sell.
You probably know where I’m going with this. At this point, it’s time to change the context a little bit. If 2021 were a typical year, then it would make sense to describe 2022 so far as “bad.” When we expand our horizons a bit we grow to understand that 2022 is far less the outlier than is 2021. For example, 2022’s revenue is about 2% higher than 2019s, and net income is higher by about $16.35 million. Additionally, the capital structure is much cleaner now than it was in 2019, given that all of the $62.4 million in long-term debt has been paid down. The result of this is that the interest expense has collapsed from that period to this, down fully 79%.
In case you’re worried that I’m picking an easy comparison year, fret no longer. Relative to the same period in 2018, 2022’s revenue and net income are up by 4.5% and have swung from a loss of $1.557 million in 2018 to profit of $18 million. The capital structure improvement is also in evidence, with total debt moving from $90.6 million to $0. When we compare the first 26 weeks of 2022 to the same period in 2017, the same theme emerges: 2022 isn’t the anomaly, 2021 is. Specifically, revenue for the first 26 weeks of 2022 was basically identical to the same period in 2017, and net income was up dramatically from $8.1 million in 2017 to $18 million in 2022.
This tells me that 2022 isn’t the anomaly that it at first appears. In fact, if the most recent period was anomalous, it was positively so, given the very atypical strength in the capital structure. For that reason, I’m not too “freaked out” by the financial results. My concern was and is the sustainability of the dividend.
To work out the sustainability of the dividend, we must turn to the cash flow statement. So far this year, the company has paid down about $17 million of accrued expenses, had $16 million fewer accounts payable, and spent about $58 million on inventories. Note that this inventory investment brings levels back to what’s more typical. The result of this is that the cash from operations for the period was a negative $39.1 million. This is part of the reason why cash has collapsed so dramatically in 2022. While this negative cash from operations is large, we should remember that the company typically generates much more cash from operations in the back half of the year. For instance, for the first 26 weeks of 2017, 2018, and 2019 respectively, cash from operations was $-19.4 million, $-21.9 million, and $5.6 million respectively. By contrast, cash from operations for the full years ended 2017, 2018, and 2019 were $15 million, $46.4 million, and $8.7 million respectively. So, I think it’s reasonable to suppose that cash flows will improve over the next half year.
During the first 26 weeks of the year, the company spent about $11.5 million on dividends. They currently have about $36.6 million in cash on hand, and they typically generate more cash in the back half of the year. All of this suggests to me that the company has sufficient resources to maintain the dividend at the current level. I’d be willing to buy more if the shares are cheap relative to their history and to the overall market.
Big 5 Sporting Goods Corporation Financials (Big 5 Sporting Goods Investor Relations)
The Stock
I’m about to tread over very old ground. If you subject yourself to my stuff regularly for some reason, you know that I think the stock is distinct from the business in many ways. I’m about to elaborate on that idea yet again, so, strap yourselves in, I guess. Anyway, it’s not too controversial to point out that a business buys a number of inputs, like sporting equipment, adds value to them, and then sells the results at a profit. The stock, on the other hand, is a traded instrument that reflects the crowd’s aggregate belief about the long-term prospects for the company. It seems that the crowd changes its views about the company relatively frequently which is what drives the share price up and down. The crowd may come to a view after fixating on performance relative to some very unrepresentative period, for instance. Added to that is the so-called “systemic” volatility induced by the crowd’s views about stocks in general. “Stocks” become more or less attractive, and the shares of a given company get taken along for the ride. Although it’s tedious to see your favorite investment get buffeted because the asset class of “stock” goes in and out of favor, within this tedium lies opportunity. If we can spot discrepancies between the crowd’s driven price and likely future results, we’ll do well over time. It’s typically the case that the lower the price paid for a given stock, the greater the investor’s future returns. In order to buy at these cheap prices, you need to buy when the crowd is feeling particularly down in the dumps about a given name. As I start to write about the Big 5 stock, I’m confident that the crowd has driven the stock to a very cheap price.
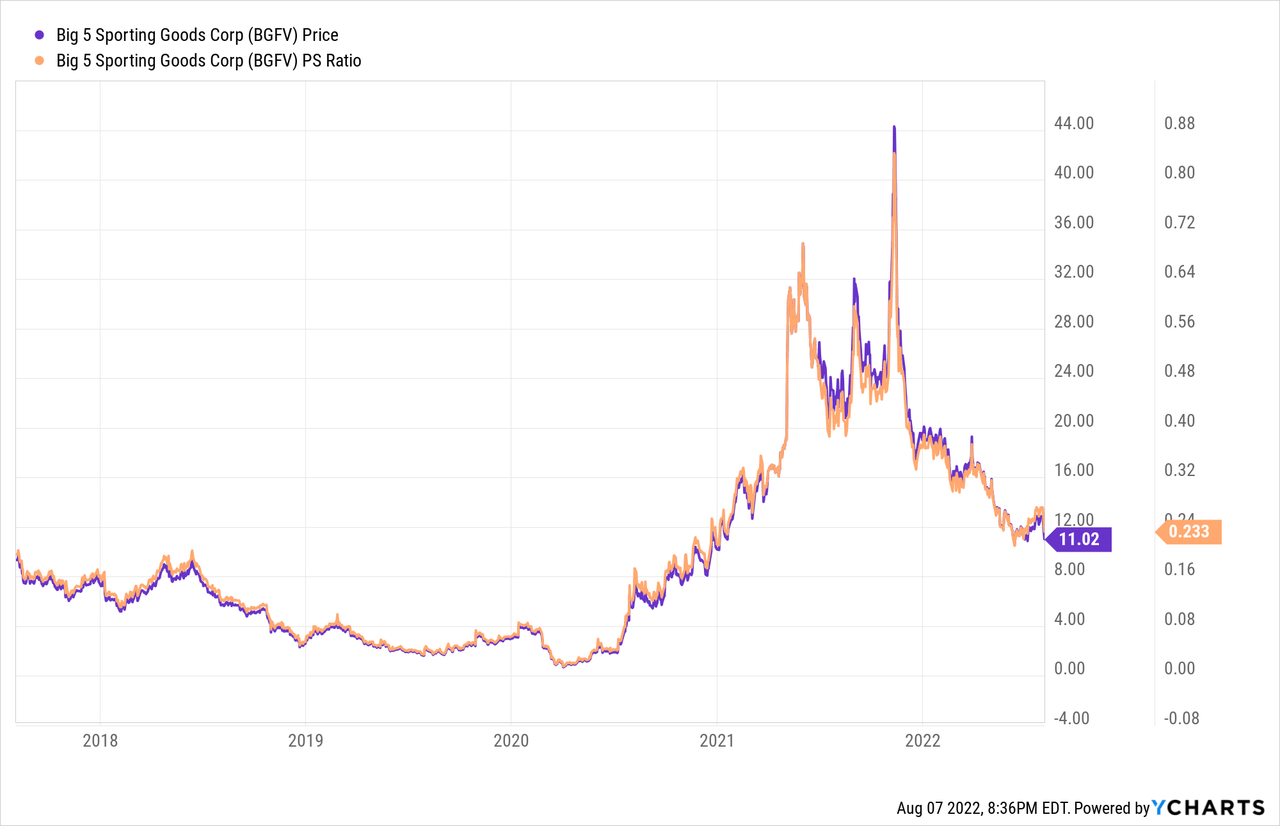
As my regulars know, I measure the relative cheapness of a stock in a few ways ranging from the simple to the more complex. On the simple side, I like to look at the ratio of price to some measure of economic value, like earnings, sales, free cash, and the like. Once again, cheaper wins. I want to see a company trading at a discount to both the overall market, and the company’s own history. With that as a preamble, please have a look at the following:
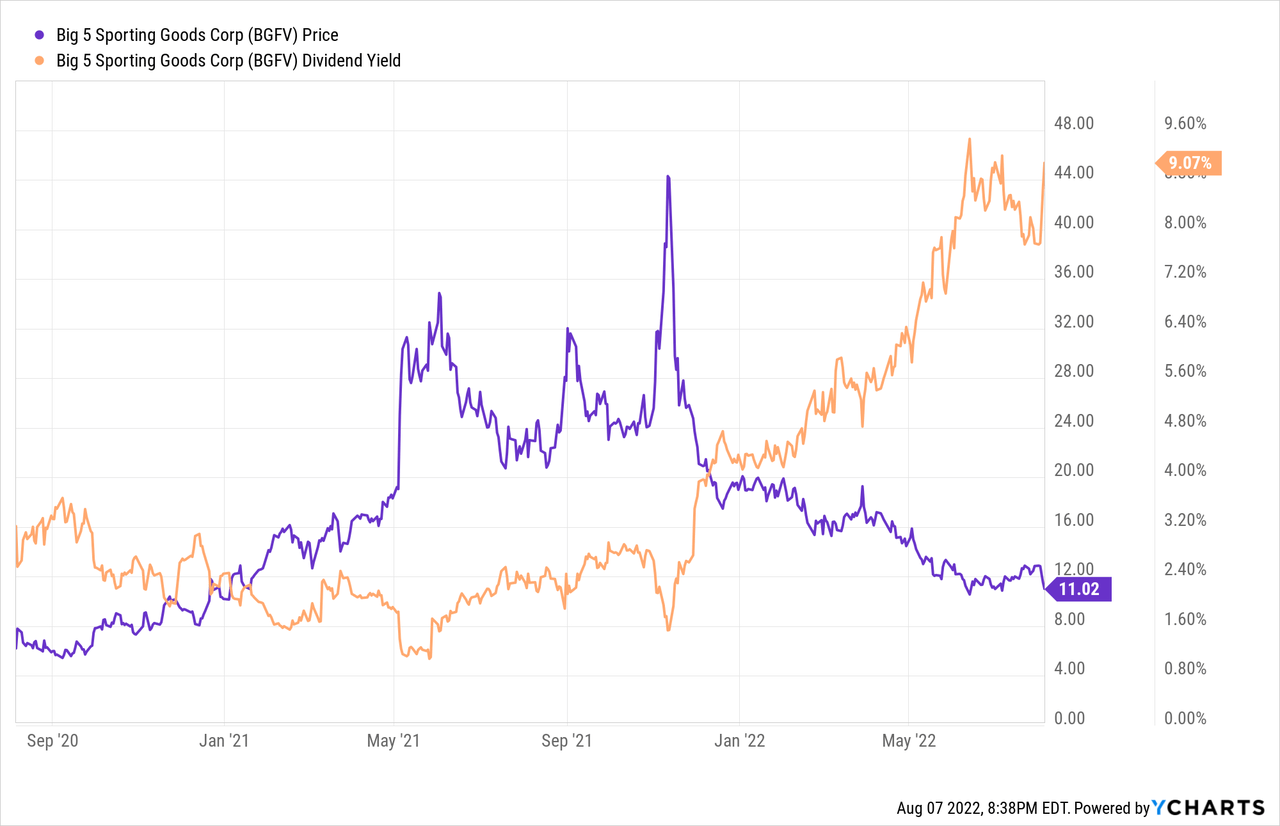
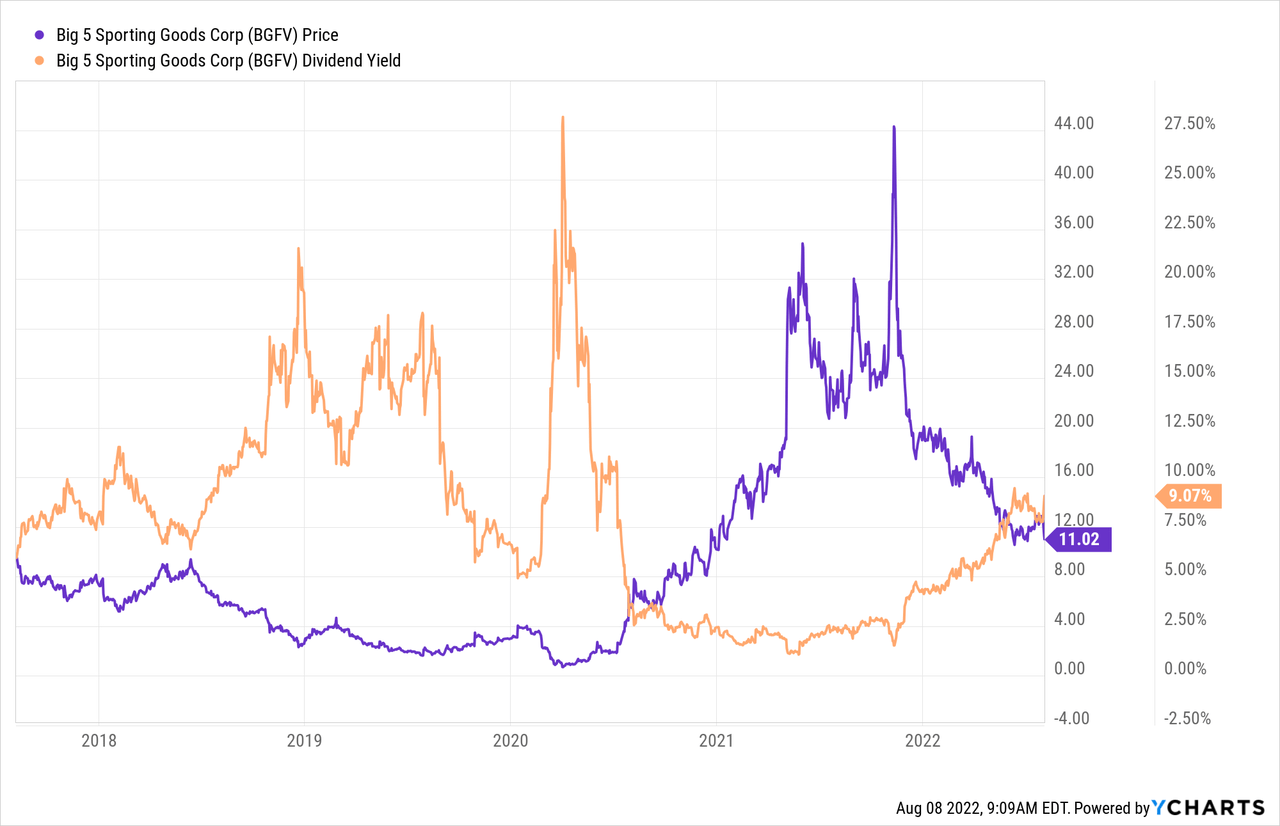
Although the shares are quite cheap relative to any time over the past year, they’re not cheap by historical standards. I’ll admit that the company is much improved relative to when they were carrying tens of millions in debt, but the shares are expensive relative to that period, too. So, the shares are cheap relative to the overall market, but they’re not cheap relative to their own past. The same can be written about the dividend. Even if we strip out the spike in early 2020, the yield is currently higher than it was anytime over the past couple of years.
But it’s hardly at a multi-year high.
Taking all of the above into account, and the fact that I’m reasonably confident about the dividend sustainability, I’ll neither sell nor add to my position.
Options Update
You may recall that in March of this year, I sold 10 January 2023 Big 5 puts with a strike of $8 for $.90 each. In case you forgot, I sold 10 January 2023 Big 5 puts with a strike of $8 for $.90 each. While the shares have obviously dropped precipitously in price over the past year, these puts have held up rather well, having last traded hands at $.66. Perhaps this is an indication that the options market is of the view that the shares won’t drop to $8. Perhaps it’s an indication of the illiquidity of options of this type. Whatever the reason, in spite of a 32.5% drop in price since I wrote these, the puts have lost about 27% of their value. This is yet another example of the risk-reducing, yield-enhancing potential of short put options. Although I won’t be writing any more puts at the moment, I think it’s helpful to write about this example as it’s instructive. When you sell puts, it’s quite possible to do reasonably well, even if the shares drop precipitously in price. They are often great risk-reducing tools.
Conclusion
The recent drop in price is obviously painful, but I think it’s a bit overdone. The market seems to be fretting about how business is slowing down relative to 2021, as if that year’s a reasonable frame. A review of the record indicates that the first half of the year has actually been relatively strong and that the company is in better financial shape than it has been for most of the past half-decade at least. For that reason, I’m not going to sell. That written, the shares are not cheap relative to most of the past half-decade either. Thus, neither will I add to my position. If someone’s just coming to this investment today, I’d recommend buying a few hundred shares, as I doubt they’ll get much cheaper. If you’ve already got a position, there comes a point where risk management and portfolio construction take precedence. If you own shares, it’s likely not worth adding to this position.


Be the first to comment