

David Gyung/iStock via Getty Images
Idle Plants, AI, and High Tariffs
The combined effects of declining capacity utilization in the United States and globally, the inherently deflationary power of artificial intelligence (AI), the Federal Reserve’s deliberate monetary restraint, and the liquidity-draining impact of tariffs will serve to impede economic growth and decrease inflation through 2025 and beyond.
Idle Plants
Contrary to the current conventional wisdom, plant capacity utilization has declined again this year in the U.S., the EU, and China. This trend has persisted since the 2021–22 period. A weighted index of these economies, plus Japan and the U.K., reflects this decline (Table 1). Many factories, refineries, mines, and mills now sit with more idle capacity or operate at low utilization rates.
U.S. and Global Capacity Utilization
|
Peak |
Latest |
% Change |
||
|
1. |
2. |
3. |
||
|
1. |
U.S. |
81.1 |
77.4 |
-4.6% |
|
2. |
Euro Area |
82.9 |
77.8 |
-6.2% |
|
3. |
China |
77.9 |
74.0 |
-5.0% |
|
4. |
Global Aggregate |
79.1 |
74.8 |
-5.4% |
Source: Federal Reserve, European Commission, Haver Analytics, Ministry of Economy, Trade & Industry, Piper Sandler. Global aggregate includes Japan and U.K.
Table1
Construction of homes, offices, apartments, and other structures has also contracted. The goods-producing sector is not as large of a contributor to economic activity as it was in the past, but it still plays a critical role. As of August 2025, goods-producing employment was less than 20% the size of private service-providing employment. However, the workweek in the goods-producing sector was 20% longer, and average hourly earnings were 2.8% higher. This resulted in a far greater contribution to personal income per person in the goods-producing sector than in the private service sector. Thus, the historical and theoretical work on plant capacity utilization as a precursor of economic cycles remains highly relevant in this new era.
Capacity Utilization
Economists have long tracked capacity utilization. Thomas Malthus (1766-1834) was among the first to write about overcapacity and its effects, while later economists Wesley Clair Mitchell (1874-1948) and Arthur F. Burns (1904- 1987) developed data series linking capacity utilization to business cycles in their influential book Measuring Business Cycles, (published in 1946).
Polish-born economist Michał Kalecki (1899–1970) was arguably the first to place capacity utilization at the center of business cycle theory. Cambridge Economist Joan Robinson (1903–1983) argued that, in free market economies, investment is driven by expected demand. This makes capacity utilization—not just technology or saving—central to growth dynamics. She expanded this concept into growth models, which were further developed by others. This is the critical reason why tax incentives for physical investment may be slow to have an effect, and why a capital expenditure boom for 2026 is unlikely. This is true even with the favorable new expensing features in the tax code.
Drawing from these and later contributors, economists generally agree that persistently low levels of capacity utilization should raise concern about the sustainability of the business cycle for several reasons:
- Reduced productivity growth – equipment and infrastructure that sit idle contribute nothing to output, slowing the growth of overall efficiency.
- An impediment to capital formation – firms with idle machinery and buildings do not expand capacity. This depresses new investment spending. Sunk costs of underutilized assets play a critical role in this decision.
- Labor market pressures – idle plants often lead to layoffs, reduced hours, and weaker demand for local suppliers, amplifying cyclical downturns.
- Profit compression – excess capacity prompts firms to engage in price-cutting to cover fixed costs, which squeezes profits.
- Financial stress – companies struggle to service debt tied to unused assets, which raises the risk of bankruptcies and nonperforming loans in the banking system.
- Downward price pressures – when demand is weak relative to potential supply, firms cut prices or restrain wage growth, pushing the economy toward disinflation or deflation.
Combining AI and Tariffs Into the Base Model
AI – Different From Prior Innovations
AI should be understood as an evolutionary innovation with a uniquely broad impact: in aggregate, it will reduce—not increase—the factors of production (the demand for labor, natural resources, and capital). This contrasts sharply with earlier innovations that raised demand across these inputs. The result aligns with the perspective advanced in Robert J. Gordon’s The Rise and Fall of American Growth: The U.S. Standard of Living Since the Civil War (2016).
Gordon found that the great American economic growth era of 1870 to 1970 was driven by five inventions: electricity, modern communications, the internal combustion engine, urban sanitation, and pharmaceuticals and chemicals. These increased the use of the factors of production because they were revolutionary rather than evolutionary innovations. As a result, the AI innovation, being an evolutionary change, will boost economic growth less than past innovations.
The expansion of AI-related industries directly boosts productivity in digital sectors by shifting demand away from traditional, capital-intensive production methods. Already, the outlines of such an outcome have begun to appear. From February through August this year, total industrial production (IP) remained unchanged, with a small decline in the last two months. IP data does not sufficiently isolate AI production. However, AI sectors appear to be offsetting declines throughout the other industrial sectors. As a result, the distinct impact of AI has both masked and intensified underutilization in legacy industries, such as manufacturing and heavy industry.
AI is rendering entire sections of the economy, such as call centers and data entry operations, obsolete. In contrast to previous waves of technology, AI’s broad efficiency improvements decrease demand for physical building materials and machinery, thereby reducing the multiplier effect on the broader economy, even as AI is expected to lead to expansion in many new sectors. This unique form of capital displacement further depresses utilization rates and new investment in legacy sectors.
AI decreases labor demand by automating cognitive and repetitive tasks across a wide range of service sector skills. Prior automation mainly affected routine factory roles, but AI goes further. Traditionally, new graduates gained experience through tasks such as data collection and analysis. Now, AI can do these tasks quickly, sharply reducing the need for junior staff. One AI- enabled employee now replaces several people, resulting in fewer hiring needs. AI also enables firms to automate mid-skill roles, thereby pushing down salaries and shifting choices from people to software. This did not happen in prior technology waves. Reports indicate that college graduates already face lower demand because AI can handle advanced tasks. This results in slower hiring, weaker wage growth, and reduced bargaining power for workers without irreplaceable skills.
This fundamental change results in a shift in corporate income relative to household income. At the same time, it creates a disinflationary or even deflationary environment. Automation and protective policies are reshaping legacy business cycles.
Throughout history, many promising ideas or innovations have drawn substantial investments. In the early stages, investors often saw big gains. Examples include the financial bubbles of the 18th century and the dot-com mania of the late 20th century. As in those cases, returns were insufficient to justify the massive funds committed. While it is still uncertain if this will happen again, a repetition of this pattern could lead to the construction of far more plant capacity than is needed, which would then remain unused and intensify the typical boom-and-bust cycle of these industries.
Tariffs and Retaliation
When a country raises tariffs and its trading partners retaliate, a process is begun which reduces liquidity. After retaliation, several internal shocks to liquidity follow. A profit squeeze immediately affects those involved in international trade as total revenues fall. Demand falls in micro markets, and prices of goods also drop since internationally traded goods are highly price elastic.
Producers respond by cutting demand for labor, natural resources, and capital. This causes a shock to these factors of production, which then reduces their own spending. As the current account deficits shrink, international capital flows also fall. This results in a sharp decline in liquidity. In the 1920s and 1930s, central banks failed to offset this loss. The downward trend persisted until 1939, when World War II began.
Monetary Restraint
On September 23, Fed Chair Powell stated that the Federal Reserve’s interest rate stance is “still modestly restrictive” after the September rate cut. This restrictive stance has international implications as can be seen in Real World Dollar Liquidity (RWDL) reaching a post-COVID low in August (thick blue line, Chart 1). All of the RWDL increases resulting from the pandemic have been reversed. In the past year, RWDL decreased by 8% (thin line, Chart 1), compared to an average annual increase of 5.8% since 1976. In this more restrictive environment, the Fed’s policy accelerates overcapacity in legacy industries that still make up a significant portion of household income and jobs. Heavy investment flows into AI has shifted financial resources away from legacy industries. Over the last twelve months, commercial bank lending remained unchanged, after excluding loans to non-depository financial institutions, the most highly leveraged entities on the balance sheet. The skew in bank lending, rising bankruptcies to multi-year highs, falling credit scores, and increasing delinquencies all suggest that household and small business liquidity is becoming increasingly scarce.
Chart 1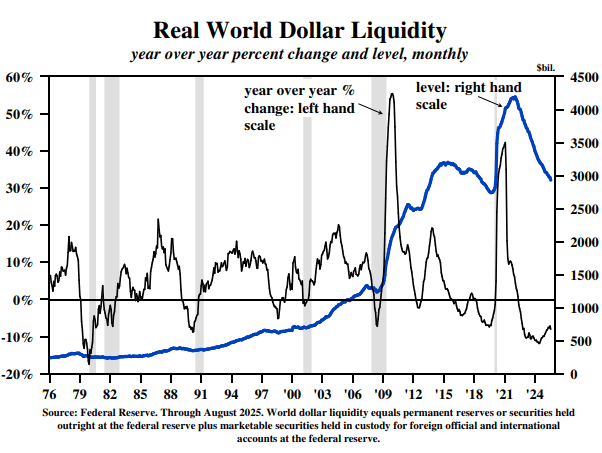
Gross Output
This year, the monthly situation report of the BLS has deteriorated to such an extent that virtually all of the modest increase in payroll jobs is in the low-paying health and social services category. At the same time, real GDP has remained resolutely strong.
The issue is how to resolve this discrepancy. The answer is provided by a statistic called Gross Output (GO) – a measure of spending at all stages of production. Developed by economist Mark Skousen, the Bureau of Economic Analysis now publishes GO in the final revision of the quarterly National Income and Product Accounts. In the first quarter, real GO was $40.9 trillion, 72% more than real GDP. In stark contrast to real GDP, the two-quarter moving average growth in real GO decelerated steadily and significantly after 2022, dropping to a paltry less than 1% annual rate of growth in the first half of this year (Chart 2). Thus, GO and the job statistics are strongly aligned with the well-established model of falling plant capacity utilization and the likely impact of AI and tariffs. Real GO is additional confirmation that economic conditions are weaker than generally believed.
Chart 2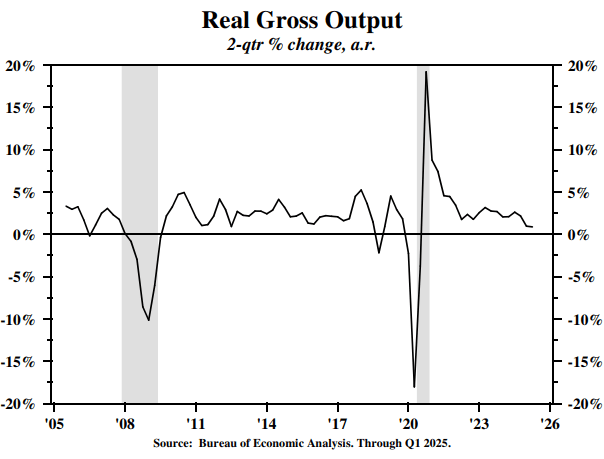
Concluding Thoughts
Short-term policy rates have declined in the U.S., the EU, and other important countries. Additional rate reductions are also generally expected in the financial markets. These actions, however, are likely to be insufficient as long as RWDL continues to contract. Thus, the Fed policy is a persistent headwind for economic growth. We remain committed to a long-duration strategy for U.S. Treasury bonds, despite many investors remaining extremely pessimistic about the outlook for these securities.
Van R. Hoisington | Lacy H. Hunt, Ph.D.
|
DISCLOSURES Hoisington Investment Management Company (HIMCo) is a federally registered investment adviser located in Austin, Texas, and is not affiliated with any parent company. The information in this market commentary is intended for financial professionals, institutional investors, and consultants only. Retail investors or the general public should speak with their financial representative. Information presented is for educational purposes only and does not constitute an offer or solicitation for the sale or purchase of any securities, investment products or advisory services. Information herein has been obtained from sources believed to be reliable, but HIMCo does not warrant its completeness or accuracy; opinions and estimates constitute our judgment as of this date and are subject to change without notice. This memorandum expresses the views of the authors as of the date indicated and such views are subject to change without notice. HIMCo has no duty or obligation to update the information contained herein. This material is intended as market commentary only and should not be used for any other purposes, including making investment decisions. Certain information contained herein concerning economic data is based on or derived from information provided by independent third-party sources. Charts and graphs provided herein are for illustrative purposes only. This memorandum, including the information contained herein, may not be copied, reproduced, republished, or posted in whole or in part, in any form without the prior written consent of HIMCo. |
Editor’s Note: The summary bullets for this article were chosen by Seeking Alpha editors.
Be the first to comment