

HeliRy/E+ via Getty Images
Introduction
U.S.-based independent oil and gas producer Hess Corporation (NYSE:HES) released its fourth-quarter 2022 and FY2022 results on January 25, 2023.
Important note: This article is an update of my article published on November 28, 2022. I have followed HES on Seeking Alpha since 2017.
1 – 4Q22 Results Summary
1.1 – 4Q22 results
HES reported an adjusted fourth-quarter 2022 earnings per share of $1.78, beating analysts’ expectations again this quarter. It compared with $0.85 per share a year ago.
The quarterly revenues were $3,054 million from $2,255 million last year. The strong quarterly results were due to higher oil and natural gas price realizations and higher production, mainly from Guyana.
Production, including Libya, was 386K Boepd in 4Q22. Production from Guyana reached 116K Boepd this quarter. Net cash provided by operating activities was $1,252 million in the fourth quarter of 2022, up from $899 million in the fourth quarter of 2021.
Cash and cash equivalents, excluding the Midstream segment, were $2.486 billion on December 31, 2022.
The midstream business generated adjusted net earnings of $64 million in 4Q22, down from $74 million a year ago.
HES completed the sale of the Corporation’s interest in Libya for net proceeds of $150 million.
Finally, HES repurchased $350 million worth of shares in 4Q22.
1.2 – Guyana and Suriname
On October 26, 2022, Hess Corp. announced its 8th and 9th discoveries in the Stabroek block called Yarrow-1 and Sailfin-1. These two discoveries add to the previous gross discovered recoverable resource estimate for the Block of approximately 11 billion BOE.
On January 26, 2023, Exxon Mobil (XOM) made a new significant discovery at the Fangtooth SE-1 well on the Stabroek block.
This total of 31 discoveries, with two phases producing 360K Boepd gross (30% for HES). The company expects achieving first oil with its third phase, called Payara, in late 2023.
Four sanctioned Guyana developments have breakeven prices of $25- $35/BBL Brent. Two phases are producing and two with the first oil in late 2023 and 2025, respectively.
The construction of a new FPSO is progressing. The fifth phase, called Uaru, has been submitted to the Government of Guyana for approval in the fourth quarter. The Uaru phase is expected to have a capacity of approximately 250K gross Boepd (75K Boepd net for HES), with the first oil anticipated at the end of 2026.
A few months ago, Japan’s MODEC secured a FEED contract for Uaru FPSO. The firm will design and construct this FPSO based on its M350 newbuild design, which will be able to produce 250,000 barrels of oil per day, will have an associated gas treatment capacity of 540 million cubic feet per day, and a water injection capacity of 350,000 barrels per day.
HES Four phases Presentation FPSOs (HES previous presentation)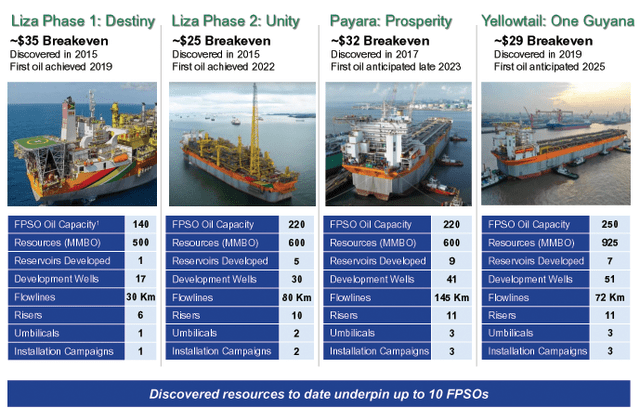
CEO John Hess said in the conference call:
Key to our strategy is Guyana, which is home to the Stabroek Block, one of the largest oil provinces discovered in the world over the last 20 years, where Hess has a 30% interest and ExxonMobil is the operator.
Furthermore, in Suriname, HES (33.33%) and Shell (SHEL, OTCPK:RYDAF) recently drilled the Zanderij-1 well in Block 42, located north of the TTE/APA block 58. On October 27, 2022, Hess stated that:
The well demonstrated a working petroleum system. Well results are being evaluated and further exploration activities are under consideration. The well was drilled with Noble 12,000-ft drillship Maersk Voyager.
1.3 – The Bakken
Oil and gas production from Bakken is still the leading segment for HES, with 158K Boepd produced in 4Q22. The company’s only onshore asset represents 40.9% of the total output.
In December, production in 4Q22 was affected by unplanned production shut-ins caused by severe winter weather. Also, HES added a fourth drilling rig in July 2022, drilled 19 wells, completed 14 wells, and brought 15 new wells online during the fourth quarter.
1.4 – Offshore productions from the Gulf of Mexico and Southeast Asia
Net production from the Gulf of Mexico was 35K boepd, and net production at North Malay Basin and JDA was 67K boepd in the fourth quarter of 2022.
HES 4Q22 Oil Equivalent Production (Fun Trading)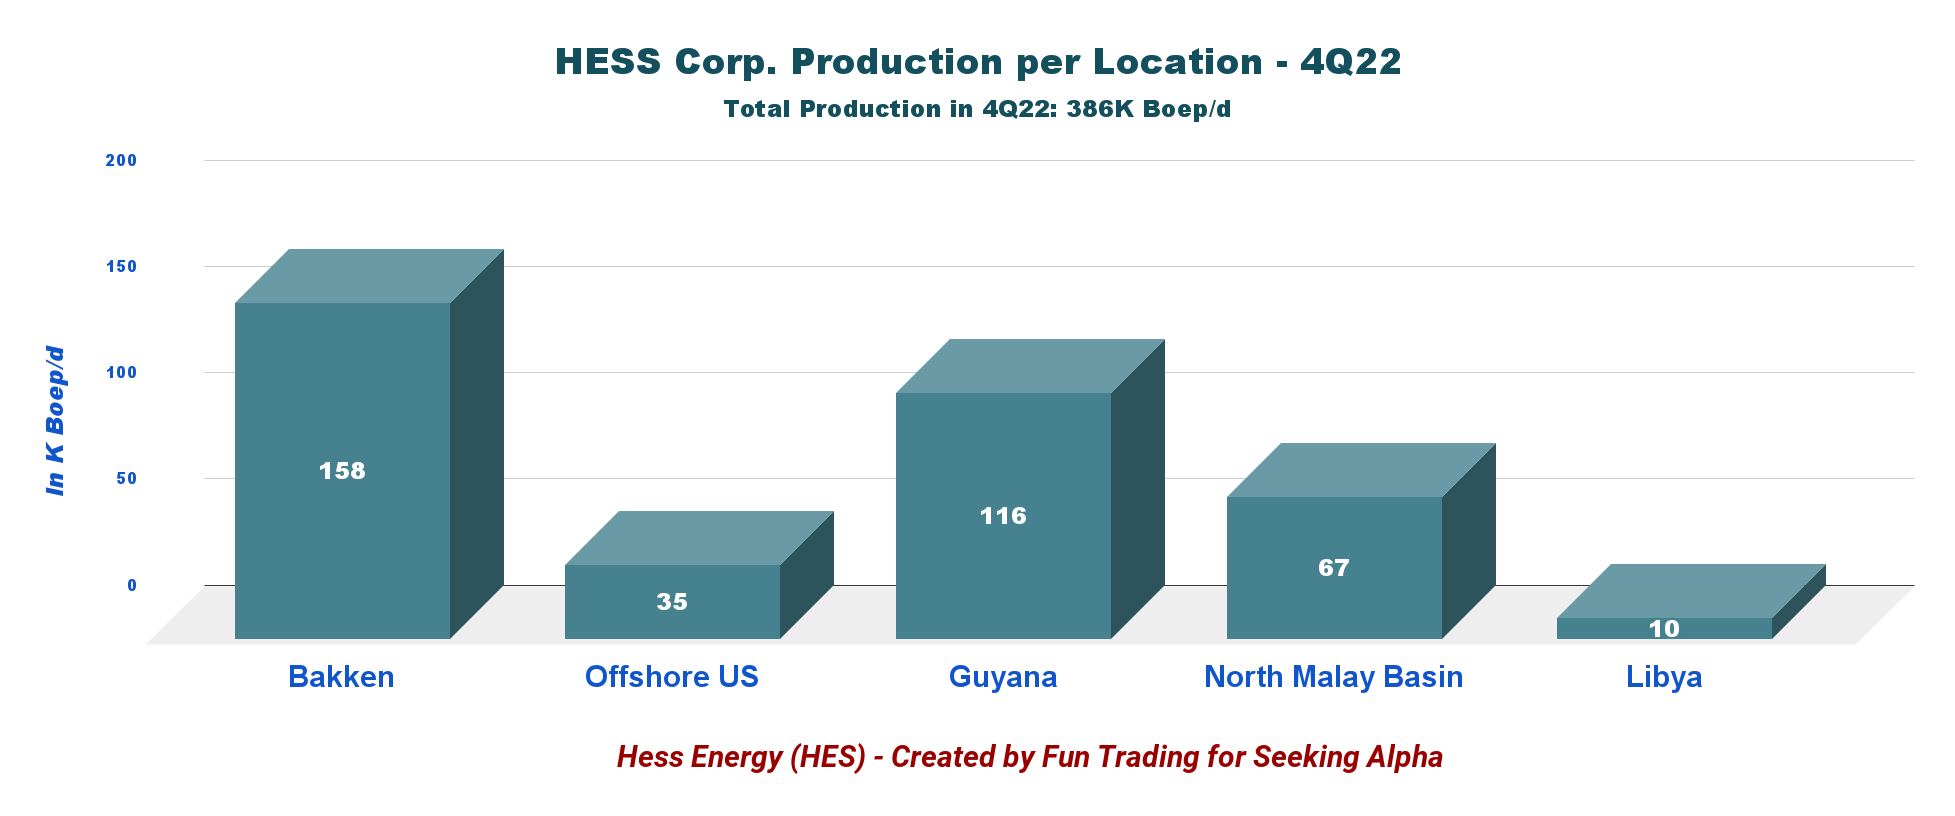
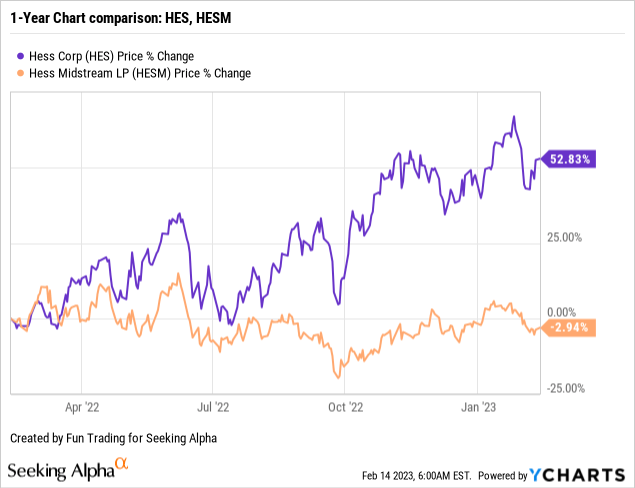
2 – Stock Performance
HES has done very well on a one-year basis. The stock is now up 53%, whereas HESM is lagging behind its peers, with a loss of 3% on a one-year basis.
Hess Corp. Balance Sheet history and Trend until 4Q22 – The Raw Numbers
| Hess Energy | 4Q21 | 1Q22 | 2Q22 | 3Q22 | 4Q22 |
| Total Revenues and others in $ Billion | 2.26 | 2.37 | 2.99 | 3.16 | 3.05 |
| Net income available to common in $ Million | 265 | 417 | 667 | 515 | 624 |
| EBITDA $ Million | 1,087 | 1,162 | 1,594 | 1,484 | 1,637 |
| EPS diluted in $/share | 0.85 | 1.34 | 2.15 | 1.67 | 1.78 |
| Cash from operations in $ Million | 899 | -156 | 1,509 | 1,339 | 1,252 |
| Quarterly CapEx in $ Million | 509 | 546 | 663 | 723 | 793 |
| Free Cash Flow in $ Million | 390 | -702 | 846 | 616 | 459 |
| Cash and cash equivalent $ Billion | 2.71 | 1.37 | 2.16 | 2.38 | 2.49 |
| Long-term debt (consolidated) in $ Billion | 8.46 | 7.96 | 8.33 | 8.30 | 8.28 |
| Dividend per share in $ | 0.25 | 0.375 | 0.375 | 0.375 | 0.375 |
| Shares outstanding (diluted) in Million | 308.3 | 308.9 | 311.26 | 308.90 | 308.31 |
| Oil Production | 4Q21 | 1Q22 | 2Q22 | 3Q22 | 4Q22 |
| Oil Equivalent Production in K Boepd (incl. Libya) | 316 | 297 | 322 | 368 | 386 |
| Global liquids price ($/b) | 71.04 | 86.75 | 99.16 | 85.32 | 83.50 |
| Global Natural gas price ($/M Btu) |
4.77 |
5.28 |
6.45 |
5.85 |
5.17 |
Source: Company material
Analysis: Revenues, Generic Free Cash Flow, and Oil and Gas Production Worldwide
1 – Quarterly total revenues were $2,934 million in 4Q22
HES Quarterly Revenues history (Fun Trading)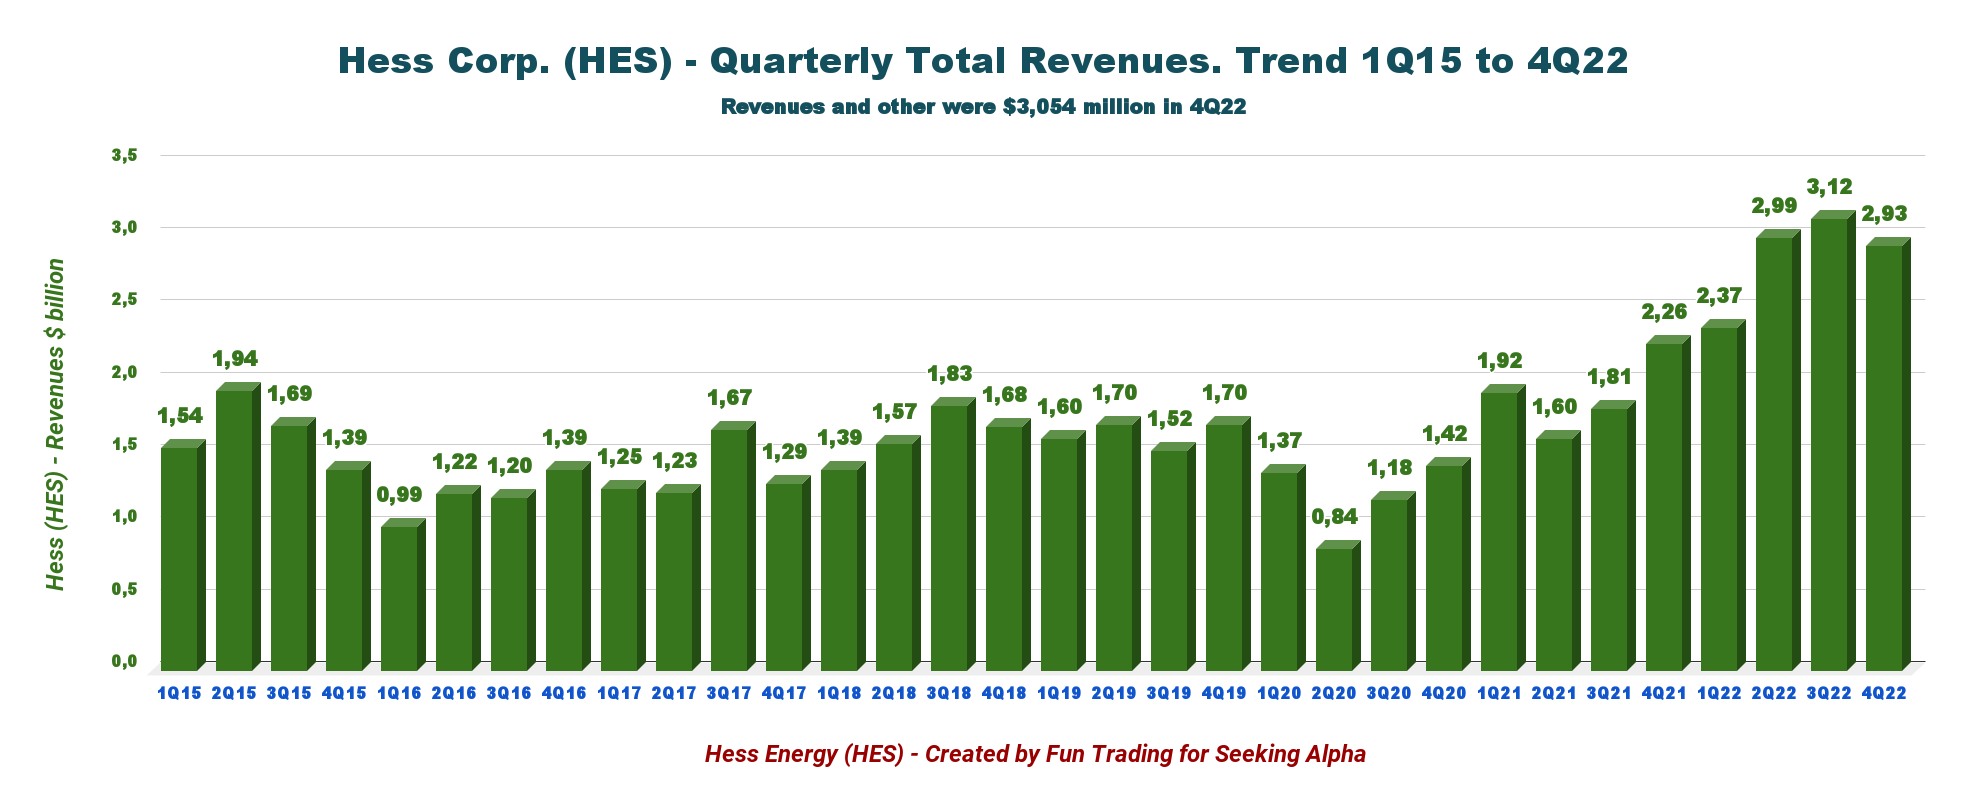
Hess’ oil revenues increased to $2,934 million in the fourth quarter of 2022 from $2,237 million in the same quarter a year ago. Total revenues were $3,054 million.
The quarterly income was $624 million or $1.78 per diluted share, compared to $0.85 per diluted share in 4Q21.
The adjusted net income was $548 million or $1.78 per share compared with an adjusted net income of $265 million in the prior-year quarter.
Operating expenses for 4Q22 were $385 million compared with $316 million last year.
The midstream business generated adjusted net earnings of $64 million, down from $74 million a year ago.
2 – Free cash flow (not including divestiture) and net debt
HES Quarterly Free cash flow history (Fun Trading)
Note: The generic free cash flow is the cash flow from operation minus the CapEx.
HES’s trailing 12-month free cash flow jumped sequentially to $1,219 million, with a free cash flow of $459 million in 4Q22, up from 4Q21 of $390 million.
The company declared a quarterly dividend of $0.375 per share this quarter.
HES repurchased approximately 2.3 million shares for $310 million in 4Q22, bringing total share repurchases in 2022 to $650 million at an average price of roughly $120 per share.
3 – Net Debt and Cash on Hand
HES Quarterly Cash versus Debt history (Fun Trading)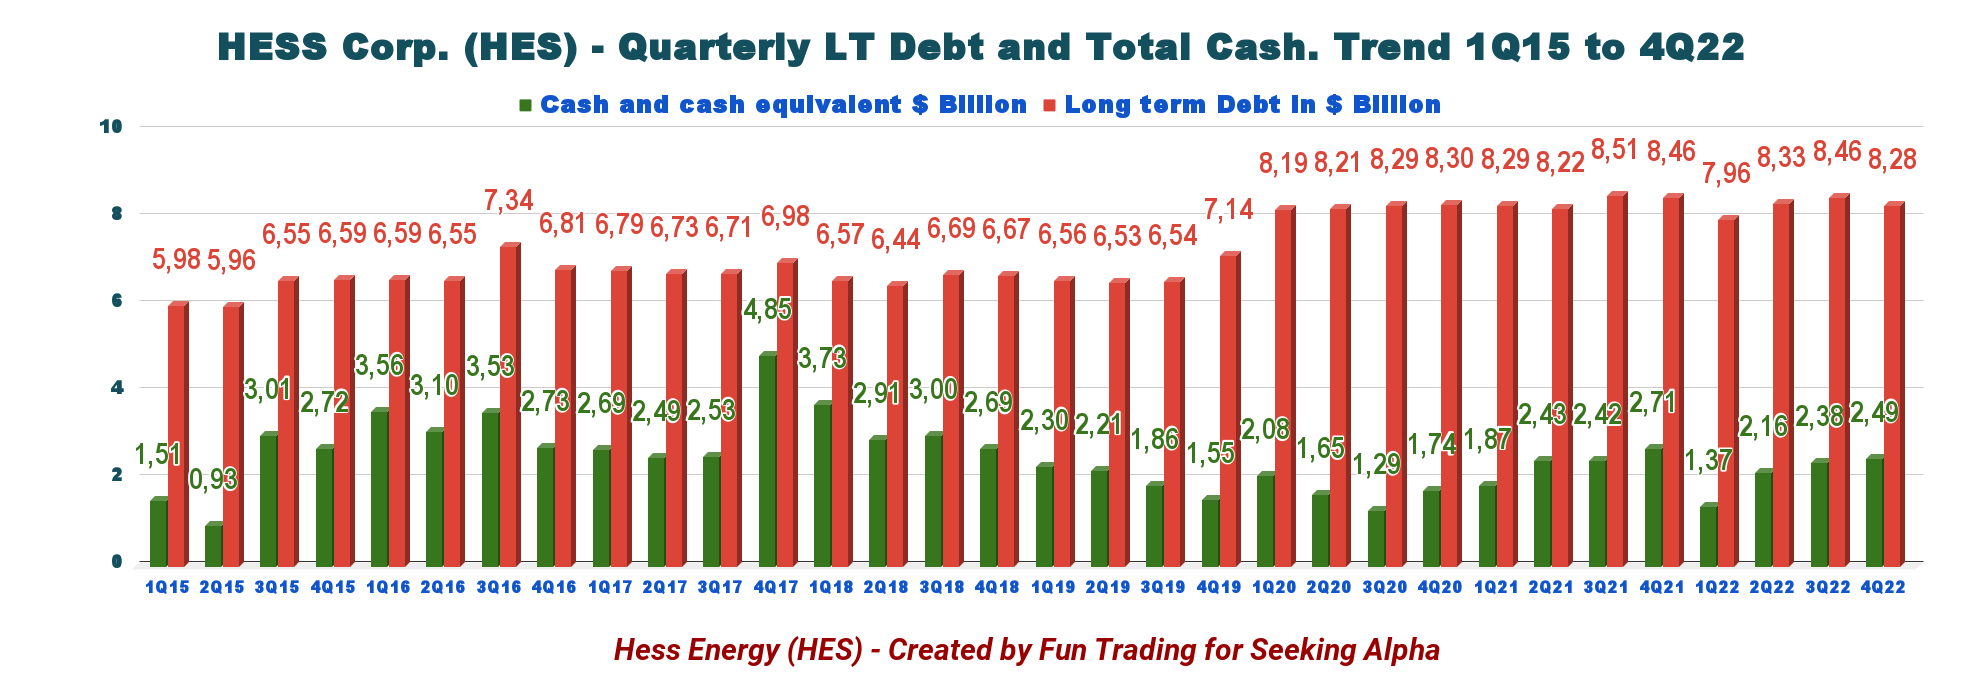
As of December 31, 2022, the company had $2,486 million in cash & cash equivalents, down 8.4% from the previous year.
E&P Debt (non-GAAP) was $5.395 billion. Its long-term debt (consolidated) was $8,281 million. HES had no current maturity of the long-term debt this quarter.
The Midstream segment had cash and cash equivalents of $3 million and total debt of $2.886 billion on December 31, 2022. HES owns approximately 41% of HESM on a consolidated basis.
Note: I believe the company is not doing a great job at cutting its debt load while it can and should focus more on this issue by potentially postponing the share buyback program.
4 – Quarterly production analysis
4.1 – Production
HES Quarterly Oil equivalent production history (Fun Trading)
HES produced 386K net Boepd in 4Q22 (including Libya). It was up from 316K Boepd the same quarter a year ago, with contributions from resources in the Bakken of 158K Boepd this quarter and a jump in production in Guyana to 116K Boepd.
On November 15, 2022, Hess Corp. announced that it had completed the sale of its 8.16% interest in the Waha Concession in Libya in equal shares to TotalEnergies (TTE) and ConocoPhillips (COP). During the 4Q22, production from the Waha concession was 10K Boepd.
As I said earlier, the Bakken production is the company’s primary production. It supports the business while ramping up Guyana, which will take many years and a significant CapEx. However, Guyana went from 31K Boepd in 4Q21 to 116K Boepd.
Note: Bakken is expected to produce ~200K Boepd net production in 2024+.
Crude oil represents 59.1% of the total output.
HES Quarterly production of oil, NGL, and NG in 4Q22 (Fun Trading)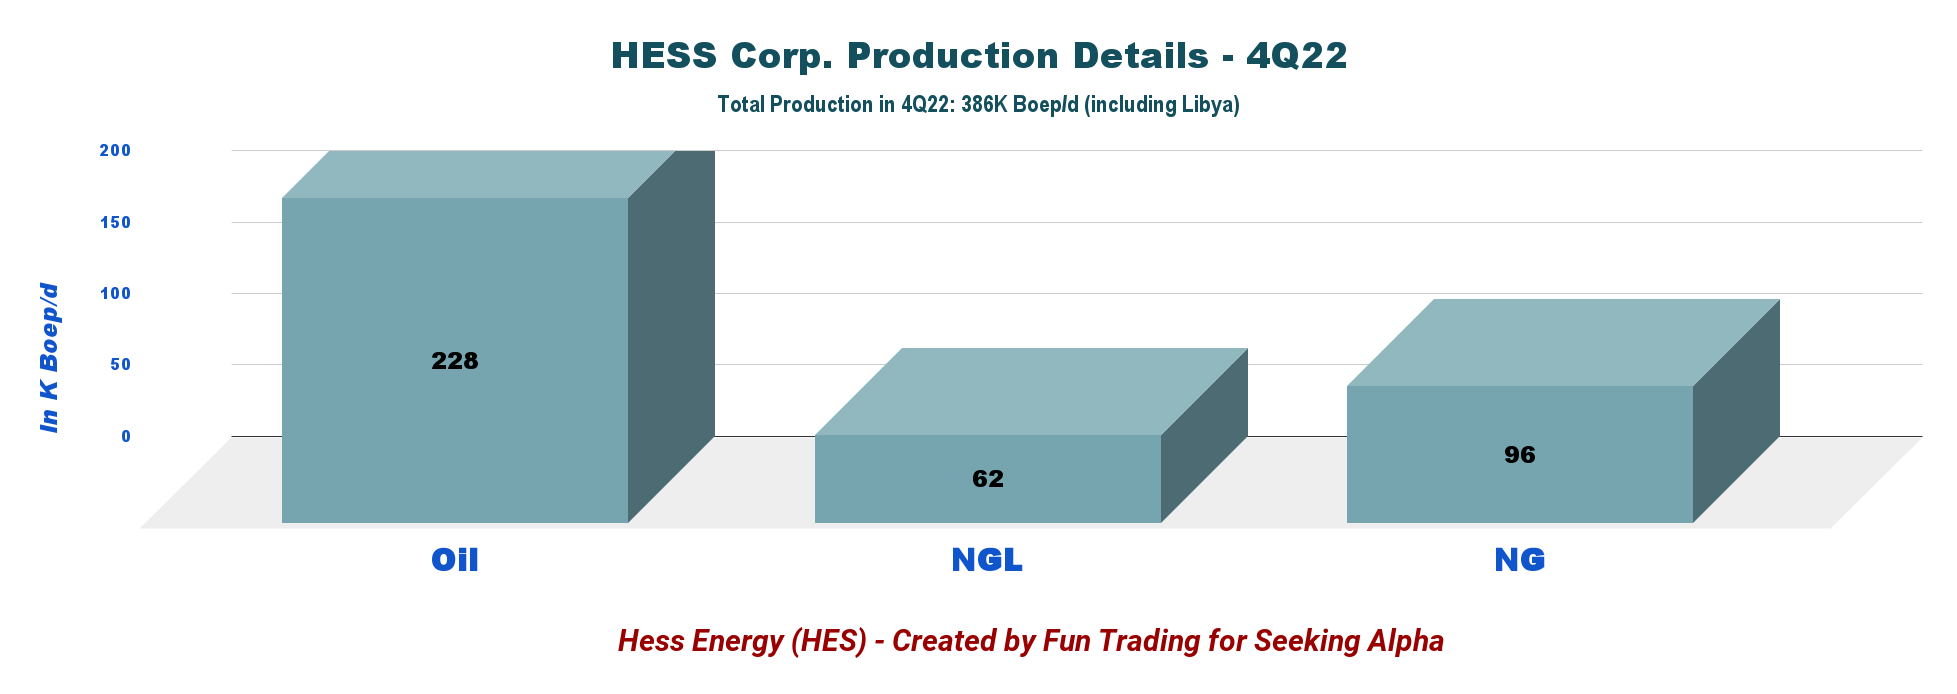
Crude oil output was 228K Boepd in the fourth quarter of 2022, up from 158K Boepd a year ago. Further, natural gas liquids production totaled 62K Bbls/d, and natural gas output was 96K Boepd.
4.2 – Oil and Natural gas prices
Below are the historical trends of global liquid prices and NG prices.
HES Quarterly Oil and Gas prices history (Fun Trading)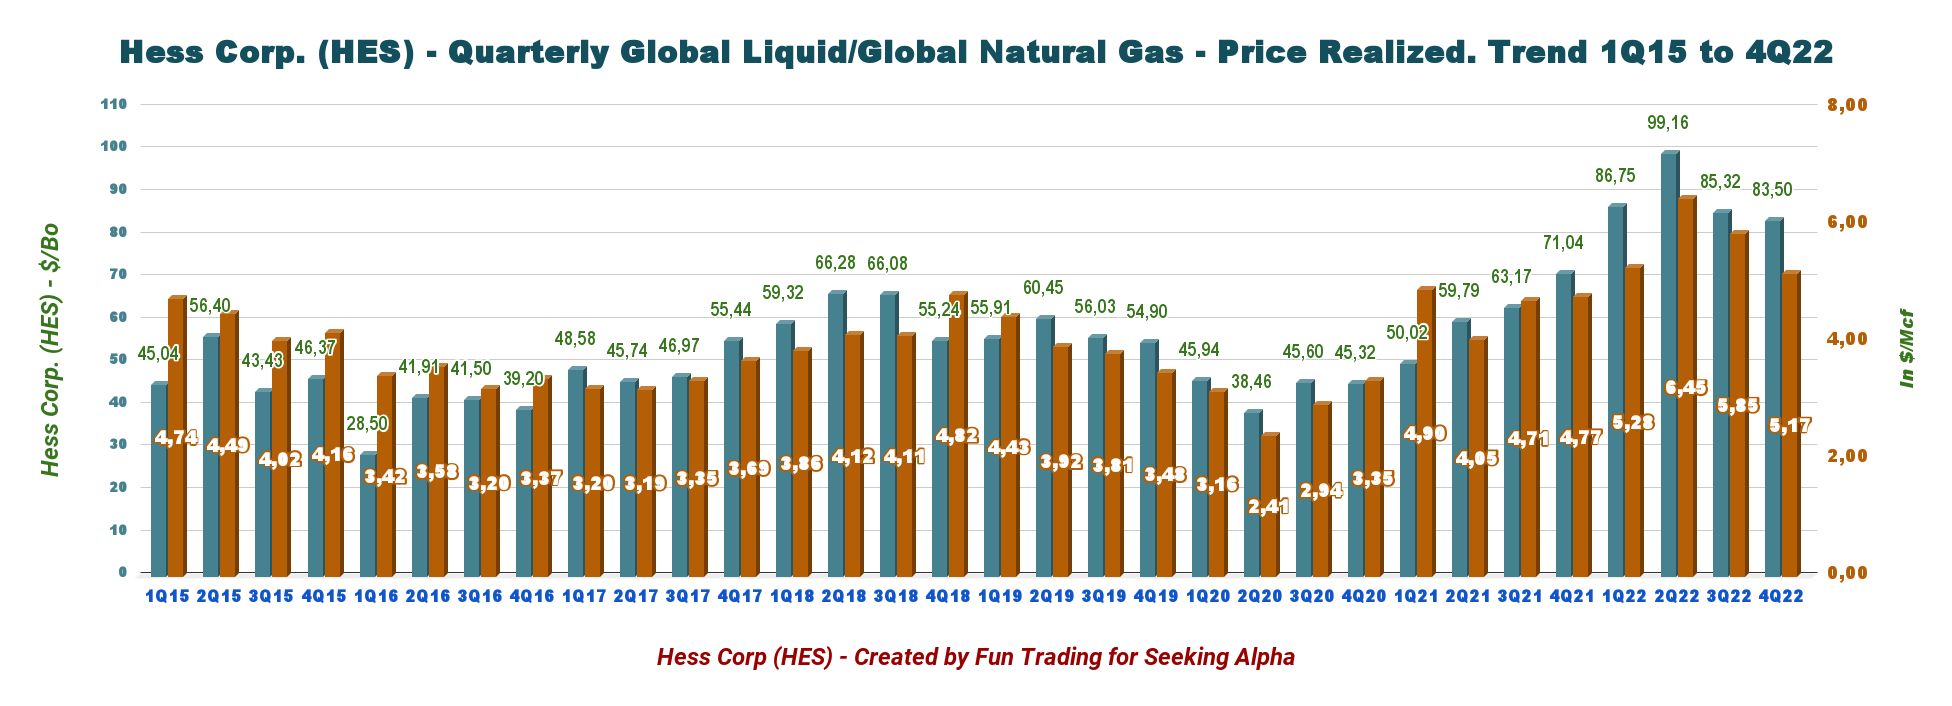
- Worldwide crude oil realization per barrel of $83.50 (excluding hedging) significantly increased from $75.22 in the year-ago period.
- Worldwide natural gas prices rose to $5.17 per Mcf from $4.77 last year.
- Worldwide natural gas liquids’ prices declined to $26.93 per barrel from $36.47 a year ago.
4.3 – 2022 and 4Q22 Guidance revised
HES 2023 Guidance (HES Presentation)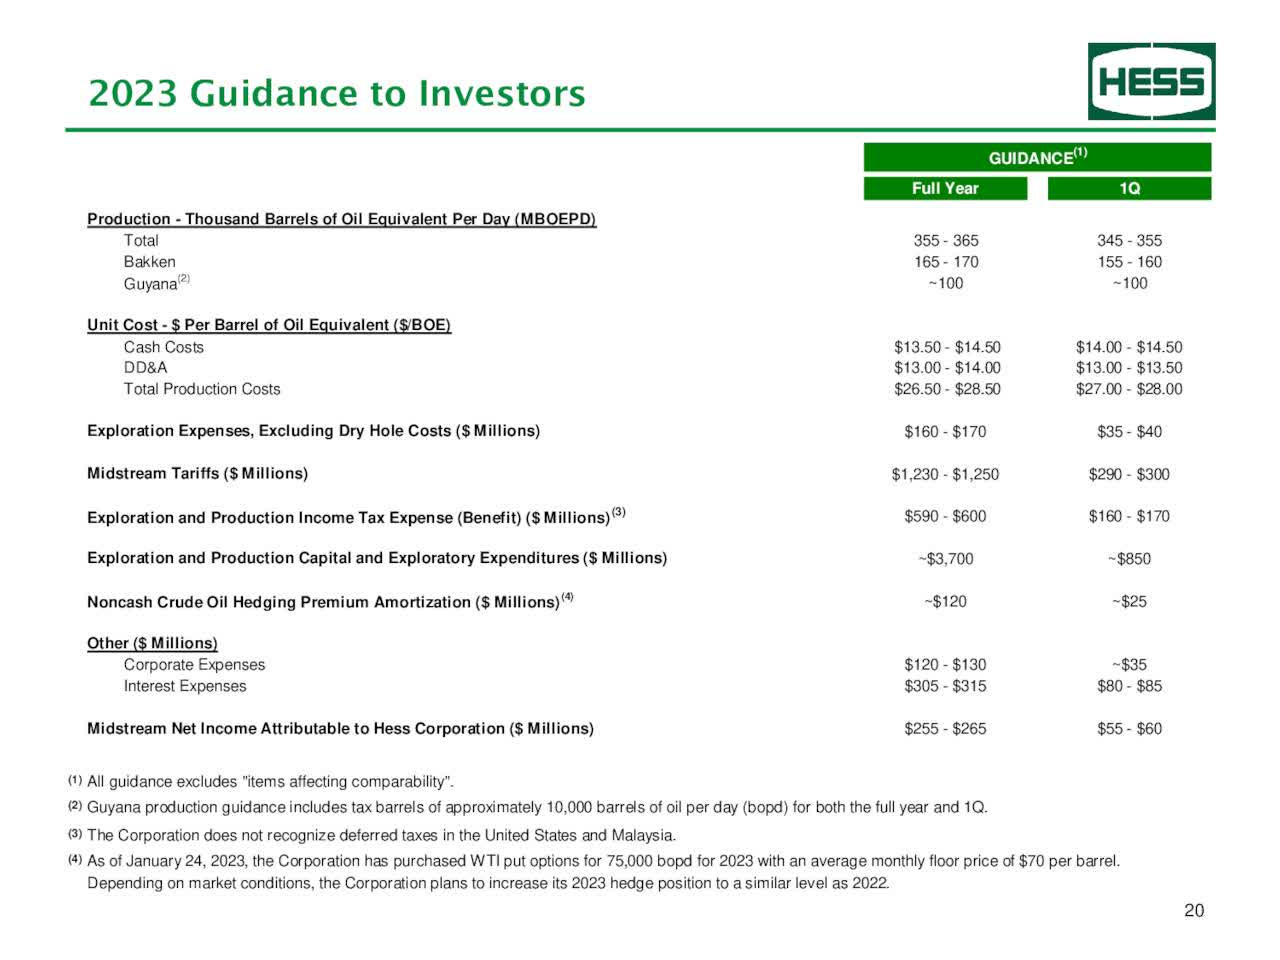
For 2023, Hess expects net production guidance of 355K-365K barrels of oil equivalent per day. Net production at Bakken is expected to be 165K-170K Boepd and 100K Boepd in Guyana.
For 2023, the capital and exploratory budget are expected to be $3.7 billion, with 80% directed toward Guyana and North Dakota’s Bakken Shale field. A substantial increase from $2.7 billion in 2022.
Technical Analysis and Commentary
HES TA Chart short-term (Fun Trading StockCharts)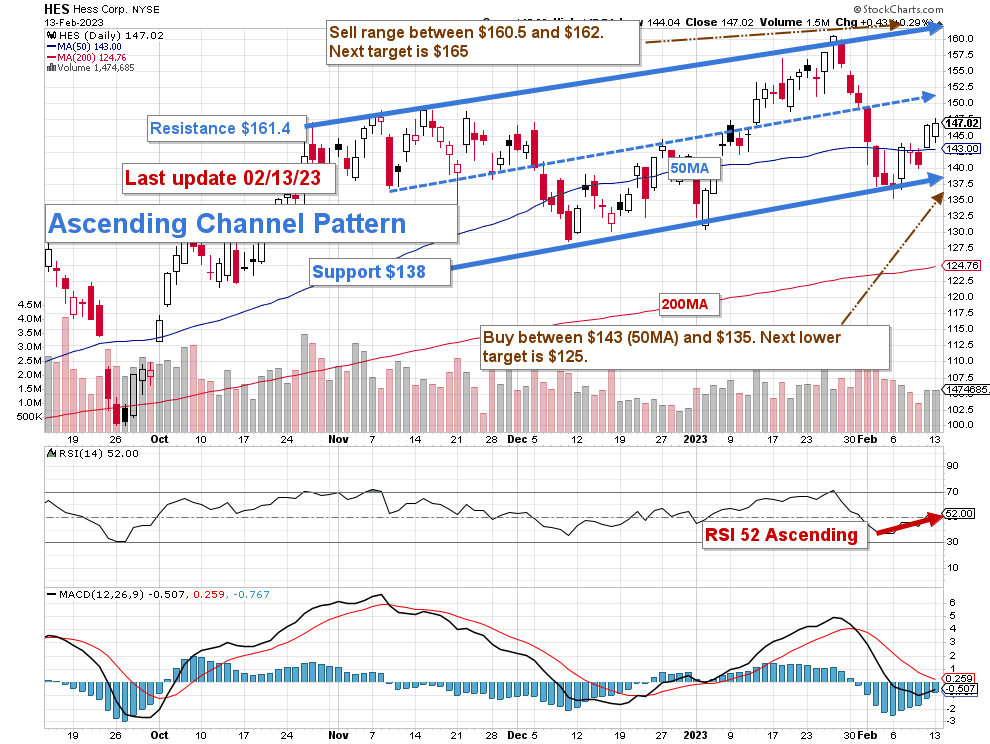
Note: the chart has been adjusted for the dividend.
HES forms an ascending channel pattern with resistance at $161.4 and support at $138.
Caution: Ascending channel patterns are short-term bullish, moving higher within an ascending channel. However, these patterns often form within longer-term downtrends as continuation patterns.
This means there is a high probability that HES retraces and tests the 200MA. However, RSI is 55, and it is not conclusive.
The short-term strategy is regularly trading LIFO at about 30%-35% of your position, and it may be wise to increase it to 40%-50% due to the recent downward pressure in gas prices.
Thus, I recommend taking profits between $160.5 and $162 with potential higher resistance at $165. Note that the mid-Resistance/support is $152. Conversely, I recommend buying between $143 and $135, with possible lower support at $125.
However, this simple short-term strategy will have to be adjusted depending on the situation in Ukraine and the growing risk of inflation that will significantly affect the oil stocks.
Watch oil prices like a hawk.
Warning: The TA chart must be updated frequently to be relevant. It is what I am doing in my stock tracker. The chart above has a possible validity of about a week. Remember, the TA chart is a tool only to help you adopt the right strategy. It is not a way to foresee the future. No one and nothing can.
Be the first to comment