


Takako Hatayama-Phillips
Earnings of Heritage Commerce Corp. (NASDAQ:HTBK) will most probably surge this year as high interest rates will boost the net interest margin. Further, the strengthening of California’s economy will drive loan growth, which will, in turn, boost earnings. Meanwhile, the provisioning will likely remain muted as Heritage has already reserved an excessively large amount for loan losses. Overall, I’m expecting Heritage Commerce to report earnings of $0.99 per share for 2022, up 26% year-over-year. Compared to my last report on the company, I’ve increased my earnings estimate as I’ve revised upwards my margin estimate. For 2023, I’m expecting Heritage Commerce to report earnings of $1.17 per share, up 18% year-over-year. The year-end target price suggests a high upside from the current market price. Therefore, I’m maintaining a buy rating on Heritage Commerce Corp.
Higher Rates are the Biggest Catalyst for Topline Growth
Previously I was expecting interest rates to plateau after 2022. However, due to the Federal Reserve’s recent upward revision of interest rate projections, I’m expecting rates to continue to rise next year, albeit at a slower pace than in 2022. I’m now expecting the fed funds rate to increase by 125-150 basis points till the mid of June 2023, from the current level of 3.25%.
Luckily for Heritage Commerce, the net interest income is quite sensitive to interest rate changes, according to the results of the management’s interest-rate sensitivity analysis given in the 10-Q filing. A 200-basis points hike in interest rates could boost the net interest income by 11.3% over twelve months.
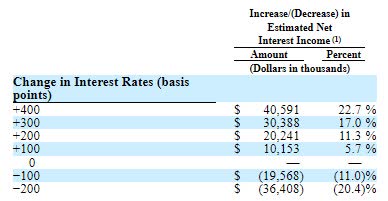
Heritage Commerce 2Q 2022 10-Q Filing
This rate sensitivity is attributable to both the loan and deposit mixes. Approximately 36% of Heritage Commerce’s loan portfolio consisted of floating-rate loans at the end of June 2022, as mentioned in the earnings release. As a result, the average earning-asset yield is moderately rate sensitive. In comparison, the deposit cost is quite sticky as non-interest-bearing deposits made up 40% of total deposits at the end of June 2022.
Considering these factors, I’m expecting the net interest margin to increase by 40 basis points in the second half of 2022 and then by ten basis points in 2023. Compared to my last report on Heritage Commerce, I’ve revised upwards my margin estimate because the Federal Reserve has become more hawkish than before on its monetary policy stance.
San Francisco’s Economy to Support Loan Growth
After declining during the first quarter, the loan portfolio surged by 1.9% (7.5% annualized) in the second quarter of 2022. Going forward, loan growth will most probably remain positive. The commercial and industrial (“C&I”) line utilization was just 28% at the end of June 2022, as mentioned in the earnings release. Therefore, there is plenty of room for growth in the C&I segment.
Heritage Commerce chiefly operates in California with a focus on the San Francisco Bay area. As shown below, San Francisco Bay has a very low unemployment rate. This means employees have more power in the labor market, which gives me hope that demand for consumer loans and residential mortgages will remain elevated.
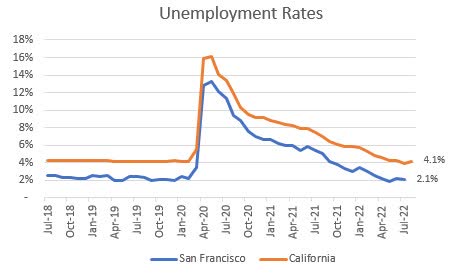
YCharts
Moreover, the outlook for commercial loan growth is positive due to economic recovery in the region, as indicated by the coincident index.
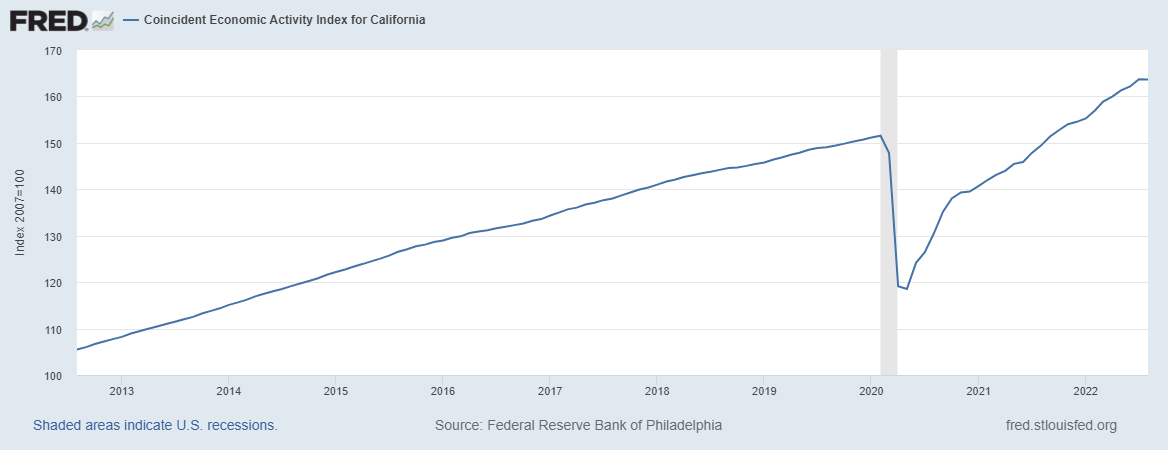
Federal Reserve Bank of Philadelphia
Considering these factors, I’m expecting the loan portfolio to increase by 1.25% every quarter till the end of 2023. Further, I’m expecting other balance sheet items to grow more or less in line with loans. The following table shows my balance sheet estimates.
| FY18 | FY19 | FY20 | FY21 | FY22E | FY23E | |||
| Financial Position | ||||||||
| Net Loans | 1,859 | 2,511 | 2,575 | 3,044 | 3,113 | 3,272 | ||
| Growth of Net Loans | 18.9% | 35.1% | 2.6% | 18.2% | 2.3% | 5.1% | ||
| Other Earning Assets | 973 | 1,180 | 1,635 | 2,054 | 1,947 | 2,046 | ||
| Deposits | 2,638 | 3,415 | 3,914 | 4,759 | 4,730 | 4,971 | ||
| Borrowings and Sub-Debt | 39 | 40 | 40 | 40 | 40 | 42 | ||
| Common equity | 367 | 577 | 578 | 598 | 624 | 663 | ||
| Book Value Per Share ($) | 8.7 | 12.0 | 9.6 | 9.9 | 10.2 | 10.9 | ||
| Tangible BVPS ($) | 6.4 | 8.1 | 6.5 | 6.9 | 7.3 | 7.9 | ||
|
Source: SEC Filings, Author’s Estimates (In USD million unless otherwise specified) |
||||||||
Provisioning Likely to Remain Below Average
The allowances for loan losses currently appear quite excessive relative to non-performing loans. The allowances-to-nonperforming loan ratio stood at a massive 1675.51% at the end of June 2022. From a historical perspective as well, the coverage is quite high. Allowances were 711.26% of total nonperforming loans at the end of June 2021. Further, the overall credit risk of the portfolio will remain low because around 82% of the loan book is comprised of real estate loans.
Overall, I’m expecting the net provision expense to make up around 0.15% of total loans (annualized) in every quarter till the end of 2023. In comparison, the net provision expense averaged 0.17% of total loans in the last five years.
Earnings to Surge by 26%
The sharp increase in interest rates and the resultant expansion of Heritage Commerce’s net interest margin will drive earnings in the next year and a half. Further, the provisioning will likely remain subdued as the existing allowance level is quite excessive. Overall, I’m expecting Heritage Commerce to report earnings of $0.99 per share for 2022, up 26% year-over-year. For 2023, I’m expecting earnings to grow by 17.7% to $1.17 per share. The following table shows my income statement estimates.
| FY18 | FY19 | FY20 | FY21 | FY22E | FY23E | |||
| Income Statement | ||||||||
| Net interest income | 122 | 132 | 142 | 146 | 173 | 201 | ||
| Provision for loan losses | 7 | 1 | 13 | (3) | 2 | 5 | ||
| Non-interest income | 10 | 10 | 10 | 10 | 9 | 9 | ||
| Non-interest expense | 76 | 85 | 90 | 93 | 96 | 105 | ||
| Net income – Common Sh. | 35 | 40 | 35 | 48 | 60 | 71 | ||
| EPS – Diluted ($) | 0.84 | 0.84 | 0.59 | 0.79 | 0.99 | 1.17 | ||
|
Source: SEC Filings, Earnings Releases, Author’s Estimates (In USD million unless otherwise specified) |
||||||||
In my last report on Heritage Commerce, I estimated earnings of $0.89 per share for 2022. I’ve increased my earnings estimate mostly because I’ve revised upwards my net interest margin estimate.
Actual earnings may differ materially from estimates because of the risks and uncertainties related to inflation, and consequently the timing and magnitude of interest rate hikes. Further, a stronger or longer-than-anticipated recession can increase the provisioning for expected loan losses beyond my estimates.
High Price Upside Calls for a Buy Rating
Heritage Commerce is offering a dividend yield of 4.4% at the current quarterly dividend rate of $0.13 per share. The earnings and dividend estimates suggest a payout ratio of 45% for 2022, which is below the five-year average of 66%. Heritage Commerce can easily afford to pay out more than half its earnings as its capital is greater than adequate. The company’s total capital ratio stood at 14.1% at the end of June 2022, as opposed to the minimum regulatory requirement of 10.5%. Therefore, there is certainly room for a dividend hike. However, to be on the safe side, I’m assuming the dividend will remain unchanged through the end of 2023.
I’m using the historical price-to-tangible book (“P/TB”) and price-to-earnings (“P/E”) multiples to value Heritage Commerce. The stock has traded at an average P/TB ratio of 1.72 in the past, as shown below.
| FY18 | FY19 | FY20 | FY21 | Average | ||
| T. Book Value per Share ($) | 6.4 | 8.1 | 6.5 | 6.9 | ||
| Average Market Price ($) | 15.7 | 12.3 | 8.3 | 11.2 | ||
| Historical P/TB | 2.44x | 1.52x | 1.28x | 1.63x | 1.72x | |
| Source: Company Financials, Yahoo Finance, Author’s Estimates | ||||||
Multiplying the average P/TB multiple with the forecast tangible book value per share of $7.3 gives a target price of $12.5 for the end of 2022. This price target implies a 6.5% upside from the September 21 closing price. The following table shows the sensitivity of the target price to the P/TB ratio.
| P/TB Multiple | 1.52x | 1.62x | 1.72x | 1.82x | 1.92x |
| TBVPS – Dec 2022 ($) | 7.3 | 7.3 | 7.3 | 7.3 | 7.3 |
| Target Price ($) | 11.1 | 11.8 | 12.5 | 13.2 | 14.0 |
| Market Price ($) | 11.8 | 11.8 | 11.8 | 11.8 | 11.8 |
| Upside/(Downside) | (5.9)% | 0.3% | 6.5% | 12.7% | 18.9% |
| Source: Author’s Estimates |
The stock has traded at an average P/E ratio of around 15.5x in the past, as shown below.
| FY18 | FY19 | FY20 | FY21 | Average | ||
| Earnings per Share ($) | 0.84 | 0.84 | 0.59 | 0.79 | ||
| Average Market Price ($) | 15.7 | 12.3 | 8.3 | 11.2 | ||
| Historical P/E | 18.8x | 14.6x | 14.2x | 14.2x | 15.5x | |
| Source: Company Financials, Yahoo Finance, Author’s Estimates | ||||||
Multiplying the average P/E multiple with the forecast earnings per share of $0.99 gives a target price of $15.3 for the end of 2022. This price target implies a 30.3% upside from the September 21 closing price. The following table shows the sensitivity of the target price to the P/E ratio.
| P/E Multiple | 13.5x | 14.5x | 15.5x | 16.5x | 17.5x |
| EPS – 2022 ($) | 0.99 | 0.99 | 0.99 | 0.99 | 0.99 |
| Target Price ($) | 13.3 | 14.3 | 15.3 | 16.3 | 17.3 |
| Market Price ($) | 11.8 | 11.8 | 11.8 | 11.8 | 11.8 |
| Upside/(Downside) | 13.5% | 21.9% | 30.3% | 38.8% | 47.2% |
| Source: Author’s Estimates |
Equally weighting the target prices from the two valuation methods gives a combined target price of $13.9, which implies an 18.4% upside from the current market price. Adding the forward dividend yield gives a total expected return of 22.8%. Hence, I’m maintaining a buy rating on Heritage Commerce Corp.
Be the first to comment