

AndreyPopov/iStock via Getty Images
Investment summary
With the asymmetry in risk assets continuing to widen in H2 FY22 it is becoming easier to separate the winners from the losers. Aspects of quality, in cash conversion, earnings quality and balance sheet strength have proven to be key attributes for obtaining risk-adjusted alpha this half. As such, our findings on HealthEquity, Inc. (NASDAQ:HQY) demonstrate there is an opportunity cost in holding the name over better performing stocks within the healthcare universe. Valuations and fundamental factors are unsupportive of a buy recommendation, and therefore we rate HQY a hold, with a price target of $53 per share.
Exhibit 1. HQY 6-month price action
Data: Updata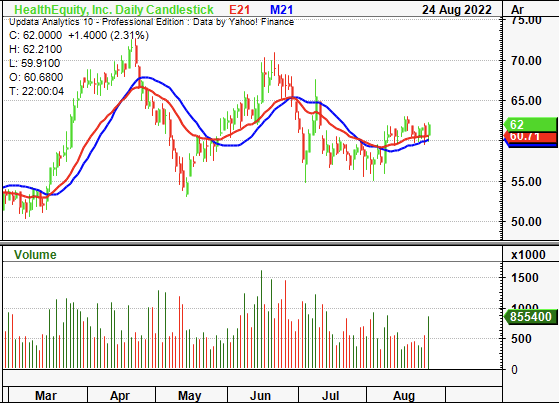
Q1 FY23 earnings leave more to be desired
First quarter earnings were mixed with upside at the top-line compared to consensus. Revenue came in 12% higher YoY to $205 million. Contribution from recent acquisitions were booked during the quarter, whereas service revenue contributed 51% to the top-line and gained ~200bps to $104 million. Custodial turnover also climbed 26% to $59 million.
Underlining the growth was upside in health savings accounts (“HSA”). Average HSA cash grew 28% YoY and average HSA investments expanded 47%. HQY reported an annualized HSA yield of 169 basis points on its HSA cash in Q1 FY23, better than expected. Moreover, HSA members reached nearly $7.5 million, a 26% gain over the 12 months. Total accounts grew to 14.5 million by the end of Q1.
Gross margin came in flat at 54%, yet gross profit was $111 million for the quarter – up from $103 million the year prior. Moving down the P&L, OPEX was $118 million and 58% of turnover. This resulted in a non-GAAP EBITDA of $58.3 million, down ~100bps YoY. The reduction in operating income stemmed from lower custodial yield and higher than normal staffing levels.
As seen in Exhibit 2, operating results fell in-line with longer-term averages recognized since FY19. Performance was lumpy throughout the pandemic, particularly at the operating income and FCF level. In fact, after remaining buoyant from FY16-FY19, FCF yield has narrowed substantially to a paltry 0.09% on TTM basis. We believe this poses a risk to earnings looking ahead as FCF conversion has been weakening and not strengthening into a potential economic downturn.
Exhibit 2. Quarterly operating performance has stagnated whilst FCF yield has narrowed substantially from FY19
Operating income has been the culprit, declining on a sequential basis since October 2019.
Data: HB Insights; HQY SEC Filings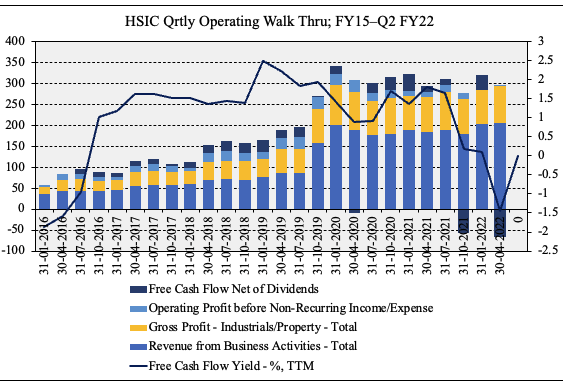
Dwindling return on investment
As the company has embarked on its acquisition trail, the weight of tangible value in its asset structure has declined substantially. As seen in the chart below, since mid-2019, the company’s balance sheet has tilted markedly to intangible sources of value. Whilst the stock trades at ~3x book value, and at a discount to peers (seen later) almost 90% of the company’s asset value is comprised of goodwill and intangibles. This wouldn’t be a problem at all, in fact, and would be favorable if HQY was generating consistently high return on investment (“ROIC”).
Exhibit 3. Balance sheet swing to intangibles and goodwill
Specifically, $1.65 billion in goodwill for Q1 FY23 on a total asset base of $3.065 billion.
Data: HB Insights, HQY SEC Filings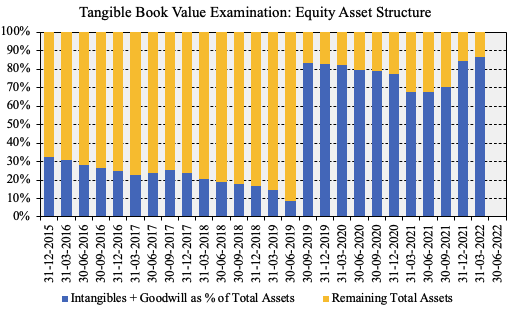
However, this isn’t the case. Here we examined how much NOPAT the company generates for the level of its invested capital. As seen in Exhibit 4, ROIC has dwindled from a high in FY18. Even backing out the pre-2019 period, HQY’s return on investment has remained steady and shown no signs of ticking upward. It printed ~2% in the last quarter, whilst its WACC rests at 7.4%. Ideally, we are seeking exposure to companies growing ROIC or at least holding substantially high ROIC as a measure of quality. With operating performance and capital management showing signs of weakening, this has us on the sidelines.
Exhibit 4. Return on investment (NOPAT from invested capital) has narrowed sequentially
Data: HB Insights, HQY SEC Filing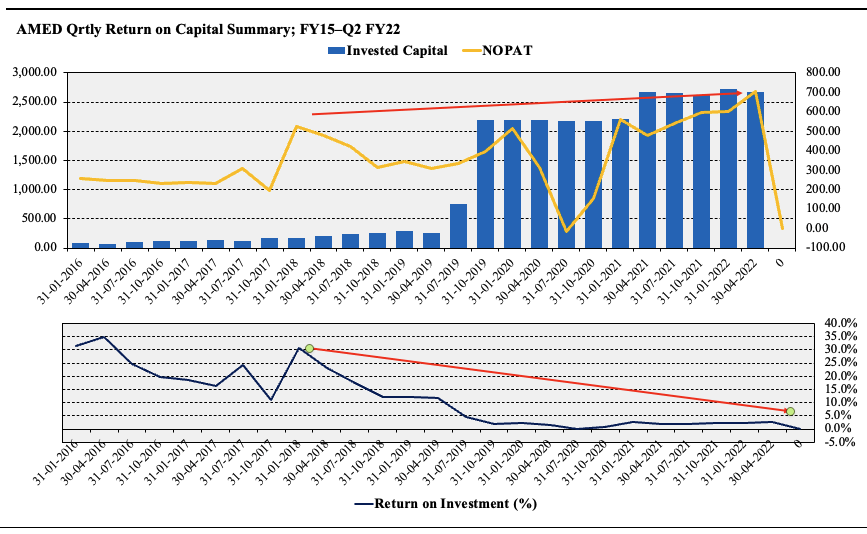
Guidance revised upward
Looking ahead, management forecasts FY23 revenue between $827 to $837 million, and non-GAAP net income of $103-$111 million. It previously forecasted $820-$830 million at the top. Management forecasts this to produce $1.23-$1.32 per share. We forecast revenue of $831 million, and earnings of $1.27 per share. We also note HQY’s earnings has been largely cash-based from the past 5-years to date, as seen in Exhibit 3, providing some certainty on the predictability of its future cash flows.
Exhibit 5. HQY quarterly earnings have been largely cash-based over the past 5-years to date
Data: HB Insights, HQY SEC Filings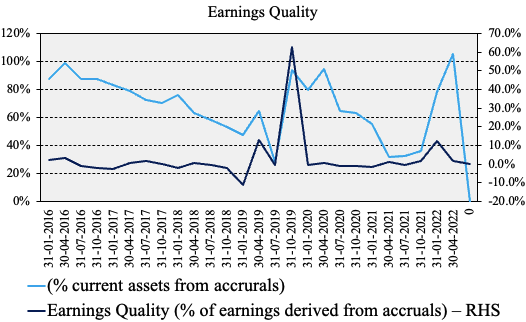
Valuation
We are paying 2.8x book value and ~7x sales for a series of narrowing ROIC and lumpy operating performance. Moreover, we estimate EPS to narrow from $1.33 in FY22 to $1.27 in FY23 and this is important to factor in the investment debate. Another important factor is that HQY has negative tangible book value of $798 million in light of the points outlined above. The stock is also priced at 3.2x enterprise value (“EV”) to book value. At this multiple, we are paying $71.50, or a 15% premium to the current share price. Hence we estimate HQY to be 15% overvalued, and see it fairly valued at $53.91. This is backed by our 41.6x FY23 EPS estimates of $1.27 giving a price target of $52.07.
Exhibit 6. Multiples and comps
Data: HB Insights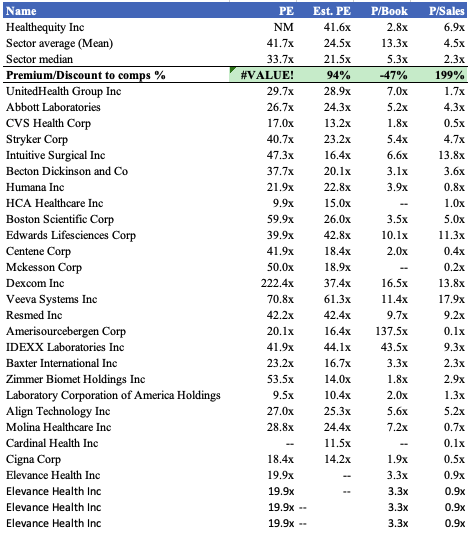
In short
HQY offers a loose affinity to the kind of equity premia we are searching for in H2 FY22. Operating performance has been lumpy since FY19 whilst capital management has led to a dwindling return on investment that will struggle to beat the hurdle. Share price returns have mirrored the fundamental performance to date and we estimate similar trends looking ahead.
Without a bolus of flesh to place on the skeleton, HQY’s investment debate has us tilted back to neutral. Without a directional view on the market, we rate the stock a hold on a $53 per share valuation. We look forward to providing additional coverage.
Be the first to comment