

RainStar/E+ via Getty Images
By Robert Hughes
Industrial Output And Capacity Utilization (Author)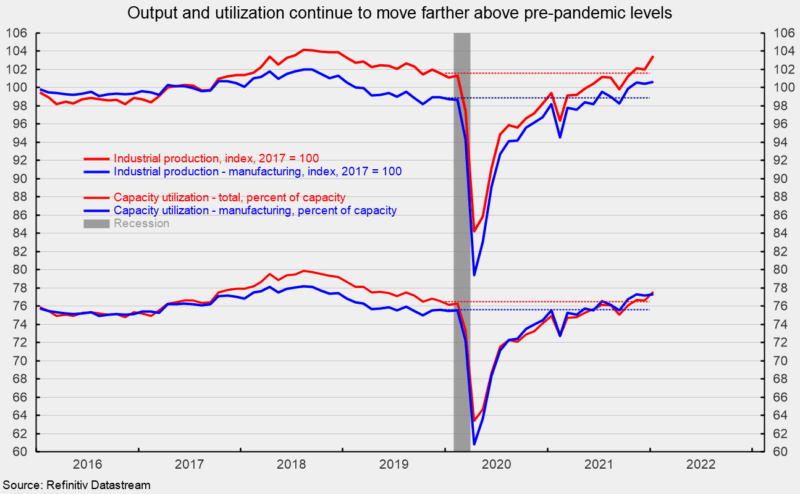
Industrial production jumped 1.4 percent in January, led by a surge in utility output. The gain pushes total industrial output to its highest level since December 2018, and clearly above the December 2019 level prior to the pandemic (see first chart). Over the past year, total industrial output is up 4.1 percent.
Capacity utilization increased 1.0 point to 77.6 percent from 76.6 percent in December, the highest since March 2019 (see first chart). Total capacity utilization remains well below the long-term (1972 through 2020) average of 79.5 percent.
Manufacturing output – about 74 percent of total output – posted a more modest 0.2 percent increase for the month (see first chart). Manufacturing output is also at its highest level since December 2018 and is 1.8 percent above its December 2019 pre-pandemic level (see first chart). From a year ago, manufacturing output is up 2.5 percent.
Manufacturing utilization increased 0.1 point to 77.3 percent, above the December 2019 level of 75.6 percent and matching the highest level since December 2018 (see first chart). However, manufacturing utilization remains below its long-term average of 78.1 percent and well below the 1994-95 high of 84.7 percent.
Mining output accounts for about 14 percent of total industrial output and posted a solid 1.0 percent increase last month (see top of second chart). Over the last 12 months, mining output is up 8.2 percent. Utility output, which is typically related to weather patterns and is about 12 percent of total industrial output, surged 9.9 percent for the month (see top of second chart), with natural gas up 24.2 percent and electric up 7.6 percent. From a year ago, utility output is up 9.3 percent.
Industrial Production Indexes, Monthly % Change (Author) Industrial Production Indexes – Motor Vehicles Production Is The Clear Laggard (Author)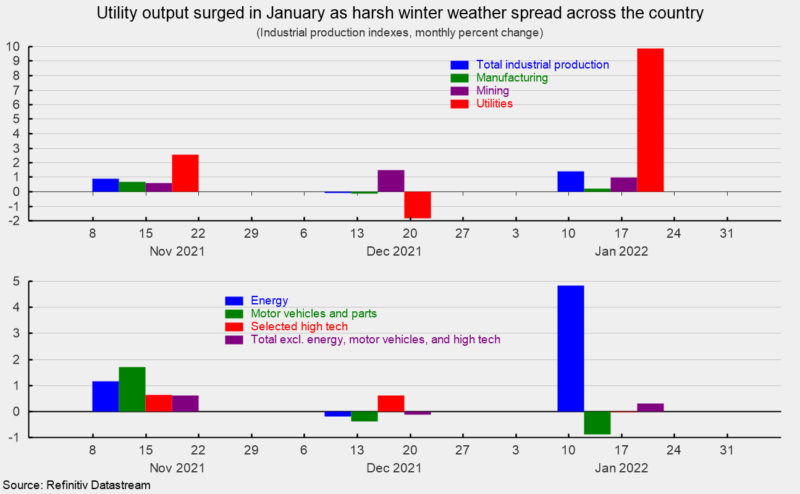
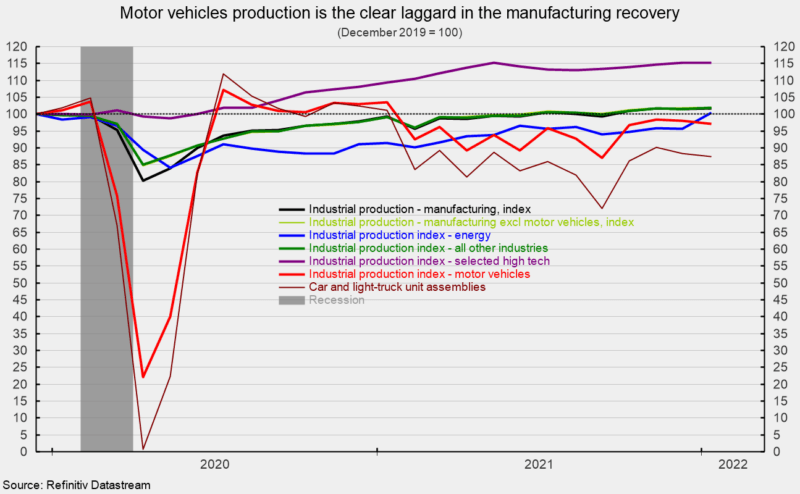
Among the key segments of industrial output, energy production (about 27 percent of total output) rose 4.8 percent for the month (see bottom of second chart), with significant gains across all five components. The weather-related surge in utility output also influenced the energy sector results in January. Total energy production is up 9.8 percent from a year ago and is back slightly above the December 2019 level (see third chart).
Motor vehicle and parts production (slightly under 5 percent of total output), one of the hardest-hit industries during the lockdowns and post-lockdown recovery, continues to be volatile as the industry struggles with a semiconductor chip shortage. Motor vehicle and parts production fell 0.9 percent in January, following a 0.4 percent drop in December but a 1.7 percent jump in November and an 11.2 percent surge in October (see bottom of second chart). From a year ago, vehicle and parts production is still off 6.2 percent, and compared to December 2019, output is off 2.9 percent (see third chart).
Total vehicle assemblies fell to 9.35 million at a seasonally adjusted annual rate. That consists of 9.02 million light vehicles and 0.33 million heavy trucks. Within light vehicles, light trucks were 7.47 million while cars were 1.56 million. Light vehicle assemblies are still more than 12 percent below December 2019 levels (see third chart).
The selected high-tech industries index was unchanged in January (see bottom of second chart), is up 5.3 percent versus a year ago and about 15 percent above December 2019 (see third chart). High-tech industries account for just 1.9 percent of total industrial output.
All other industries combined (total excluding energy, high-tech, and motor vehicles; about 67 percent of total industrial output) rose 0.2 percent in January (see bottom of second chart). This important category is 2.7 percent above January 2021 and 1.8 percent above December 2019 (see third chart).
Industrial output jumped in January, mostly due to a weather-related surge in utility output. Other areas generally posted a modest gain for the month. Ninety-five percent of the industrial sector is now producing at or above the December 2019 level prior to the pandemic. While ongoing difficulties with labor, logistics, and materials shortages continue to be challenges for many industries especially in manufacturing, some of these issues may have been starting to ease prior to the Omicron wave. With the latest wave of new Covid cases receding in many areas, producers will be able to refocus on boosting output and easing logistical bottlenecks. However, the overall labor shortage may prolong the process.
Editor’s Note: The summary bullets for this article were chosen by Seeking Alpha editors.
Be the first to comment