

francescoch/iStock via Getty Images
Coincident economic data
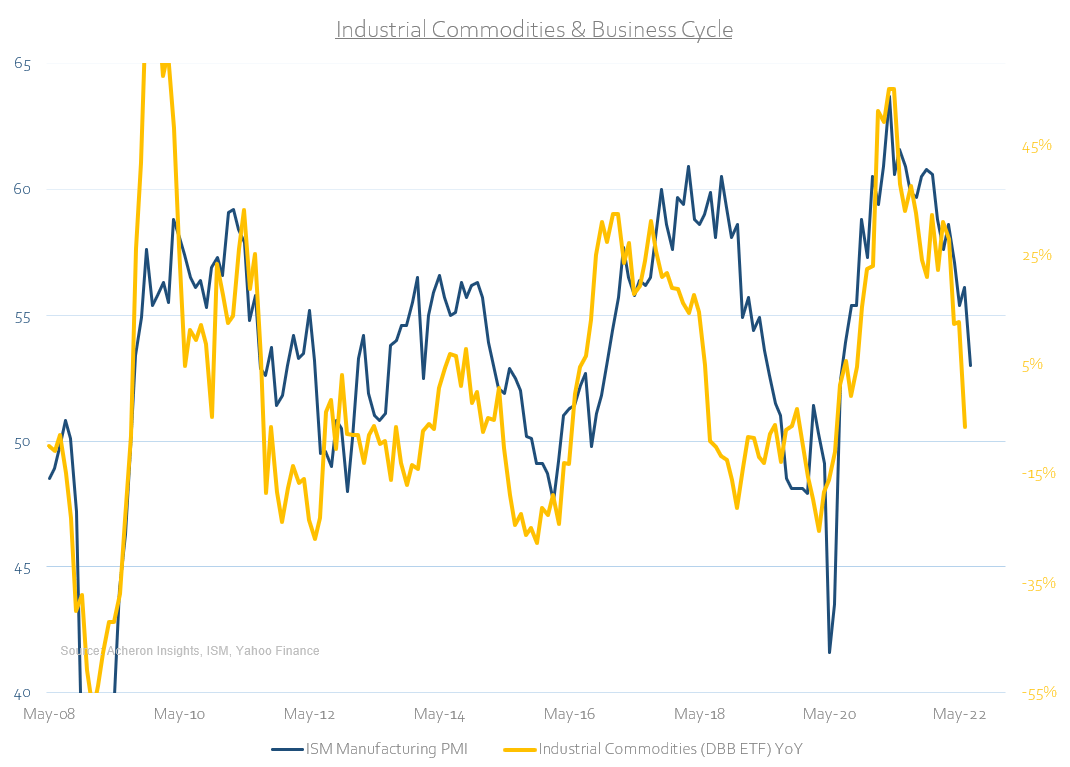
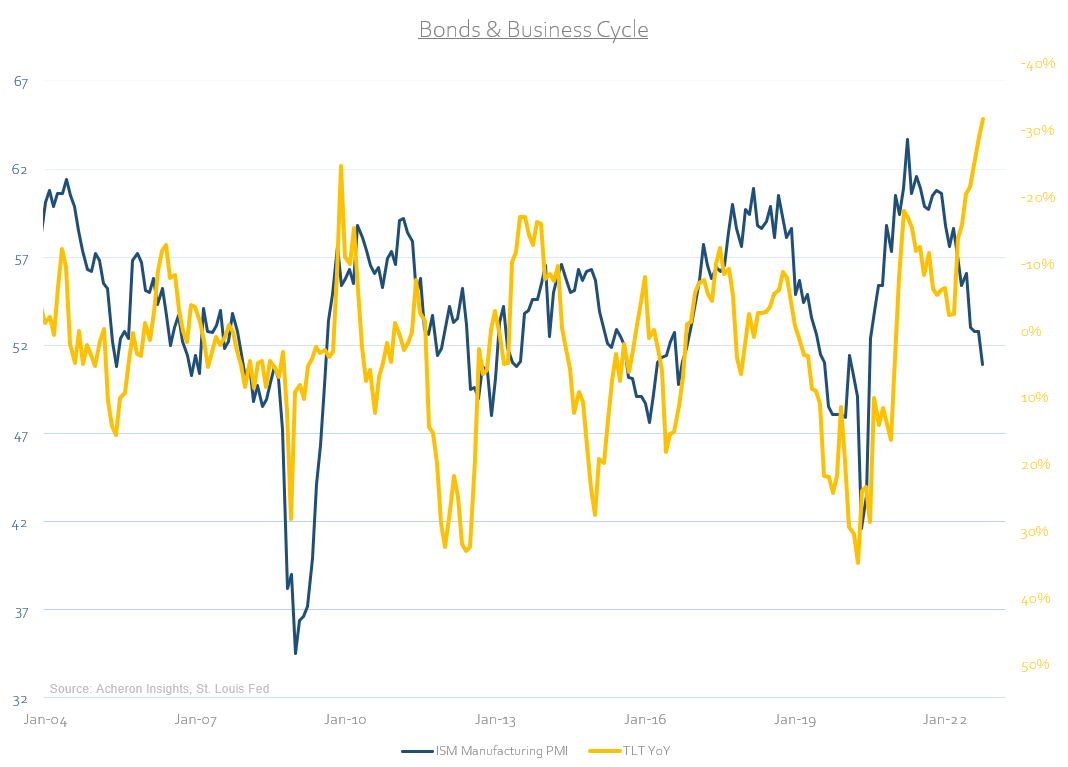
Before we assess the leading indicators of the growth cycle, let us first assess where the economy resides at present. In order to determine where we lie currently in the business cycle, one of the most valuable and most popular coincident indicators of economic growth is the Institute of Supply Management’s manufacturing Purchasing Managers’ Index (PMI). The manufacturing PMI provides us with an up-to-date view of where we are in the growth cycle and where we have been. Whilst the forward-looking indicators of growth provide the most value in terms of asset allocation and investment-making decisions, it is the coincident measures of growth that define the trend.
After the PMI reached 30-year highs in 2021 following the COVID-19 recession, we have seen significant deceleration since. Whilst much of the robustness of the economy can be attributed to the fact that we are decelerating from such high levels, given the forward outlook for growth the PMI has not reached a level typically seen at the trough of a cyclical slowdown or recession similar to what appears imminent.
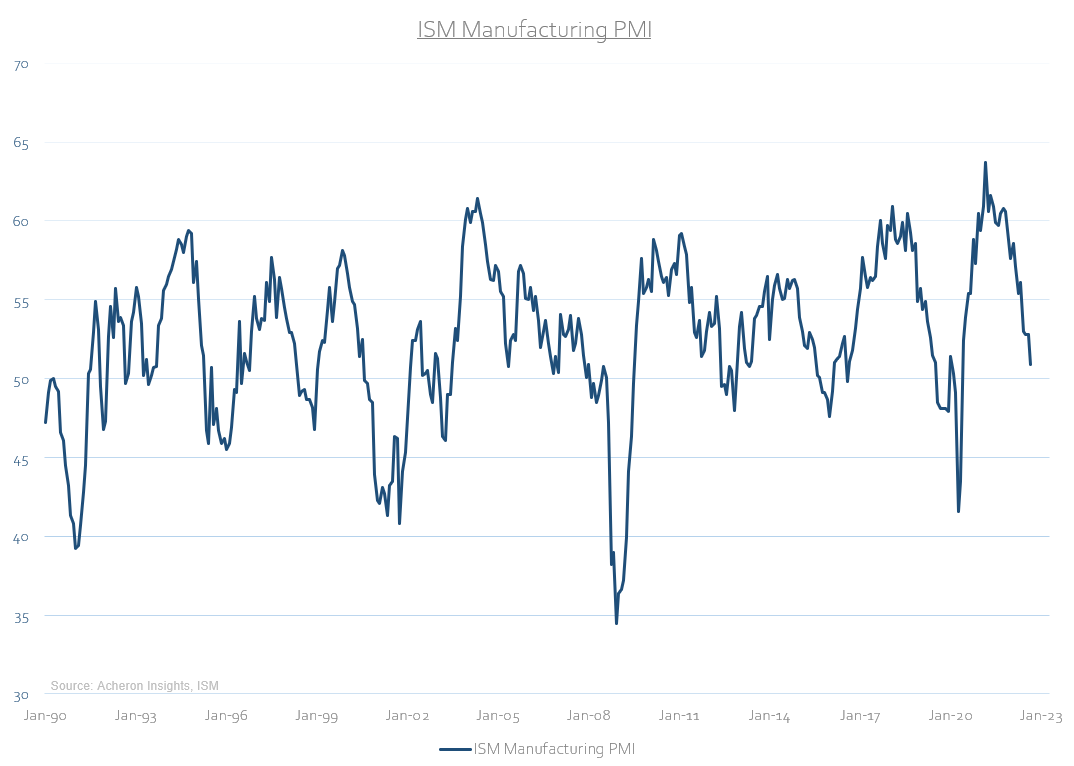
On an absolute basis, a PMI reading of above 55 is indicative of a robust economy. However, it is the direction of growth that matters most for asset prices and financial markets. Should the PMI continue to move sub-50, most equity markets and risk assets should continue to struggle.
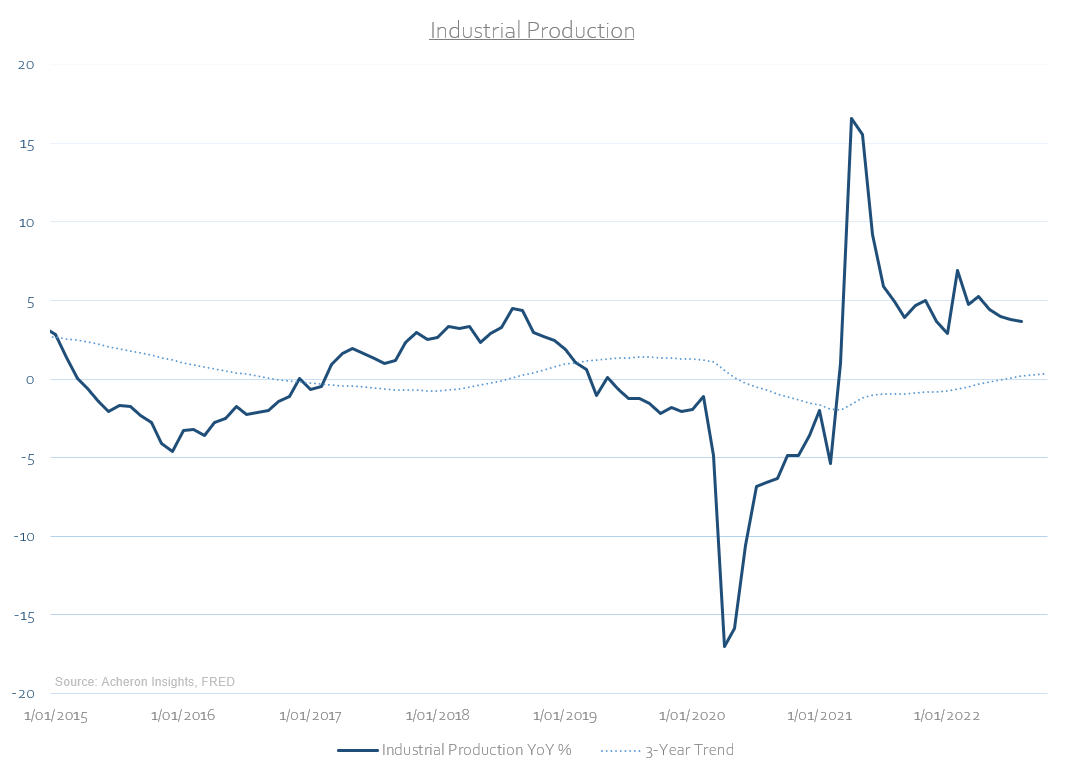
Delving deeper in the coincident indicators of growth, specifically those used by the NBER in their recession determinations, we are able to ascertain a view of the current trend in growth across the entire economy through the lens of manufacturing, employment, real incomes and consumption. Beginning with the former, the growth rate of industrial production (i.e. manufacturing) has remained robust despite its peak in mid-2021.
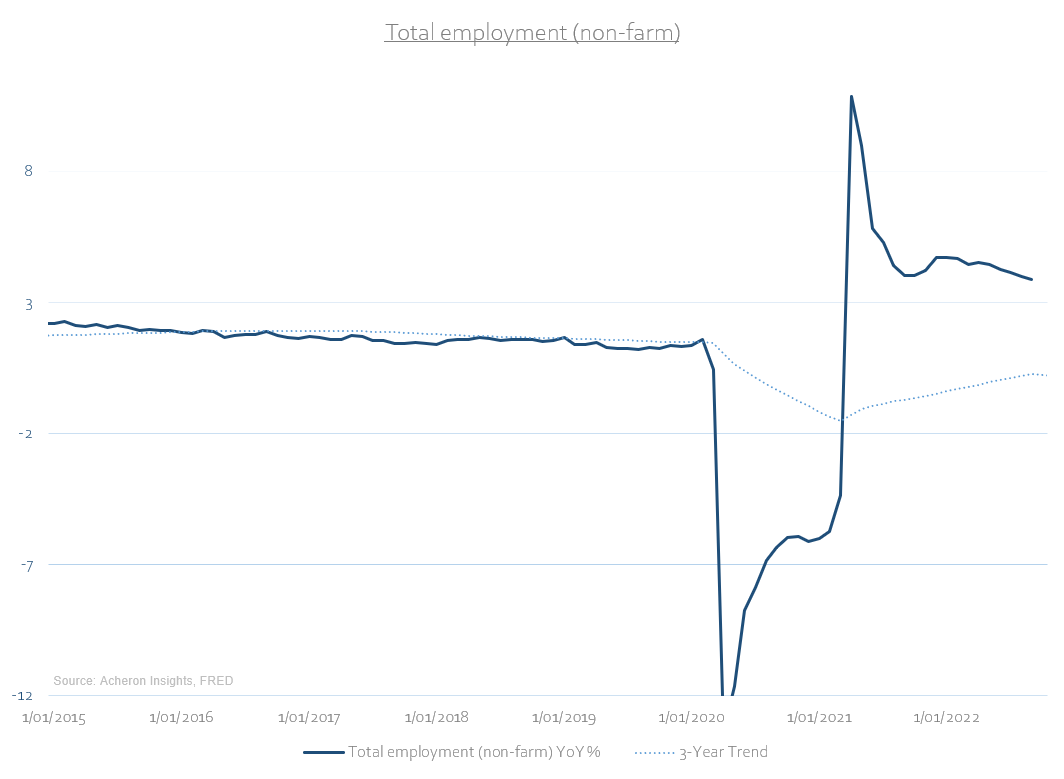
The same can be said of employment as the labour market remains tight. Given one half of the Fed’s dual mandate is stable employment, assessing the labour market is of key importance to understanding where monetary policy is headed. Unfortunately however, unemployment is a lagging economic indicator and looks set to deteriorate in the months ahead, a dynamic in which I opined upon recently (which you can enjoy here). Until we see any material move lower in employment, expect Fed policy to remain tight.
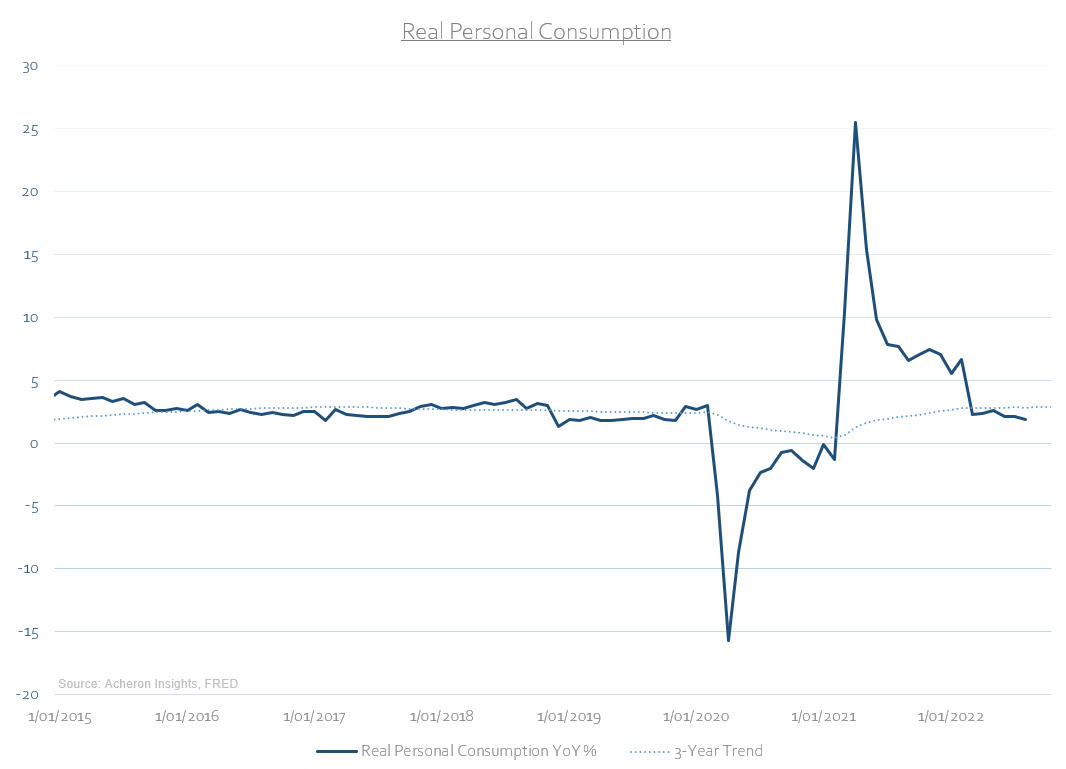
Where the economy has faltered thus far is within the areas of consumption. Real personal consumption continues its trend lower on a growth rate basis and is below its three-year trend. It is through such data points we can truly see the impact of inflation, particularly in the essential goods areas of food and energy.
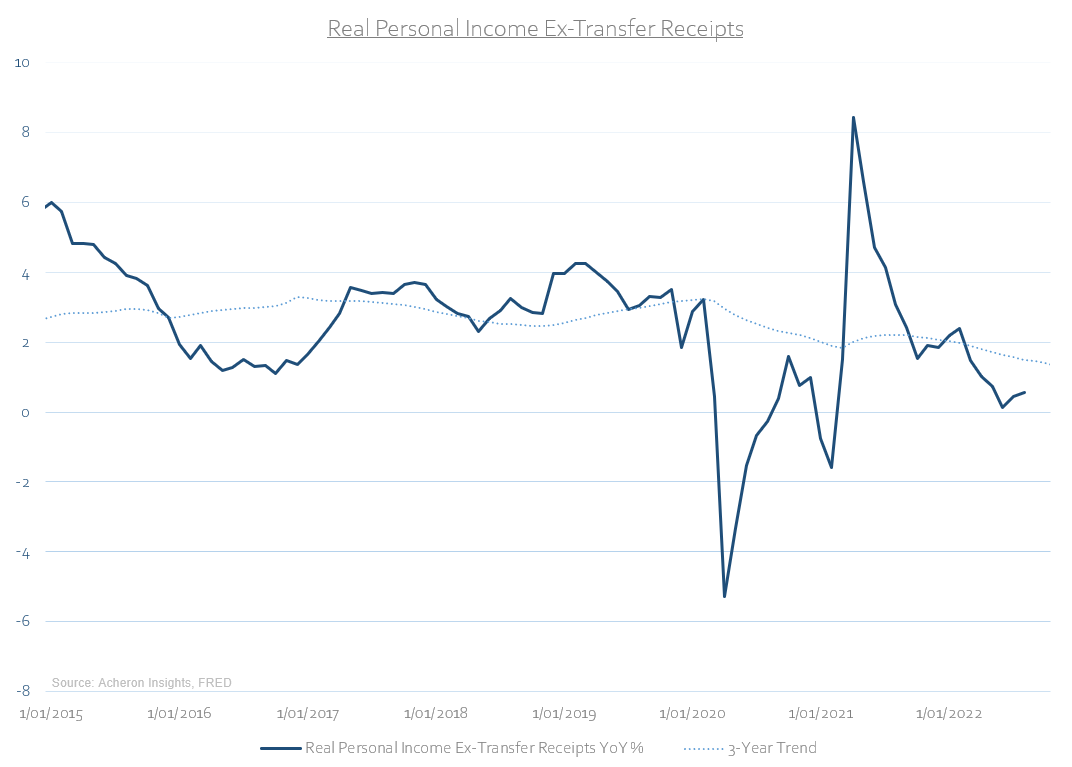
The same can be said of real income growth exclusive of government support payments. This measure of incomes is too trending lower and below its three-year trend. Inflation has been growing at a faster pace than wages for some time now.
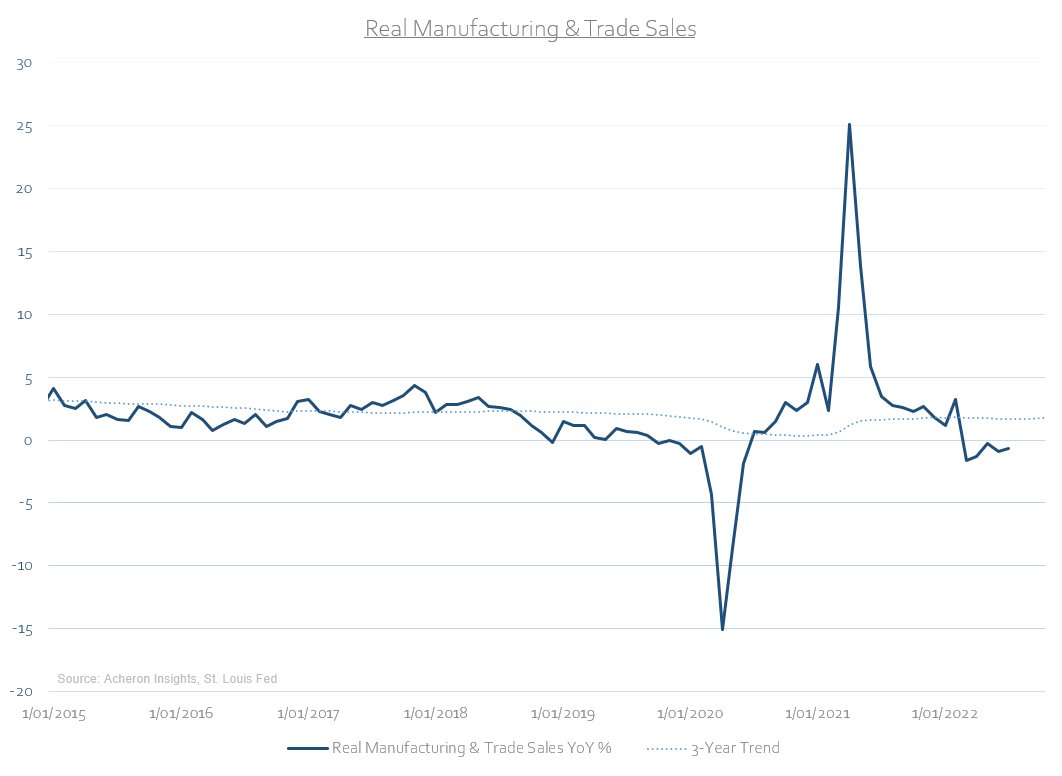
Therefore it should not be surprising to see real manufacturing and trade sales is negative growth territory and too well below its three-year trend.
The NBER defines a recession as a significant decline in economic activity that is spread across the economy and lasts more than a few months. From what the broad measures of coincident economic activity above suggest, we can see consumption and demand have been hit hardest thus far, whilst manufacturing and employment have been most resilient. Depending on the trend in the latter data points over the coming months, this will allow us to determine whether we do in fact experience merely a cyclical growth slowdown or an outright recession.
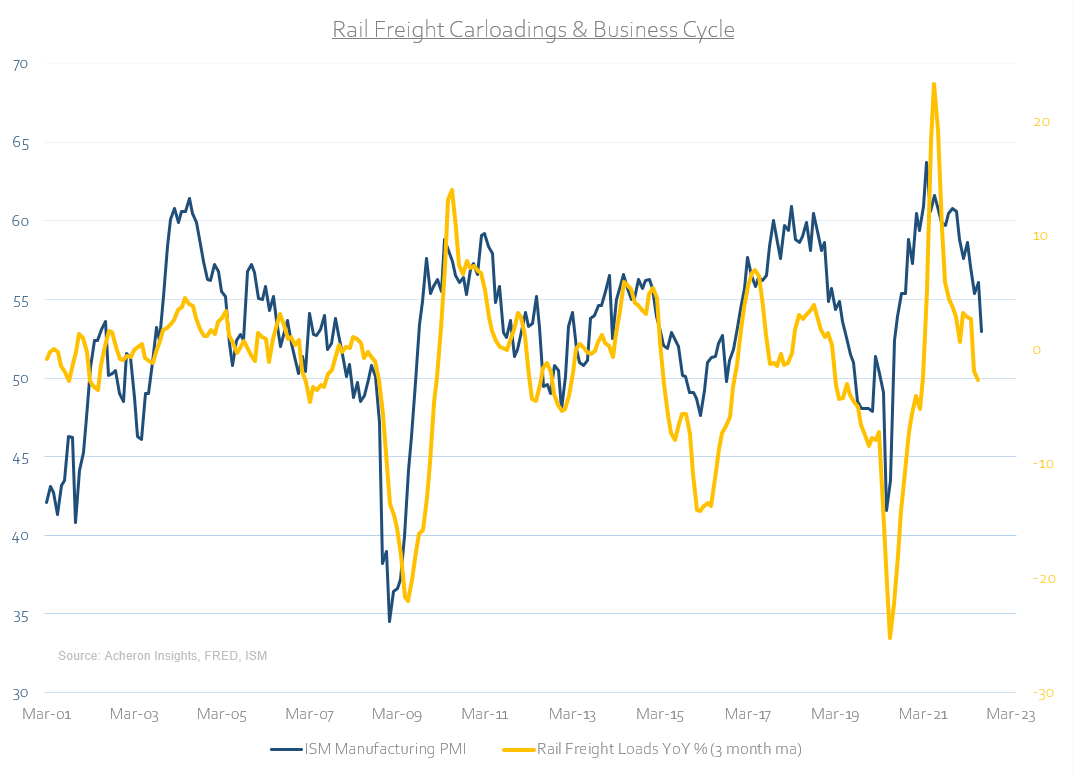
What is clear however is that we are seeing a significant slowdown in economic activity. Indeed, Rail Freight Carloadings have rolled over significantly and are now in negative growth territory.
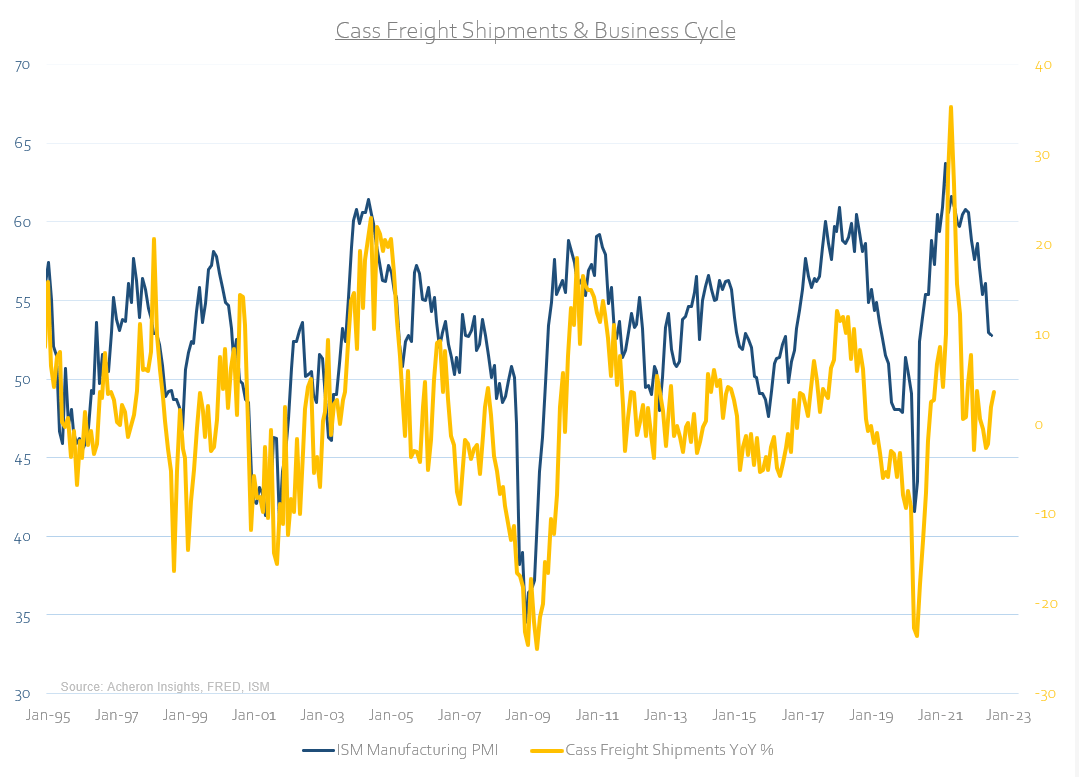
The same can be said of Cass Freight Shipments.
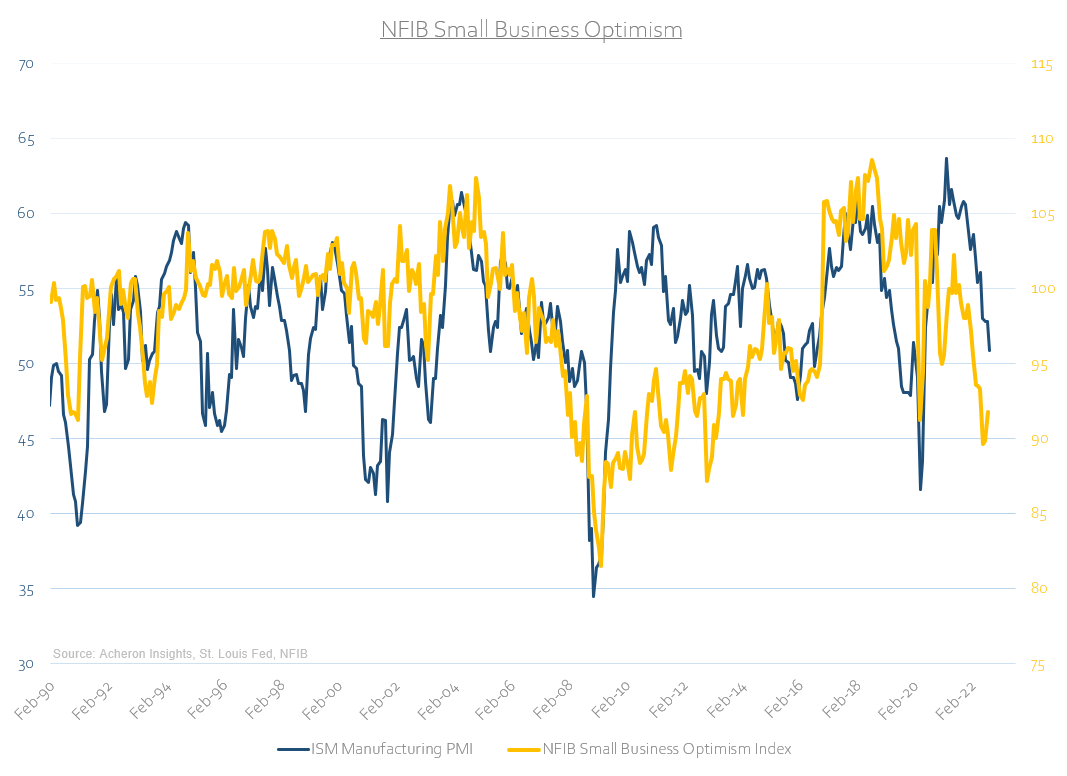
Meanwhile, small business optimism is lower than that seen during the depths of the COVID-19 lockdowns. Clearly, small businesses are taking much of the brunt of the contraction in demand, this time without monetary and fiscal support. Small businesses play a significant role in the economy given they account for approximately 66% of all new jobs and roughly 44% of total US economic activity according to the US Small Business Administration. The trends in small businesses are a big part of the growth cycle.
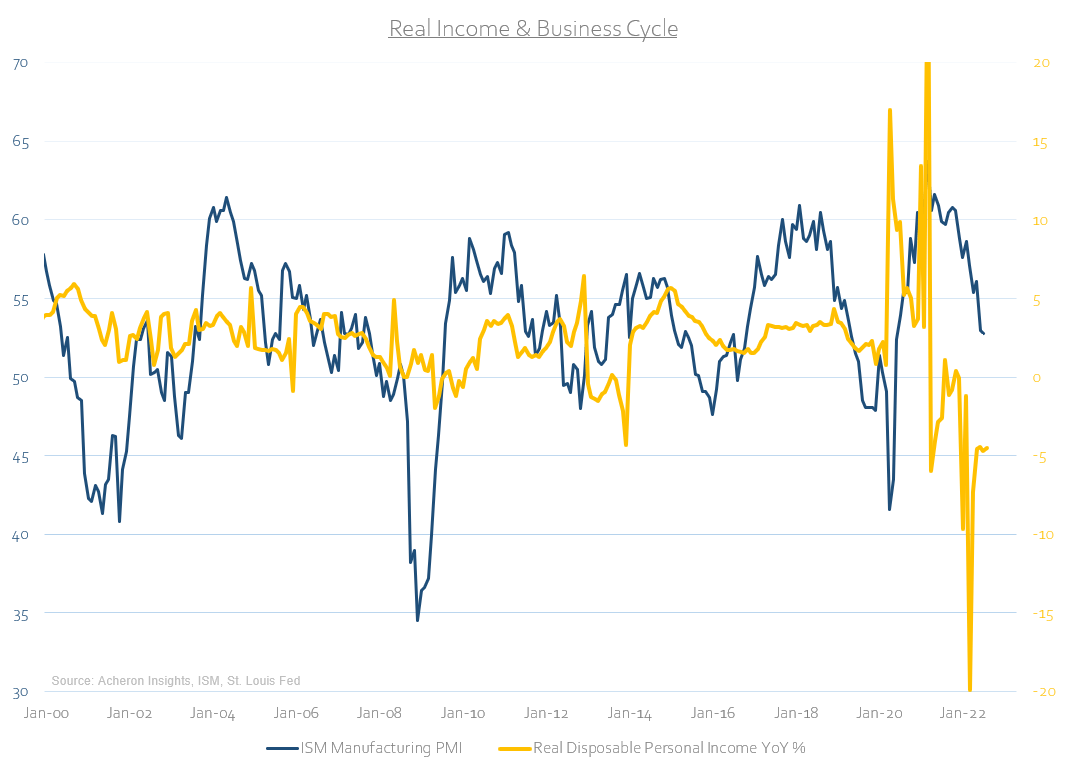
Much of this demand destruction impacting consumption stems from the negative growth in real incomes as inflation continues to trend higher than wage growth.
Unsurprisingly, consumer sentiment is also tanking alongside that of small businesses, with the University of Michigan’s Consumer Sentiment survey seeing readings lower than during the GFC.
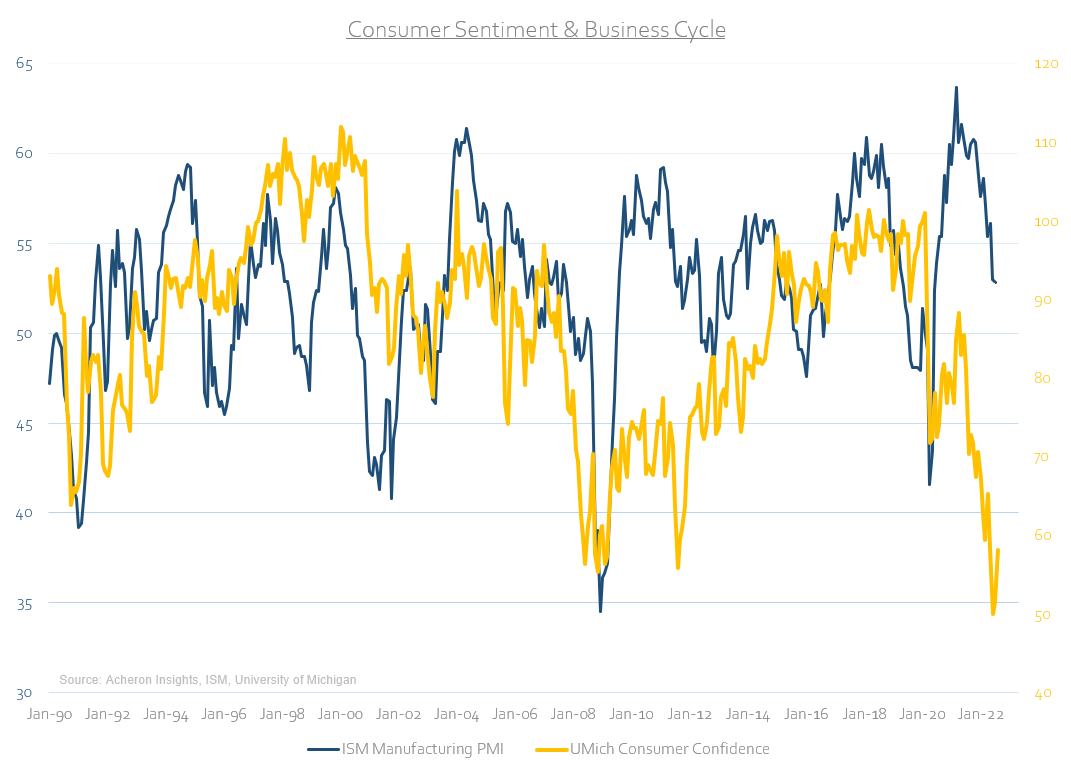
Clearly, consumer demand is being destroyed.
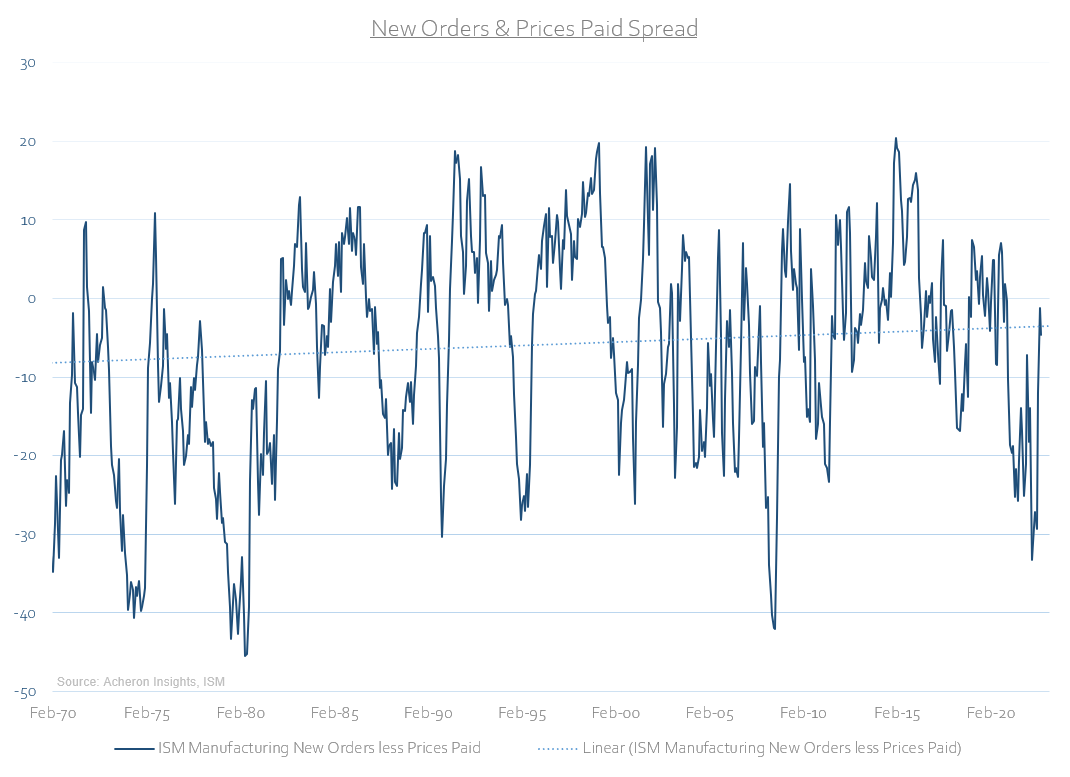
We may well be reaching a point whereby demand destruction ought to be a more important factor than inflation in the setting of monetary policy, though policymakers are unlikely to pick up on this trend until it is too late. We can see this dynamic below by measuring the spread between the ISM’s manufacturing survey New Orders and Prices Paid subcomponents. When this reading reaches a sub-20 level, prices paid by manufacturers is outweighing sales (i.e. stagflation), with a high reading indicative of the opposite.
As we can see, demand destruction has played a significant role in the trend of growth in recent months, although several areas of the economy (particularly employment) remain robust for the time being. However, in order to ascertain where the economy is headed, which is what matters most for inventors, both the long and short-leading indicators of the growth cycle must be assessed.
Long-Leading Indicators
What has occurred in the past year is likely the biggest tightening of financial conditions in a generation, with inflation primarily the culprit.
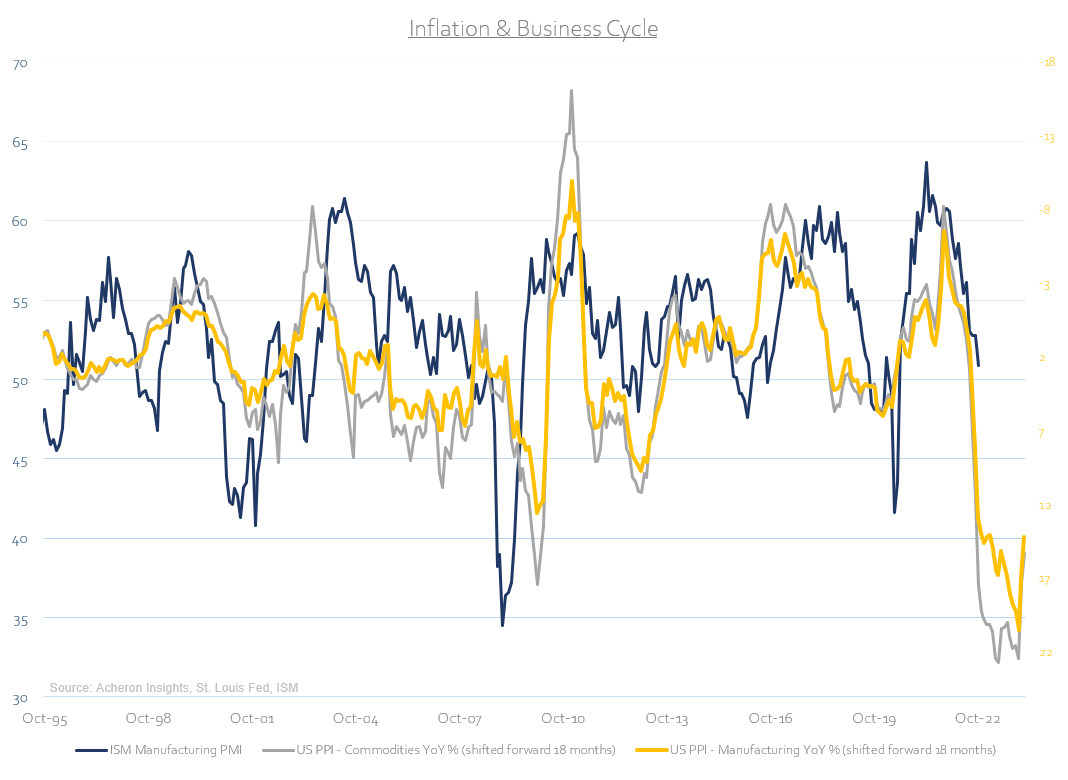
As a result, borrowing costs have risen dramatically to reflect the new economic environment. This is true of both interest rates:
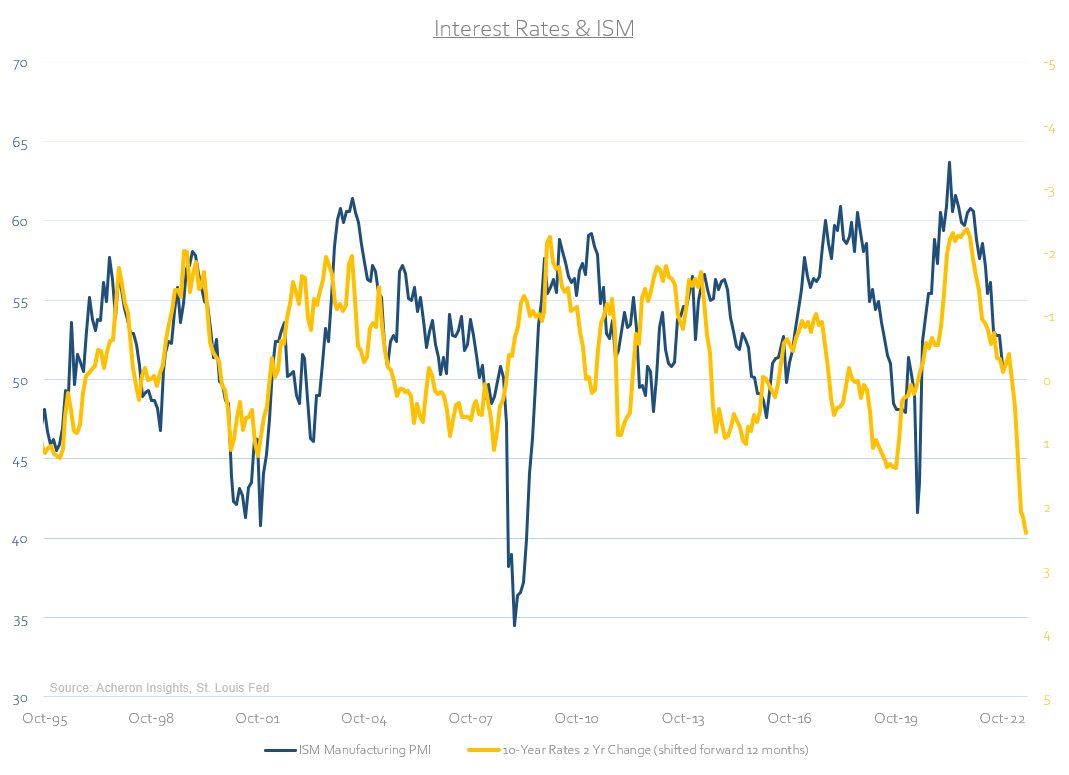
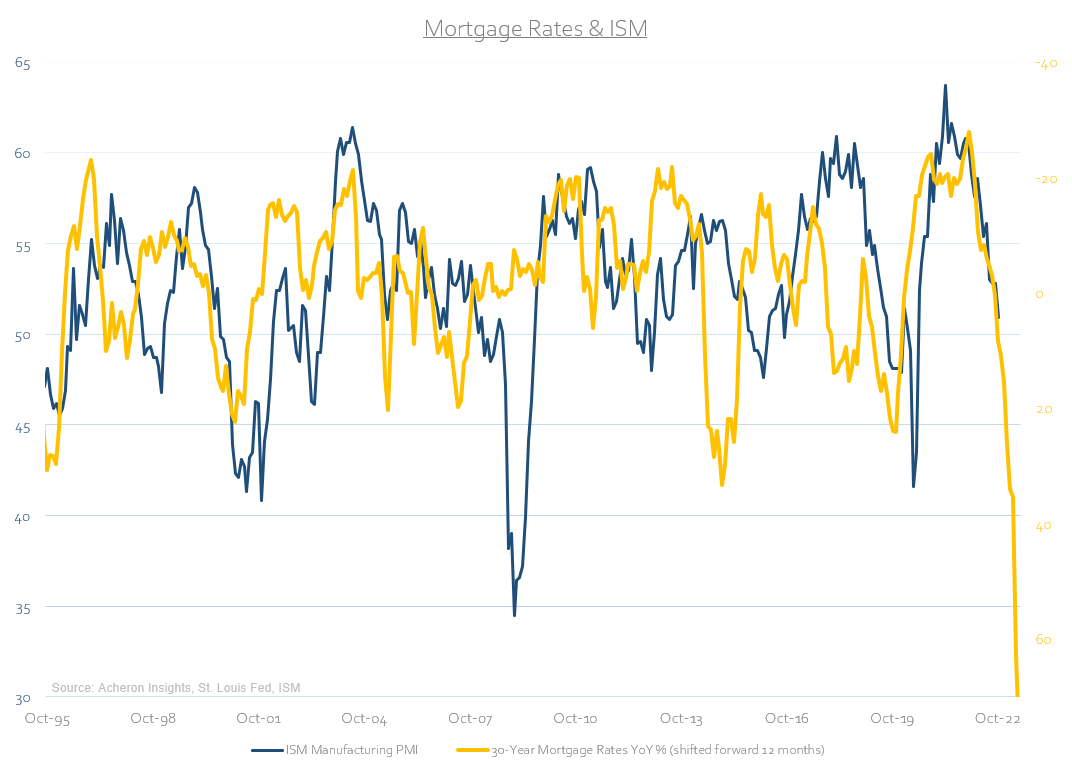
And even more so of mortgage rates. Given how important mortgage rates are for the housing market (as I detailed here), and how the housing market impacts consumption, these trends in borrowing costs and inflation have significant implications for the trend in economic growth over the next six to 12 months.
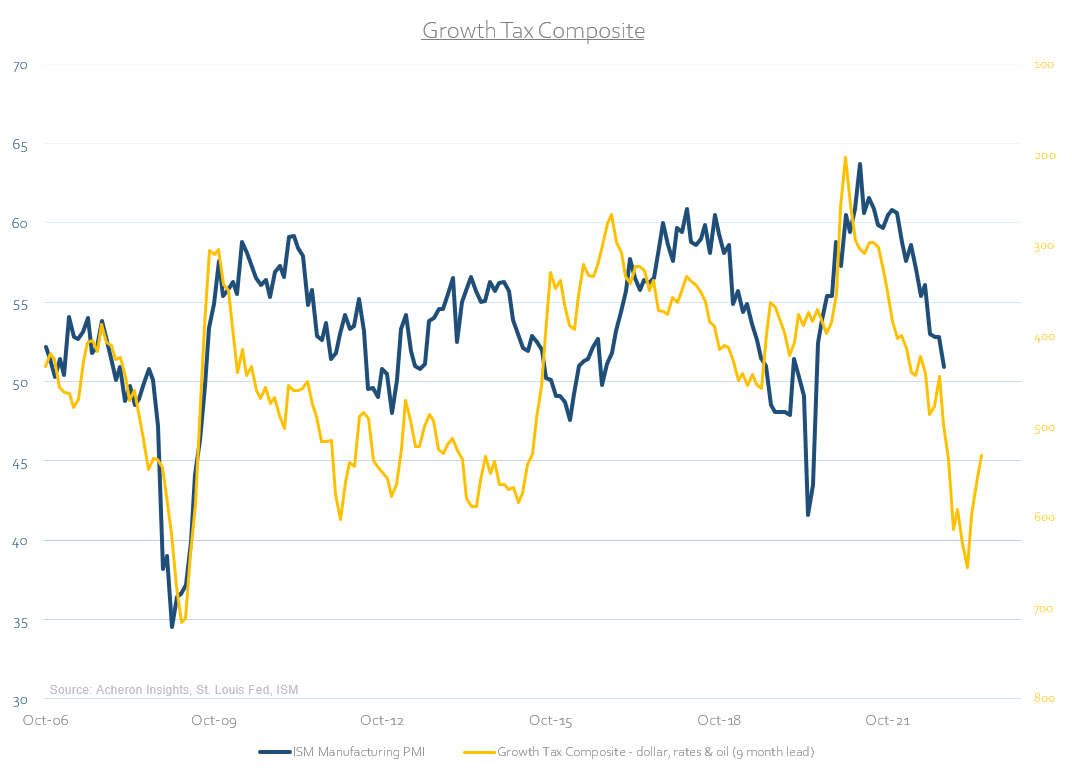
Not only do borrowing costs play a significant role in the cyclical areas of the economy, but the direction of the dollar and energy costs are too a large driver of growth. As we can see below, a composite of rates, the dollar and oil indicate a sub-40 ISM reading is a possibility in 2023.
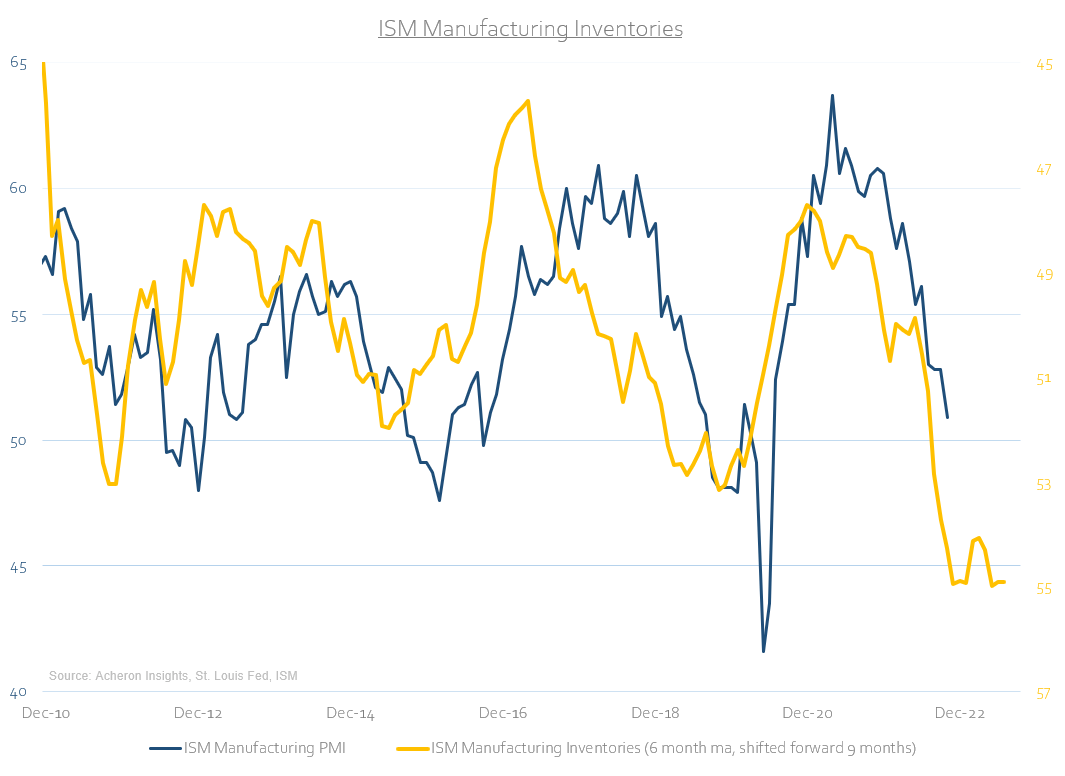
The inventory cycle is another long-leading indicator of the growth cycle which has turned from tailwind to headwind. Whilst a build-up of manufacturing inventories is a tailwind for growth, they can be self-defeating as higher inventories lead to slowing growth.
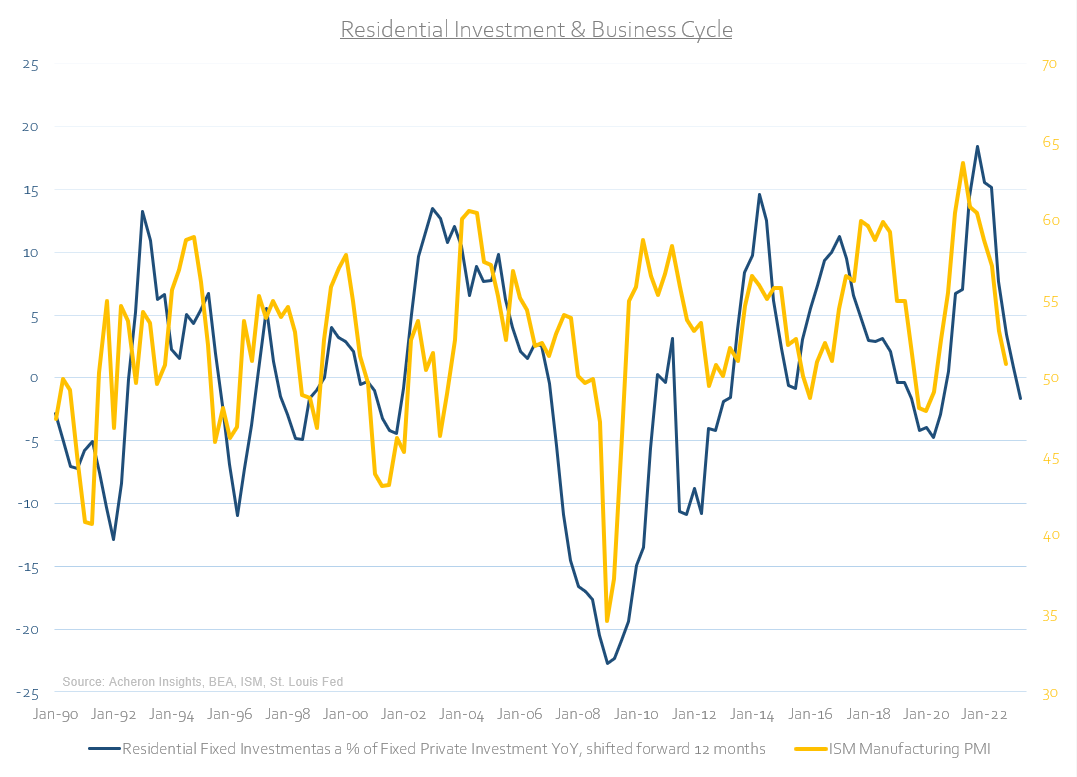
Turning back to the housing market, here we can see its importance in economic growth. According to the National Association of Homebuilders, the activity in housing through the mechanisms of residential investments and housing related consumption spending contributes to around 15-18% of GDP. Therefore, given the slowdown in housing largely a result of the move higher in mortgage rates, the downtrend in residential investment does not bode well for growth.
Nor does the now negative growth rate in housing starts.
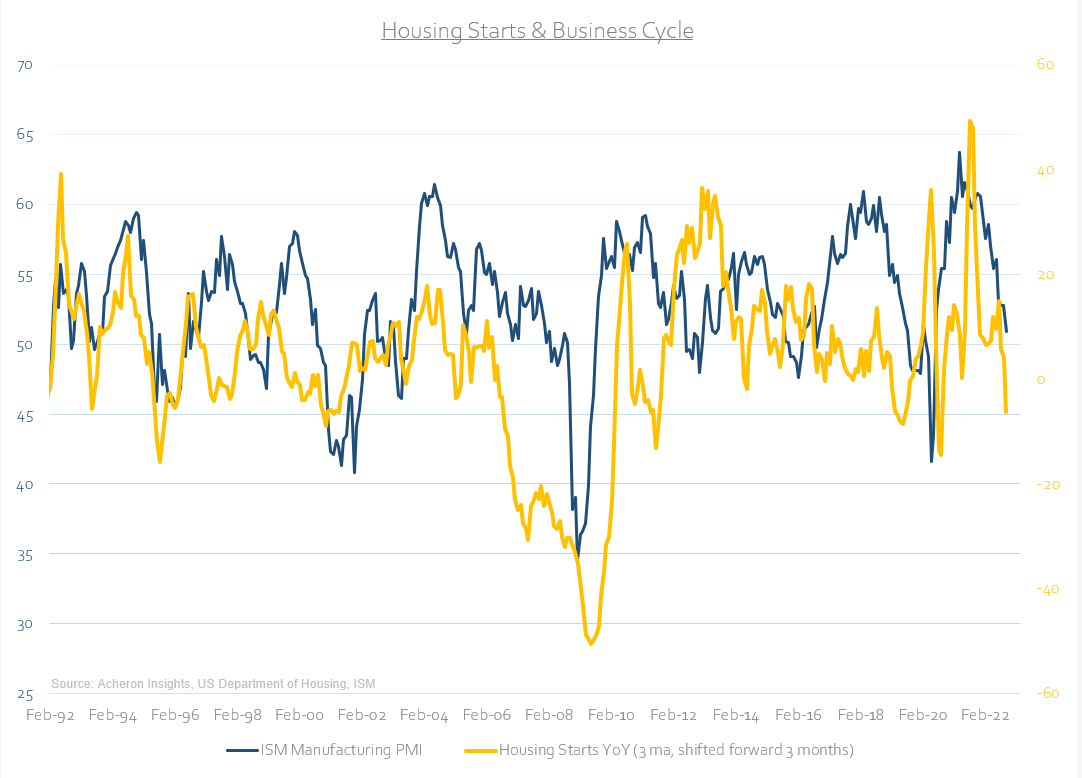
As we can see, based on the long-leads of the growth cycle, we should continue to expect the general direction to remain downward over the six months or so.
While the long-leading indicators allow us to assess where the trend in growth is headed over the medium term, the short-leads provide insight into where growth is headed imminently. Importantly, when the direction of both the short and long-leading indicators align, we can have great confidence in assessing the immediate outlook for the economy and as investors adjust our portfolios appropriately.
Short-Leading Indicators
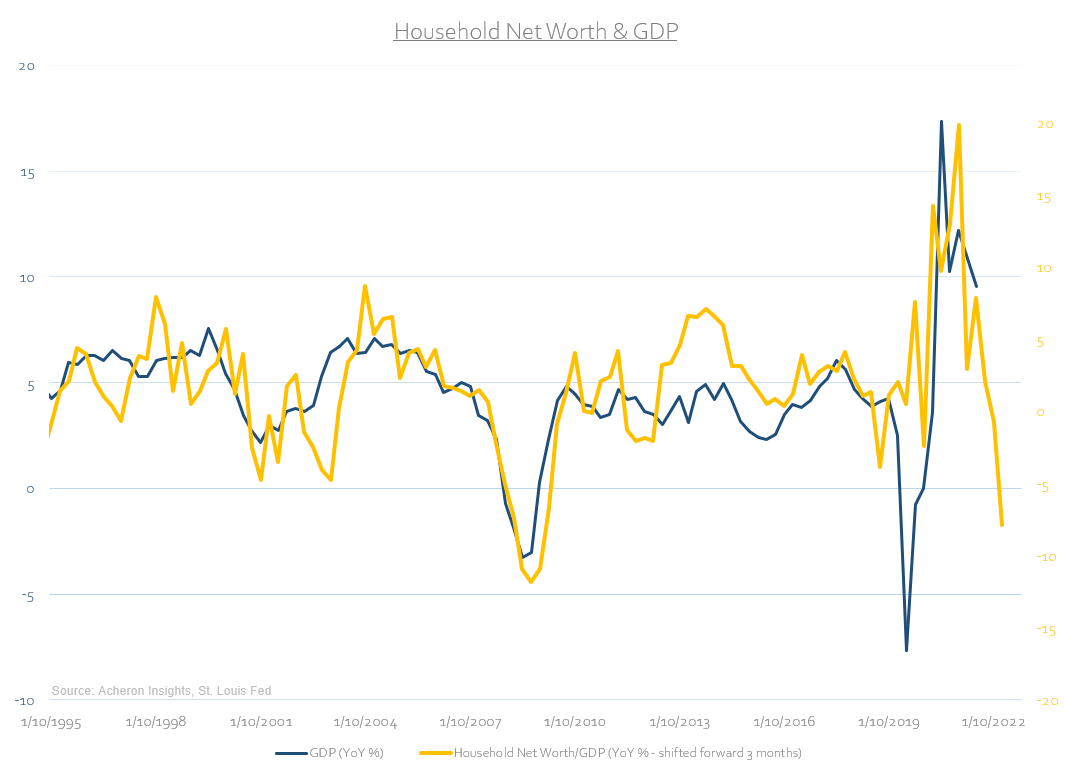
Firstly, given how financialised the economy has become in recent times, much of consumption is driven by the changes in household net worth, which itself is a function of asset prices (particularly housing). Here we can see how much of an impact the slowdown in the housing market and stock market has on the growth cycle, with the negative year-over-year growth in household net worth as a percentage of GDP telling us growth is set to slow materially in the coming months.
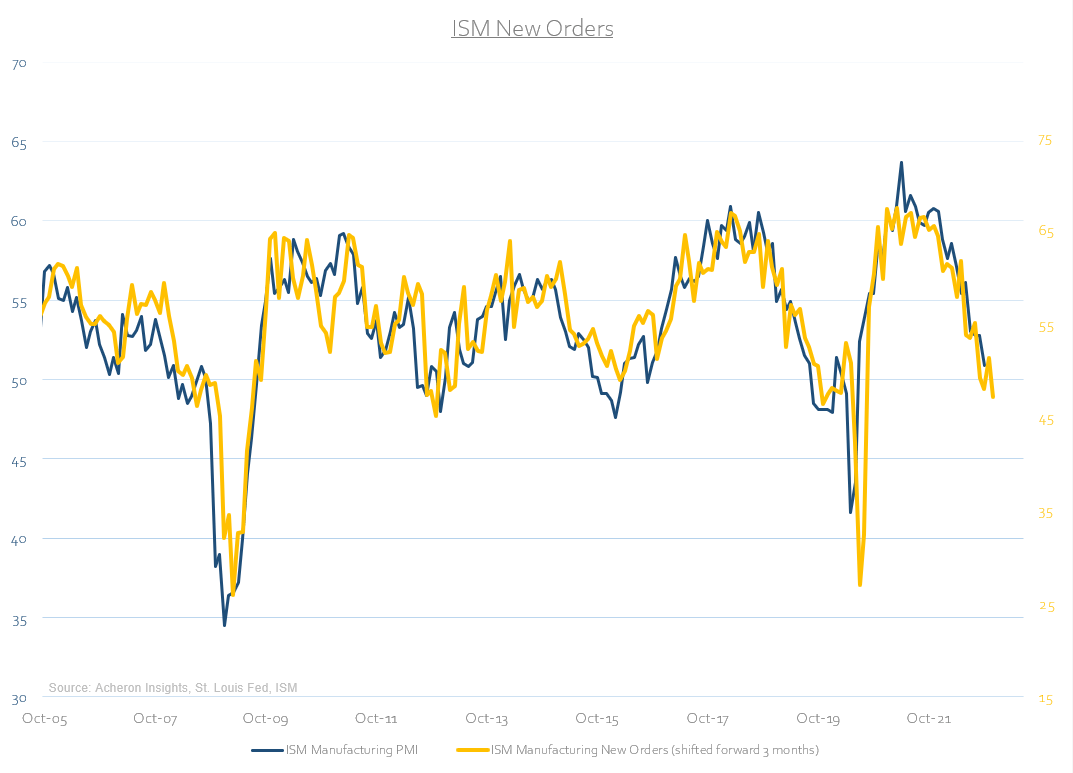
In the manufacturing sector, we can see how the New Order subcomponent of the ISM survey is pointing to a sub-50 PMI reading, suggesting that manufacturing activity is set to deteriorate meaningfully in the short term.
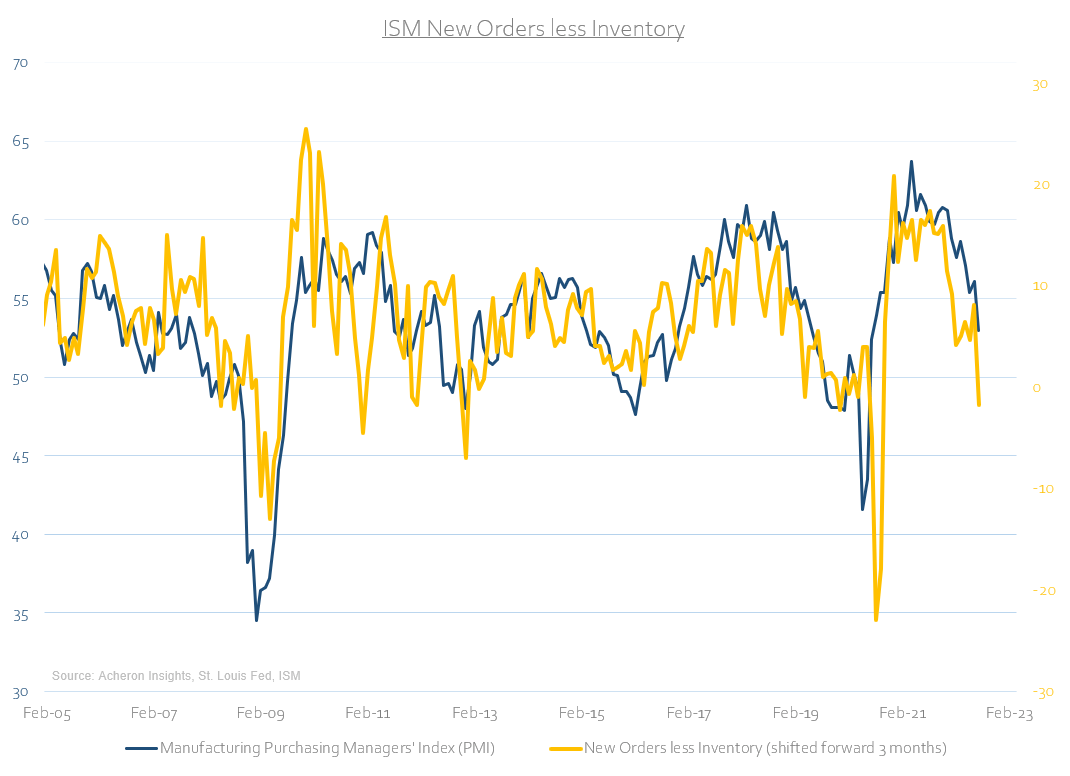
The spread between the ISM New Orders and Inventory subcomponents are suggesting the same thing. As such, we should expect industrial production to roll over in the months ahead.
The Economic Cycle Research Institute’s Weekly Leading Index is too suggesting the growth slowdown will continue in the short term.
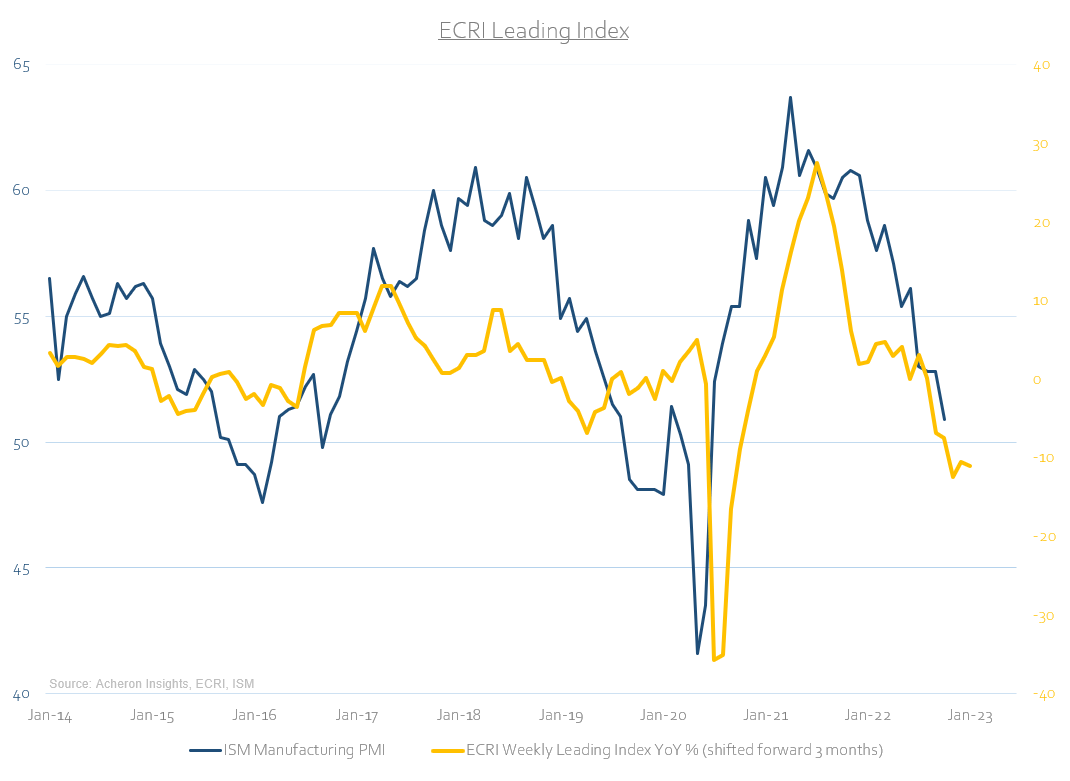
Clearly, a sub-50 PMI reading looks to be on the cards imminently, and, given both the short and long-leads of the growth cycle are trending lower, we could well see a meaningful deterioration in growth as we close out the year.
Market Data & Pricing
If we turn now to what financial markets are pricing in and to assess whether they are reflecting the forward outlook of the economy, what we can evidently see is how defensive areas of the stock market (i.e. defensive equities, low volatility, dividend) have largely outperformed since the latter stages of 2021, with the Quality factor being the exception. This should be expected given the current and forthcoming direction of growth.
StockCharts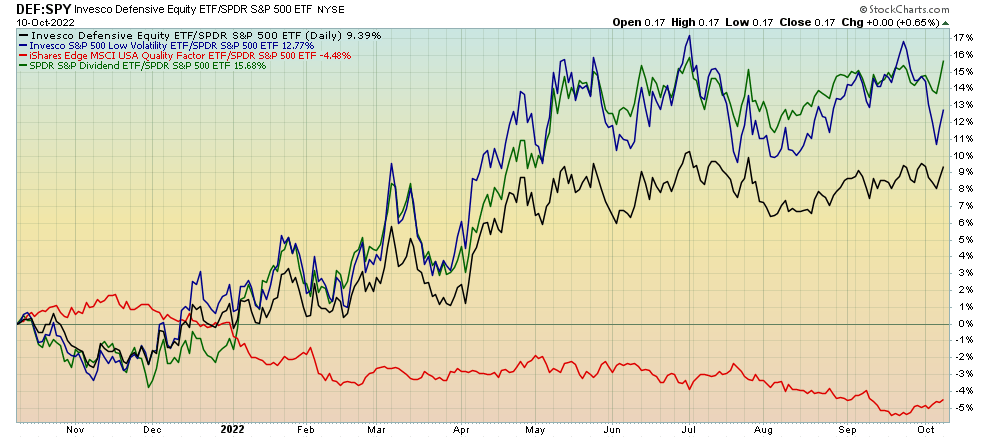
What is also evident is how the areas of the market closely linked to the cyclical economy and demand destruction are all performing poorly, with both industrial commodities and copper breaking down of late (both on an absolute basis and relative to gold).
StockCharts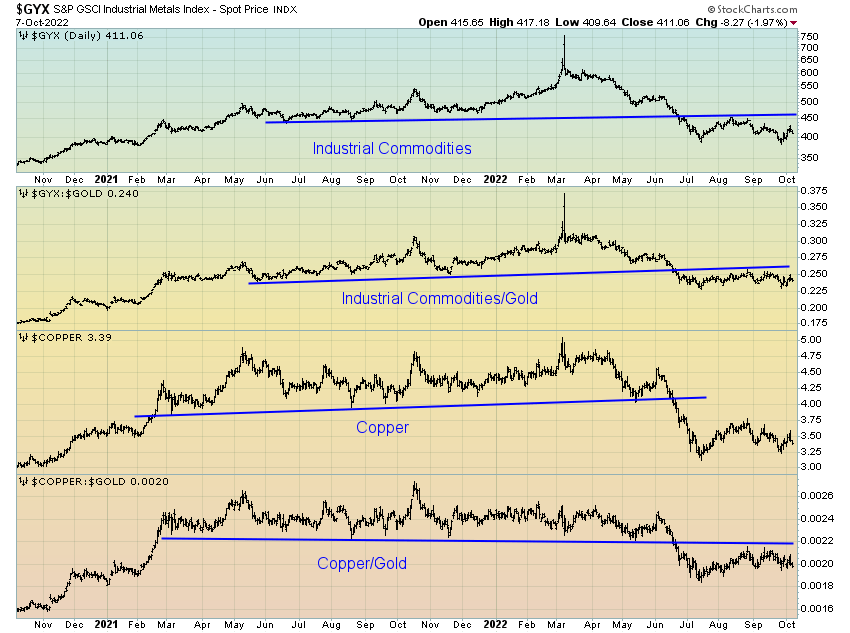
The same can be said of the demand sensitive commodity currencies in the Aussie dollar, Norwegian krone and Brazilian real.
StockCharts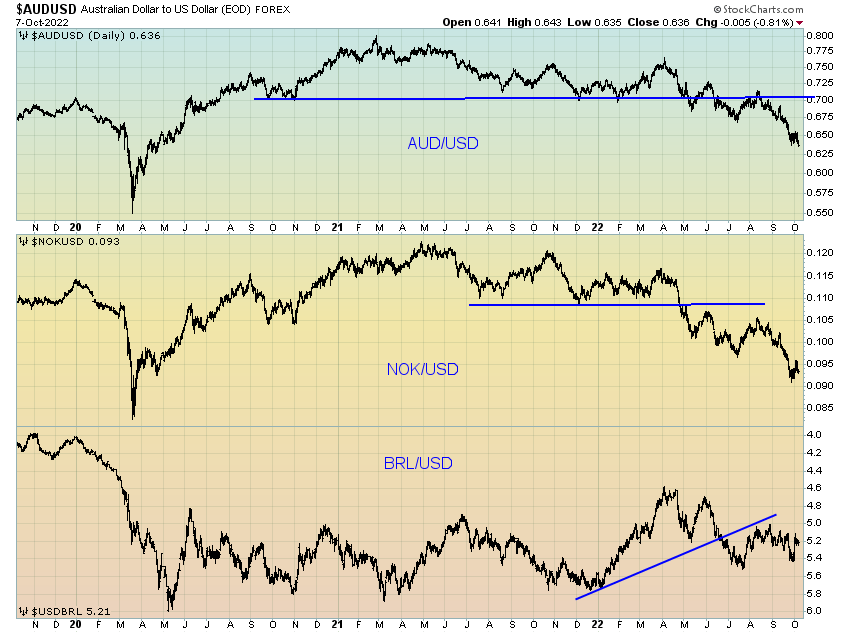
If we try to assess how much of this growth slowdown has actually been priced into markets on the basis we are likely to see a manufacturing PMI reading of around 40-45 per the leading indicators, it appears as though industrial commodities may yet have further downside ahead. Industrial commodities are the areas of the commodity spectrum most closely tied to the economy.
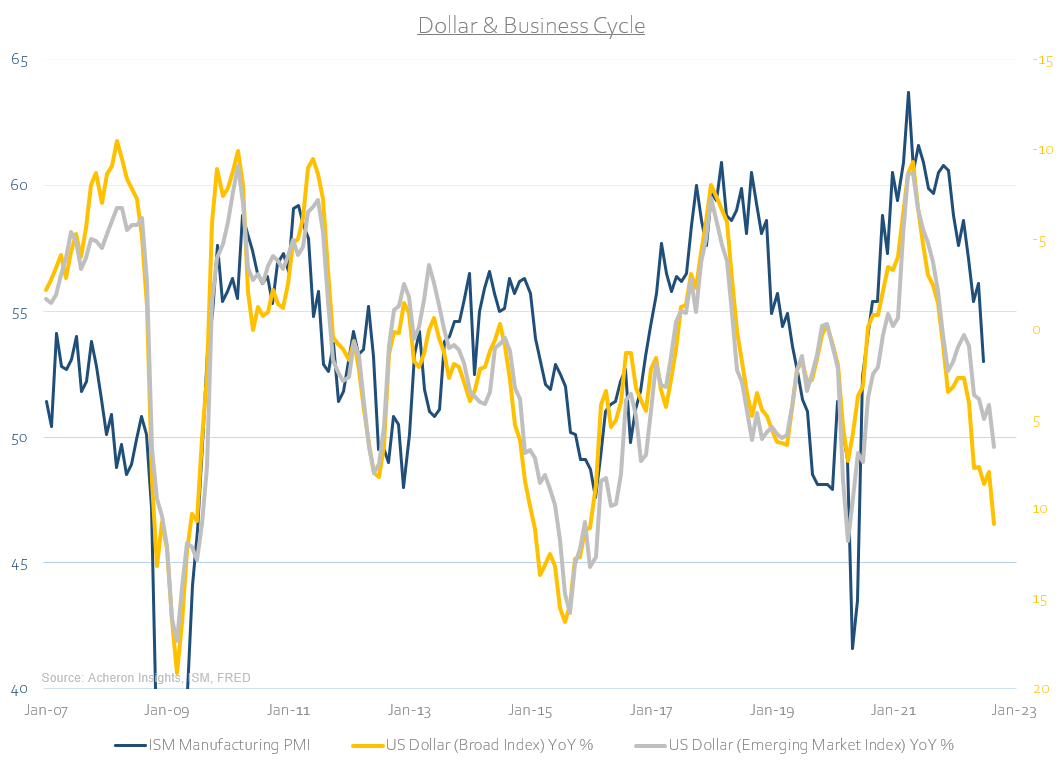
Meanwhile, the dollar too may yet have further upside in the months ahead. Not only is the dollar a result of slowing growth, but it also perpetuates slower growth. The dollar is a true wrecking ball.
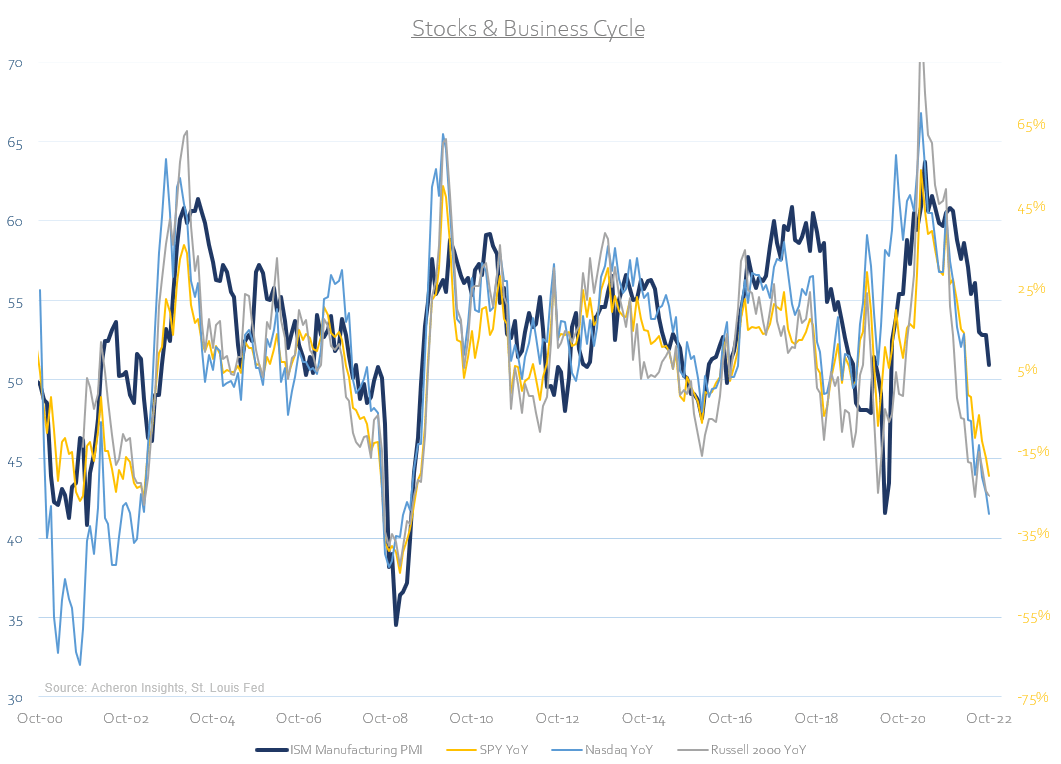
Stocks meanwhile have done a solid job thus far pricing in the economic outlook, particularly via the Nasdaq.
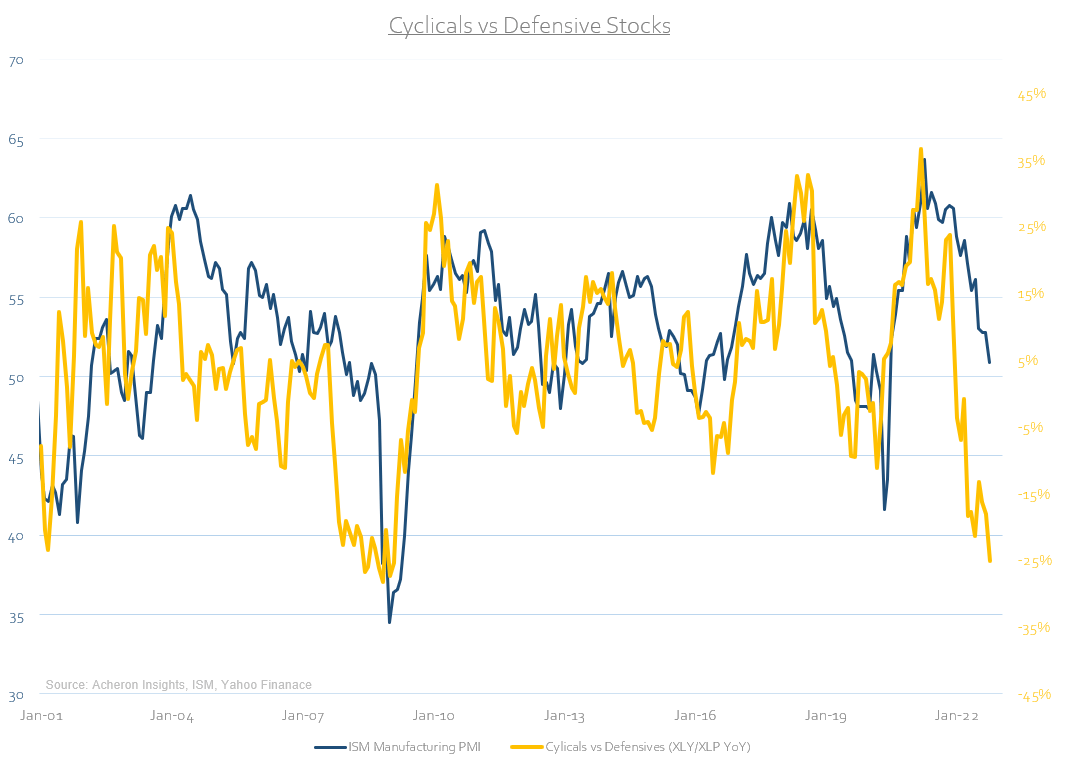
The same can be said of the ratio of cyclical to defensive stocks.
As well as the high-beta/low-beta ratio.
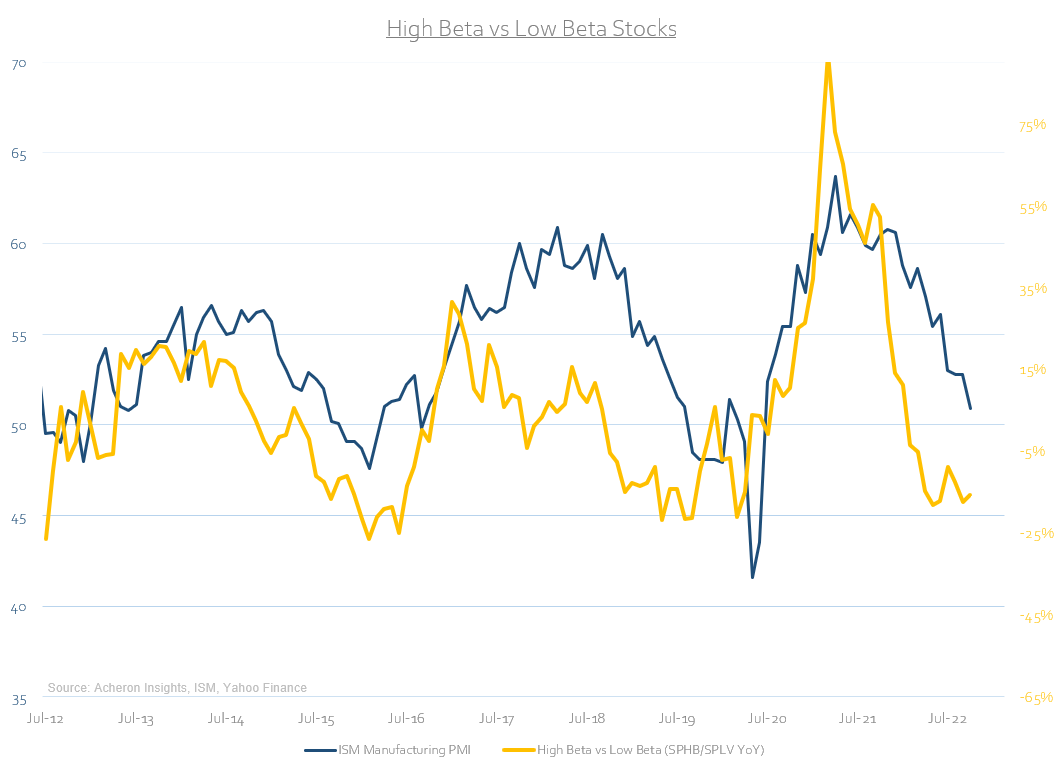
Though some may view this as the stock market having fully priced in the economic downside, we have not yet had an inflection higher in the liquidity cycle, and until we do the upside for risk assets is minimal.
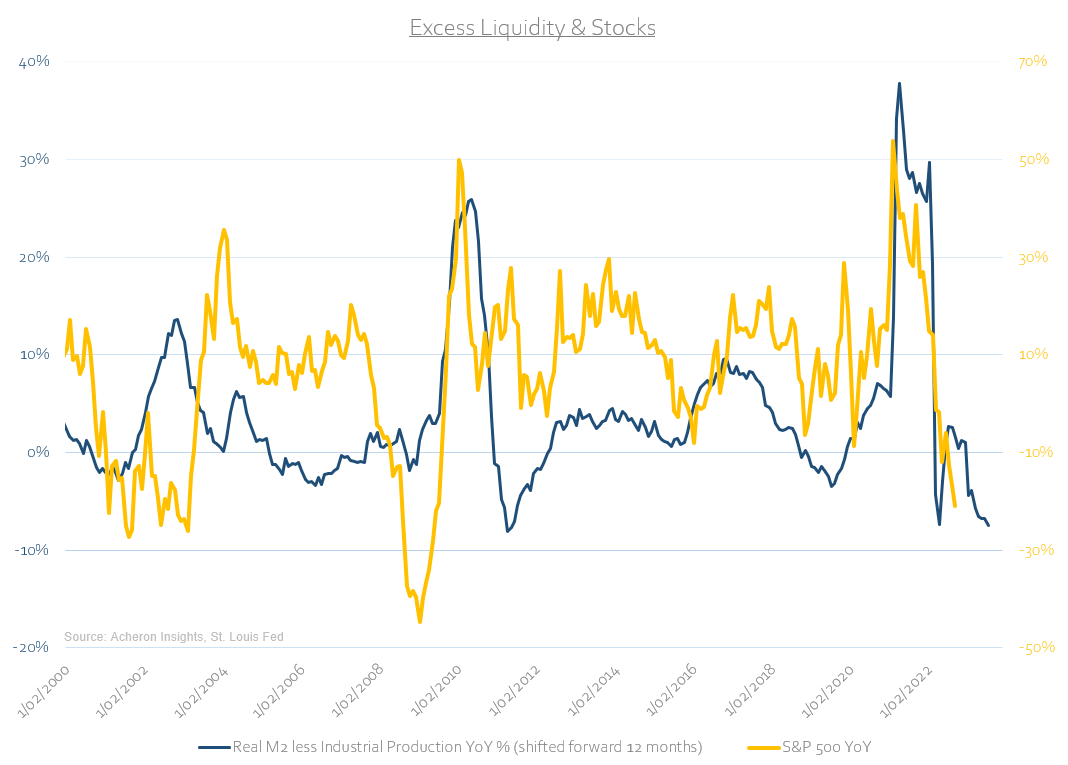
Particularly for those of a high-beta nature.
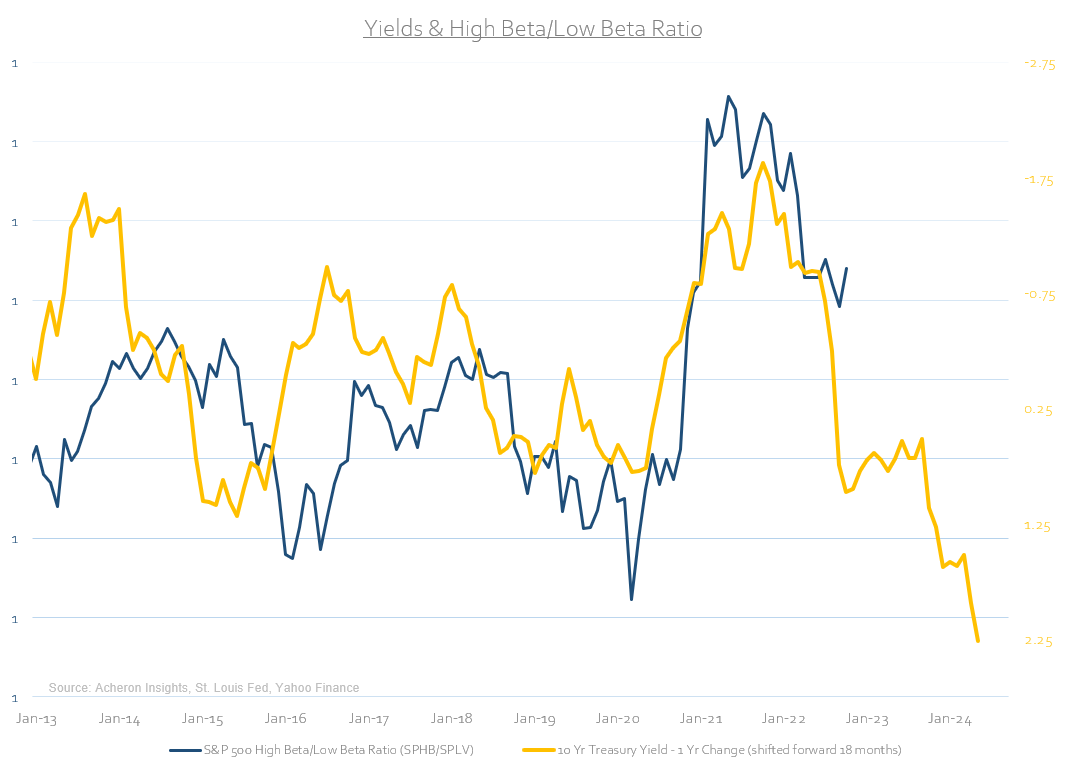
Meanwhile, the largest disconnect evident in asset markets is that of bonds/yield. Based on the outlook for the growth cycle, one could easily consider bonds to be undervalued at present. However, given the liquidity and monetary tightening risks evident in the bond market, the time to buy bonds may not quite be yet (though I suspect it is only a matter of time).
Overall, the cyclical outlook for the economy is clearly poor in the months ahead and despite the fact that stocks in general have done a good job pricing in the growth slowdown, until the liquidity cycle inflects higher, investors and traders would do well to underweight high-beta and pro-cyclical risk assets. Although this thesis may well be proven wrong, my preference is always to be overweight risk with the growth and liquidity cycles as tailwinds, not headwinds.
Household & Consumers From A Structural Perspective
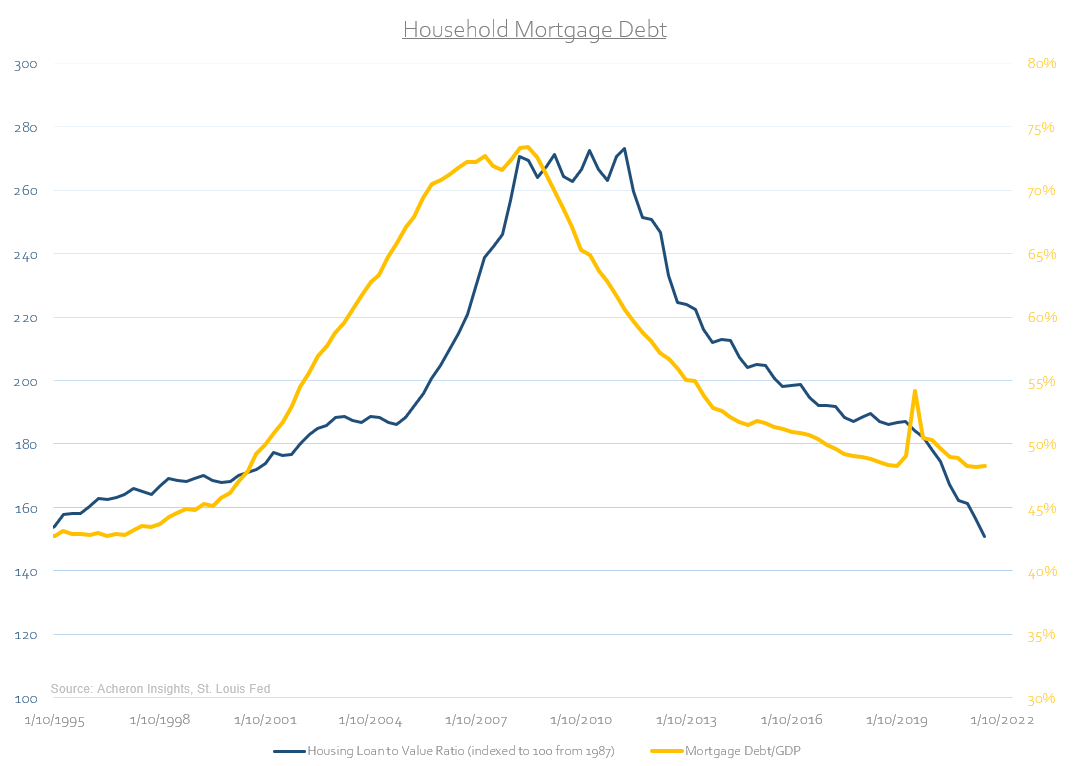
Whilst the cyclical outlook for the economy is poor over the next year or so, what is positive from a structural perspective is the overall health of the consumer and household which remains in good stead.
Indeed, we can see not only is total US mortgage debt relative to GDP near 20-year lows, the same can be said of the average housing loan-to-value ratio. Clearly, this is where the economy differs greatly from that just prior to the GFC.
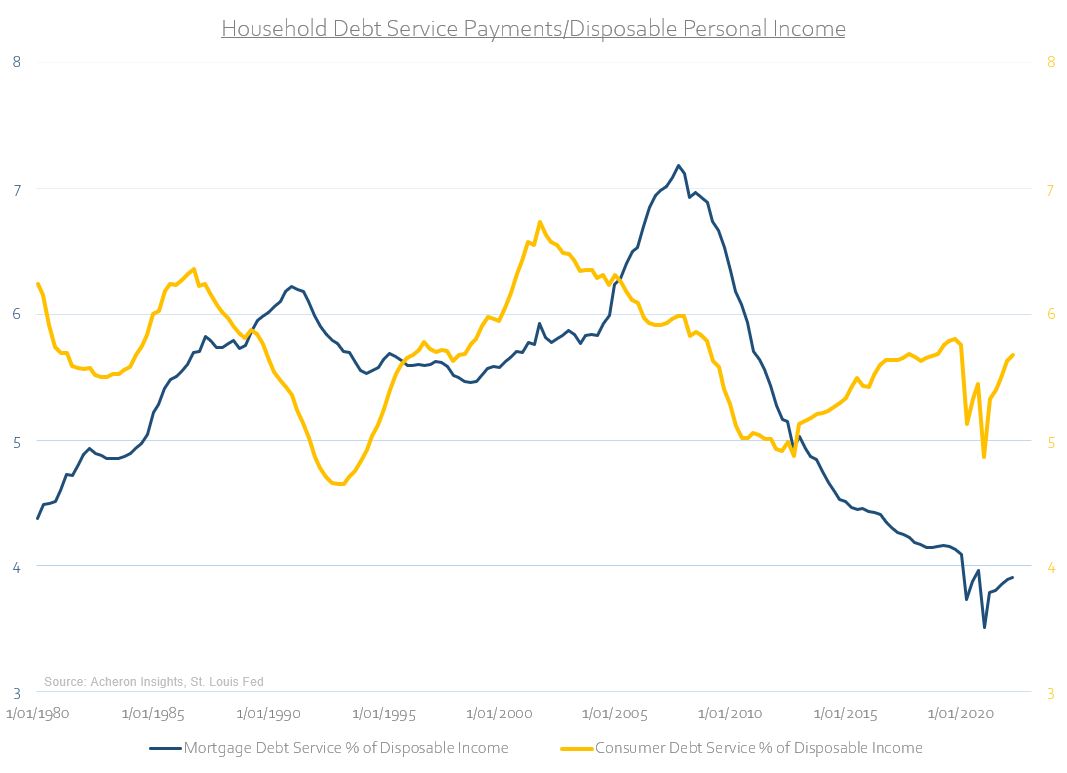
Mortgage debt serviceability for households is too near 40-year lows whilst consumer debt serviceability is roughly in-line with its 40-year average. This is despite households turning to consumer and credit card debt as a void to fill their negative real income growth. Whilst such a dynamic is a cyclical headwind, the ability for households to service their consumer debt is far from any extreme level that could impair households on a structural basis.
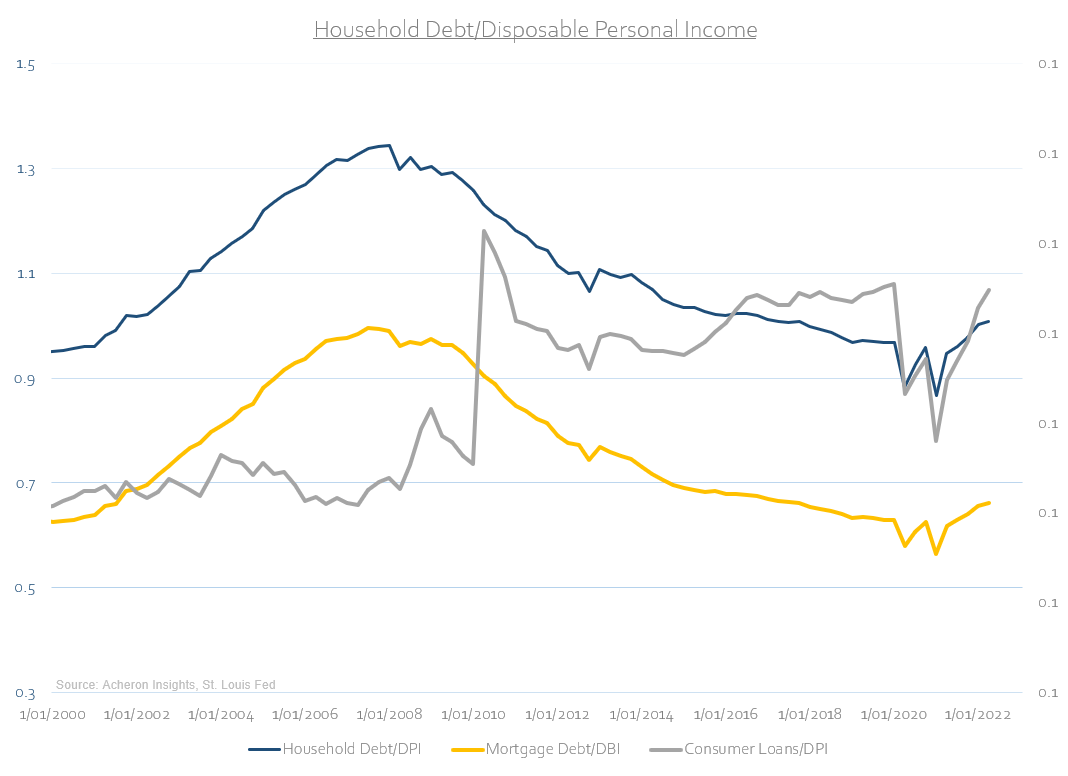
The same trend can be observed when analysing total household debt, mortgage debt and consumer debt relative to disposable incomes.
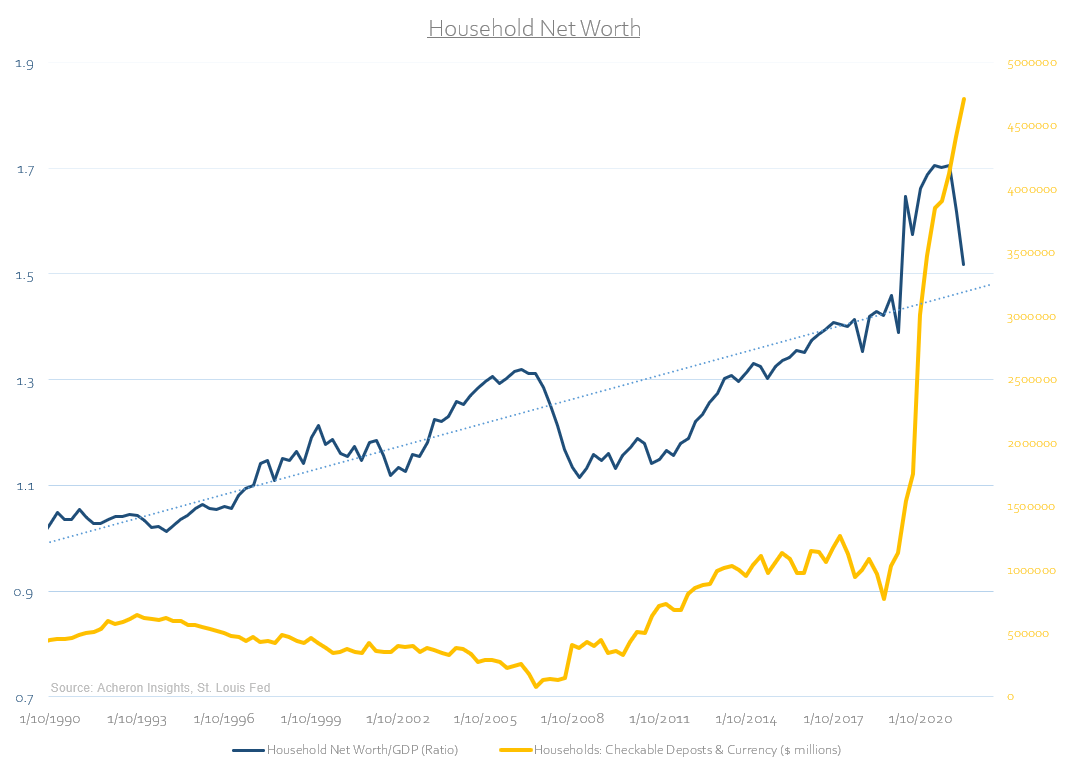
In terms of household net worth, whilst this has taken a significant hit of which is a cyclical economic headwind (and one likely to continue for the time being), total household net worth relative to GDP remains well above its trend, whilst household checkable deposits and currency too is at extremely high levels.
Clearly, although the economy is already within a cyclical slowdown and may well be headed for recession, on a structural basis consumers and households are on solid footing. As such, households will likely hold up well during the impending slowdown and set the stage for the next cyclical upturn whenever that may be.
Be the first to comment