

Jonathan Kitchen/DigitalVision via Getty Images
Introduction
As it has been a year since I last looked at Graphic Packaging (NYSE:GPK) an update is way overdue. Fortunately the share price has performed rather well and I think the only reason why the stock is up ‘just” 20% since my previous article wherein I explained my bullish thesis are the macro headwinds and the uncertainty surrounding the world economy. The inflationary aspect also played a role but seeing how Graphic Packaging was able to pass through the higher cost of its raw materials to its customers is very encouraging. Back in July last year, I argued the stock should be trading at $25. Fast forward one year and I think $30 would be a more realistic near-term to mid-term value for the stock.
Back in February 2021, I argued investors should be patient and wait for 2022 to see the free cash flow accelerate as GPK was completing some expansion plans. The stock is up about 40% since that article was published while the S&P 500 was flat over the same 17-month period.
The income statement looks excellent as GPK was able to hike prices for its customers
Graphic’s performance in the second quarter was much stronger than I had anticipated. The revenue increased by more than a third to just under $2.4B and although the company definitely had to deal with higher cost inputs and SG&A expenses, its operating income increased by approximately 60% to $152M. That’s even more remarkable considering there were about $102M in expenses related to non-recurring restructuring events compared to “just” $34M in the second quarter of last year. These non-recurring expenses in Q2 of this year were mainly related to Graphic Packaging writing off its Russian activities. Excluding these restructuring expenses, the operating income would have been $254M compared to $129M in the same quarter in the preceding year.
GPK Investor Relations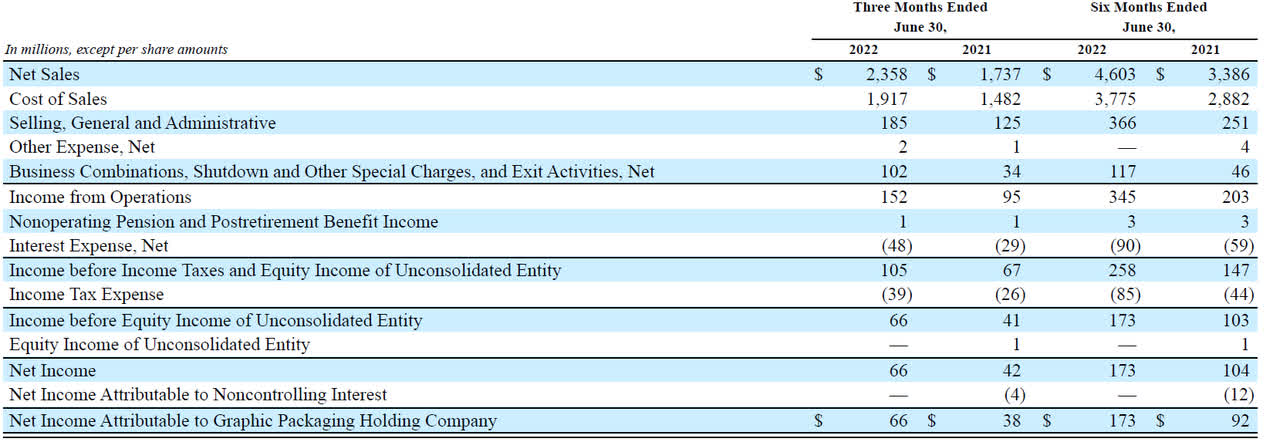
A large portion of the improvement was related to the acquisitions of Americraft Carton and AR Packaging assets. These acquisitions were completed in the second half of last year and that makes it more difficult to fully compare the H1 results of this year with last year’s results. As the future is more important than the past, I will look at Graphic Packaging from a “current” perspective.
The pre-tax income increased to $105M which is just $38M higher than in the second quarter of last year and this was obviously caused by the higher interest expenses as Graphic Packaging added more debt to its balance sheet when it completed the acquisitions.
GPK Investor Relations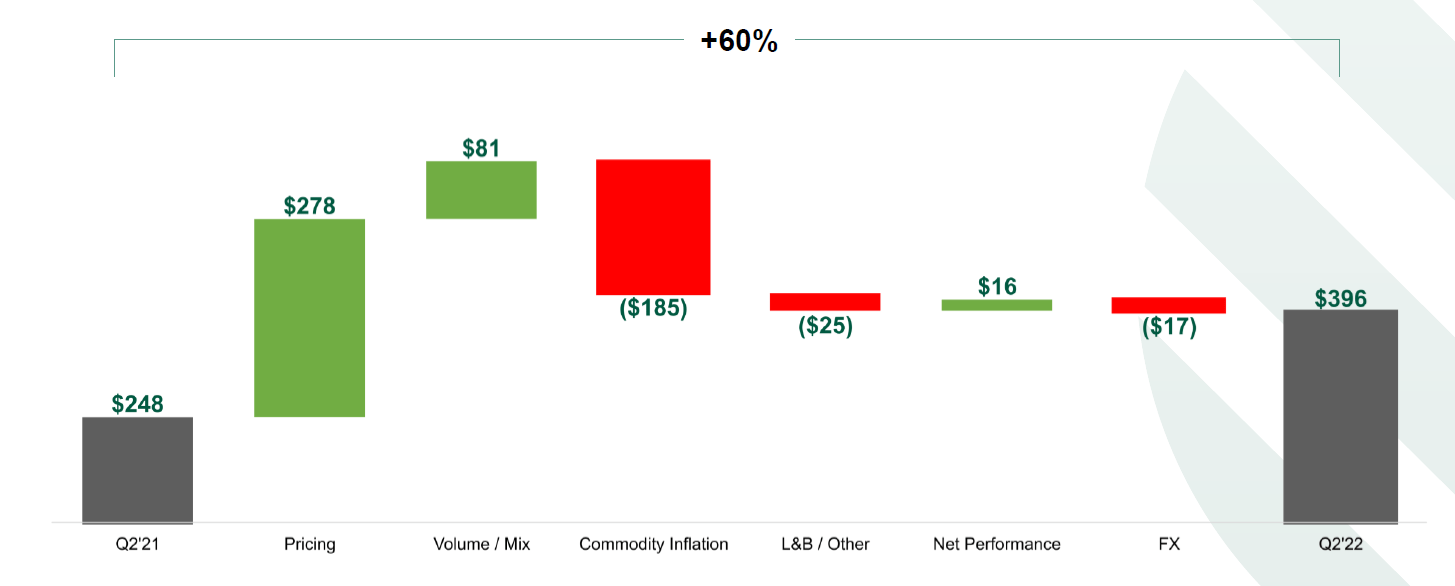
The EPS of $0.21 in Q2 and $0.56 in the first half of the year may look disappointing, but anyone who looks at Graphic Packaging and makes an investment decision purely based on a P/E multiple is dead wrong. Allow me to explain.
The free cash flow result was disappointing but there’s more than meets the eye
A substantial portion of the non-recurring items were non-cash items. It’s an accounting charge without any impact on the company’s cash flow or cash status. We see in the cash flow statement about $92M of these restructuring charges are added back to the operating cash flow which came in at $288M. This includes a $309M change in the working capital position but excludes a $46M payment to a non-controlling interest.
GPK Investor Relations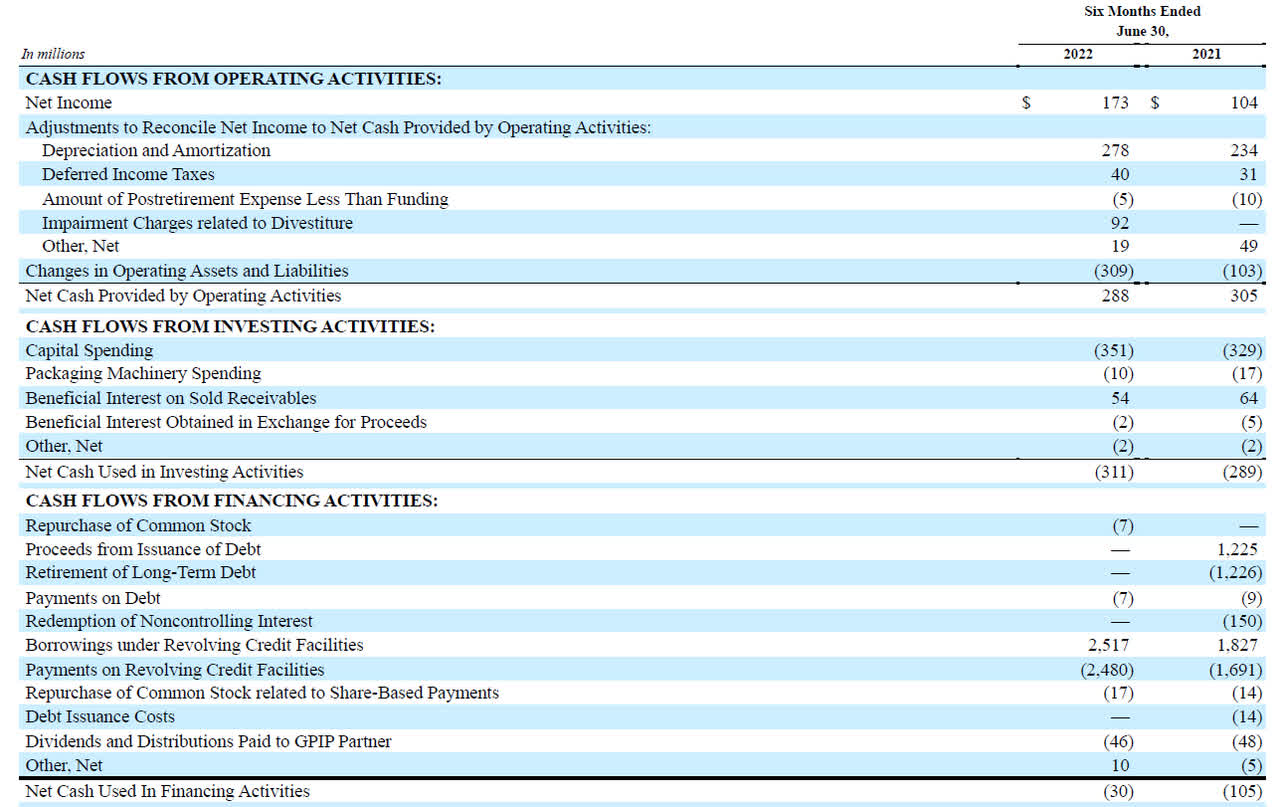
This means the adjusted operating cash flow in the first half of the year is approximately $551M. We also see the capex was approximately $361M for a free cash flow result of $190M. Based on the current share count of approximately 308M shares, the free cash flow per share was $0.62. Higher than the reported net income but not that much higher.
That’s because Graphic Packaging has front loaded this year’s capex. A simple comparison with the updated full-year guidance clearly shows the majority of this year’s capex plans has already been spent now.
GPK Investor Relations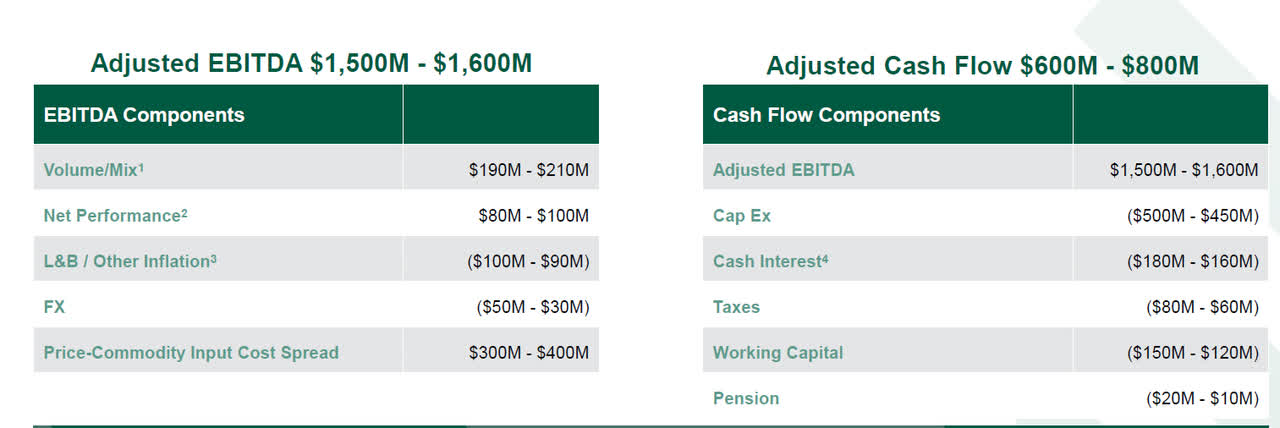
Even if we would use the higher end of the capex guidance of $500M, this implies the H2 capex will be just around $150M, a decrease of more than 50% while the operating cash flows will remain stable. The image above now also allows us to calculate the anticipated free cash flow result. And to err on the cautious side, I will use the most conservative approach here.
With an EBITDA of $1.5B, a capex of $500M and $260M in cash and interest, the adjusted free cash flow this year will be $740M. That’s approximately $2.40/share.
There’s one caveat here: The cash taxes are relatively low at $60-80M but during the conference call it became clear Graphic doesn’t expect to be a material cash taxpayer before 2024-2025. While a higher tax bill is undoubtedly coming, Graphic has some time. And in these 2-3 years it will likely be able to hike the EBITDA further by $50-100M while the cash interest expenses will decrease as the company repays its debt. So even though GPK is currently benefiting from an advantageous tax treatment which has a finite life, I don’t expect a material change in the after-tax free cash flow once GPK sees its tax-related cash outflow normalize.
Investment thesis
I think the market is still misinterpreting Graphic Packaging Holding due to a combination of factors. First of all, the EPS was severely held back by an impairment charge, and excluding this, the H1 EPS would likely have been closer to $1/share. Secondly, the capex was very much front-loaded and the capex in the second semester will be substantially lower than in the first semester. This will allow Graphic Packaging to show the market the strength of its underlying business and rapidly reduce the net debt as a direct consequence. Later this year a $250M 4.875% bond will mature (in November) and Graphic Packaging should have enough cash on hand to just fully pay off this debt at maturity, saving about $12M in interest expenses on an annual basis. This would increase the free cash flow per share by $0.03 per year.
Considering the company will likely report an underlying free cash flow of $2.40 per share, I think the stock should be valued at $30. Not only would this represent an 8% free cash flow yield, it also would represent a multiple of just over 9 on an EV/EBITDA basis. And that multiple will decrease fast as GPK only pays a$0.30 dividend on an annual basis which means it needs less than $100M to cover the dividend. The consequence is that there will be in excess of $600M per year on the table to rapidly reduce the net debt. Assuming a net debt decrease to $4.5B by the end of next year, the current share price represents an EV/EBITDA multiple of 7.3 (and rapidly decreasing).
Be the first to comment