

PeopleImages/iStock via Getty Images
Introduction
In our last coverage on Grab (NASDAQ:GRAB), we suggested that Grab is investible below $4.30 because it does not assume full recovery of Grab’s estimated $1.8bn revenue from its mobile business segment.
In hindsight, this decision not to price in any material recovery in Grab’s mobility segment proved to be the right call. For instance, Grab’s gross merchandise value (GMV) shrunk in 2021Q3 as Grab’s mobility GMV in Vietnam got erased due to the region’s COVID lockdown (Fig 1).
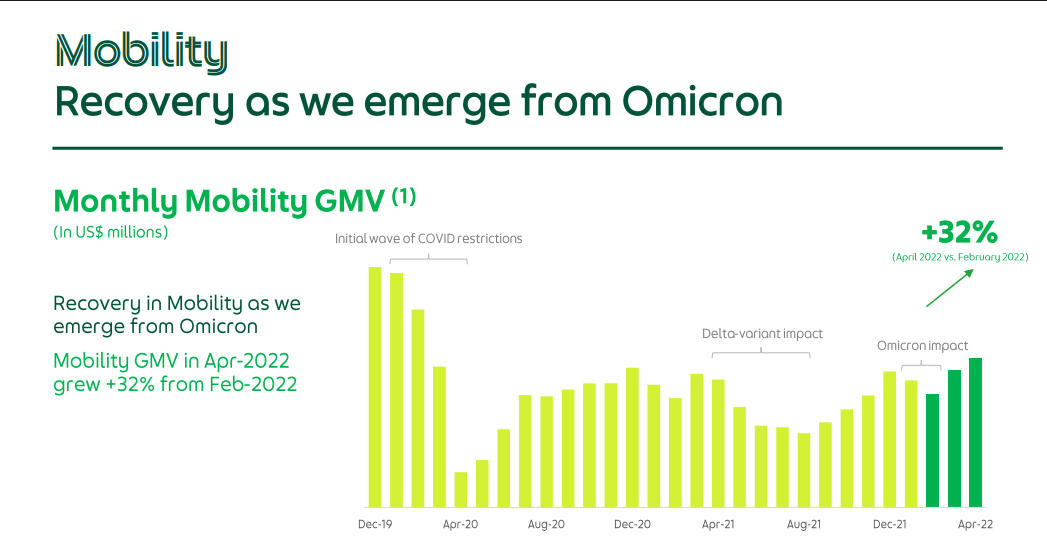
2 quarters later, Grab’s mobility segment has yet to materially recover to pre-pandemic levels even though the Southeast Asian countries have begun living with COVID. According to Grab, its mobility segment is only about 50% of pre-pandemic levels as of April 2022 (Fig 2).
Now that Grab is trading well below our suggested price, the objective of this article is to examine the state of Grab coming out of COVID lockdowns to determine whether investors should invest in Grab now.
Fig 1. Grab’s GMV Got Erased in Vietnam in 2021Q3 (Grab) Fig 2. Grab’s Mobility Segment is still 50% of pre-pandemic levels (Grab)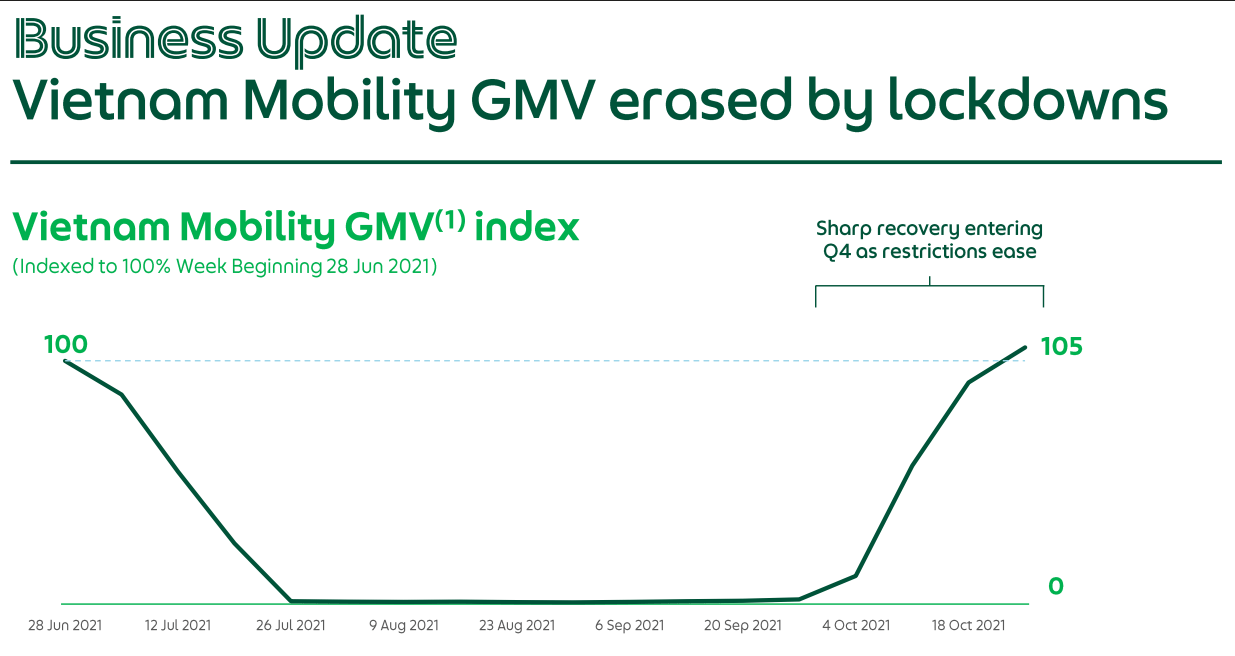
The State of Grab Coming Out of COVID Lockdowns
Data shows that Grab’s growth momentum remains strong. Without looking at incentives paid to consumers and mobility/delivery partners, the activity level (measured in GMV) on Grab is growing at about 10% QoQ since 2021Q1. According to Euromonitor, Grab has the biggest and majority market share in Southeast Asia (SEA) (Fig 3).
Fig 3. Grab has majority and biggest market share in mobility, delivery, and e-wallet market segment (Grab)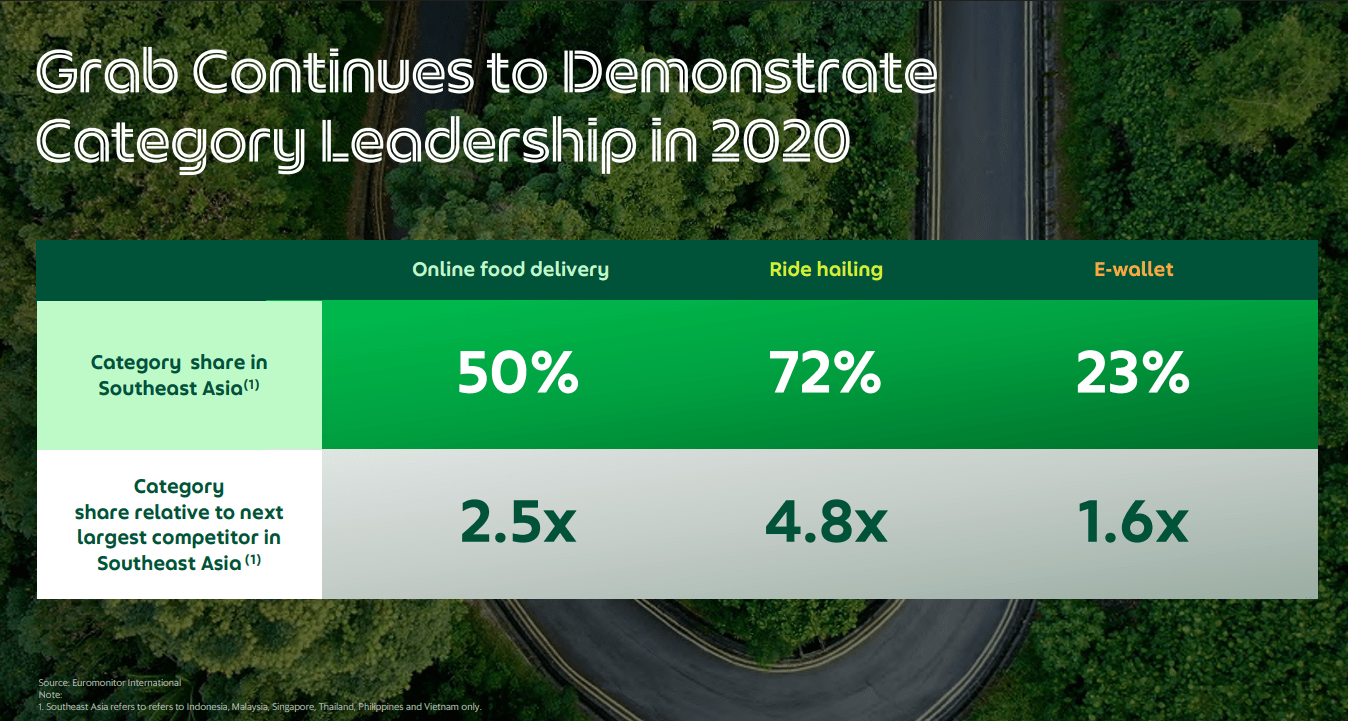
It is also important to mention that Grab’s growth is evenly distributed across Grab’s 4 business segments (Table 1). This reflects the synergy among Grab’s business segments and the resulting network effect. Grab stated that engaged users spend more. In other words, the longer a user is retained on the platform, the more the user will spend over time. Hence, the network effect.
Table 1. GMV ($bn) of Grab’s Business Segment Since 2021Q1
| QR | Deliveries | Mobility | Financials | Enterprise Initiatives | Overall |
| 2022Q1 | 2.56 | 0.83 | 1.36 | 0.05 | 4.80 |
| 2021Q4 | 2.40 | 0.77 | 1.28 | 0.05 | 4.50 |
| 2021Q3 | 2.32 | 0.53 | 1.15 | 0.04 | 4.04 |
| 2021Q2 | 2.07 | 0.69 | 1.11 | 0.03 | 3.88 |
| 2021Q1 | 1.70 | 0.81 | 1.11 | 0.03 | 3.64 |
Source: Author
Fig 4. Grab’s retained users spend more over time (Grab)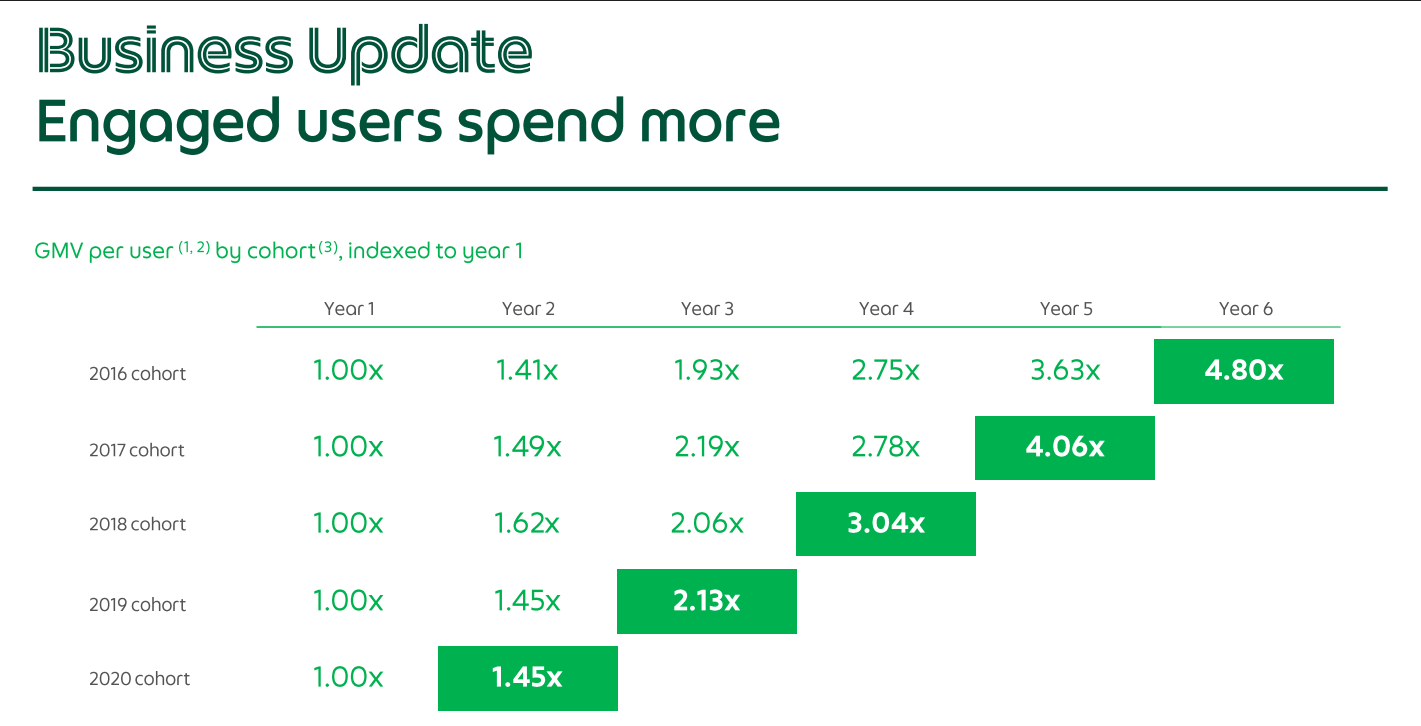
Unfortunately, we cannot deem Grab’s network effect nor its leadership in the mobility, delivery, and e-wallet segment as a competitive advantage and moat yet. This is due to Grab’s large expenditure on incentives for its customers and partners (riders) to maintain market share. This is also the reason why revenue has not been growing in proportion to GMV (Table 2).
Table 2. Disproportional Growth Between GMV and Revenue
| QR | Revenue ($mil) | GMV ($bn) |
| 2022Q1 | 228 | 4.8 |
| 2021Q4 | 122 | 4.5 |
| 2021Q3 | 157 | 4.038 |
| 2021Q2 | 180 | 3.878 |
| 2021Q1 | 216 | 3.644 |
Source: Author
For instance, Grab’s delivery segment GMV grew 3.5% QoQ in 2021Q3, but revenue dropped 98% to only $1mil from $49mil. Grab explained that:
Q4 Revenue for deliveries declined 98% YoY to $1 million as Grab invested in incentives to maintain its category leadership and to grow adoption of new services.
Therefore, we could equate Grab’s leadership with the willingness to “burn cash” (provide incentives to both partners and customers). This is acknowledged by Grab to a certain degree where the company explicitly stated that competitors are spending even more on incentives than Grab.
Fig 5. Competitors have to spend more on incentivizing customers and suppliers (riders) than Grab to compete for market share. (Grab)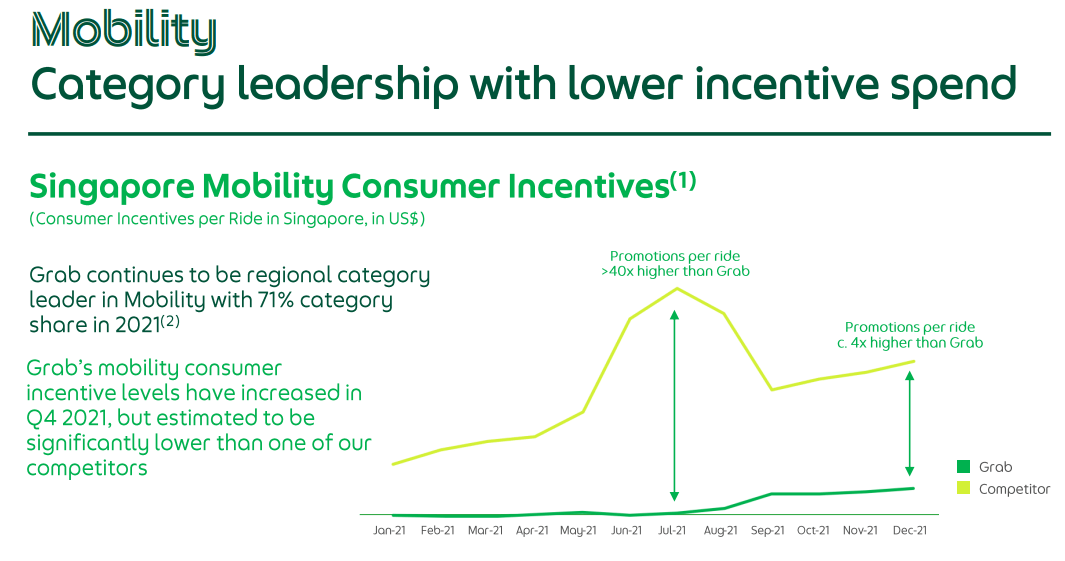
If that’s the case, then just maybe, Grab has a competitive advantage. Who else could burn in excess of $500mil quarterly on incentives? Unfortunately, the stated competitor incentives expenditure is only based on internal estimates and it is limited to Singapore. Therefore, we cannot establish any thesis to support Grab’s moat.
What we can say for certain is that Grab is aware of its incentive expenditures. Grab stated that:
Looking ahead, we are focused on growing sustainably by being disciplined with our capital, optimizing our fixed cost base and tapering our incentive spend as the market rationalizes.
Much like Arjen Robben’s signature cut in from the right, predictable but unstoppable, there might be little Grab can do to reduce incentives in the near term.
Shortage of Drivers/Riders Forces Grab to Keep Partner Incentives High
As of March 2022, Grab’s supply of drivers for its mobility segment has recovered to 76% of pre-pandemic levels. However, that figure fell below 70% in May 2022. In Malaysia, active drivers dropped 30%. Among the active drivers, about 30% of active drivers were voluntarily inactive during peak hours as fulfilling rides during severe traffic congestion is uneconomical. As a result, fares rose as high as 400% during peak hours to try to attract drivers. Peak hours are defined as 7 am to 9 am and 5 pm to 8 pm. However, passengers also reported peak-hour rates spilling over to non-peak hours (Fig 6).
Fig 6. Passengers showing peak-hour rates spilling over to non-peak hour rides since April (Neesha / FreeMalaysiaToday.)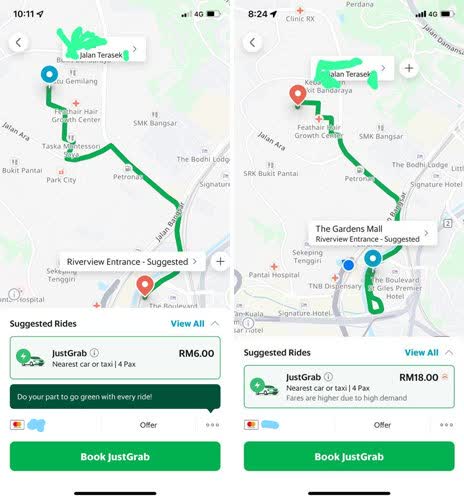
In situations where Grab cannot afford to increase financial incentives to drivers, Grab will pass that burden onto the customers by increasing base fare rates. For instance, Grab Philippines is trying to increase the fare as Philippines Grab drivers are earning 10%-20% less due to fuel price increases. Grab Singapore has also increased fares by SGD 1.
As a result, the number of users opting for taxis instead has increased by 40%. We can say that Grab lost its opportunity to recover to pre-pandemic levels due to the shortage of drivers such that the company lost customers to other competing ride-hailing services.
Higher fares should be beneficial to Grab, especially now that demand for its mobility is showing a strong recovery. However, the side-effect of price spikes and the shortage of drivers is customer attrition. We’ll need to wait for the Q2 report to assess the impact of this side-effect.
Grab responded to this problem by introducing a series of incentive policies to attract drivers such as the following:
- Sign-up bonus ($250 equivalent)
- Referral bonus ($70 equivalent)
- Up to 100% subsidy to meet regulatory compliance (training)
- Other incentives include vehicle rental rebates, job completion bonuses in high-demand areas, and cash rebates based on the number of job completions during designated hours.
Grab’s incentives expenditure on partners (merchant and drivers/riders) has already been increasing QoQ (Table 3). The series of new incentive policies are expected to continue inflating Grab’s incentive expenditure.
Table 3. Grab’s Expenditure on Partner Incentives
| QR | Partner Incentive ($mil) |
| 2022Q1 | 216 |
| 2021Q4 | 218 |
| 2021Q3 | 187.4 |
| 2021Q1 | 139 |
Source: Author
For these reasons, we do not think that incentive expenditures will normalize nor will its mobility segment recover to pre-pandemic levels anytime soon. As a result, Grab could see even more downside.
Could Grab afford to taper incentives?
We don’t think so, not when the competition (for drivers/riders and customers) is heating up. The supply-side (partner) incentive is less than half the equation. Most of Grab’s incentives are spent on the demand side. In 2021Q4 and 2022Q1, Grab’s incentive expenditure on the demand side is 67% and 60% respectively higher than the incentive for the supply side (Table 4).
The increasing competition from Capital A (formerly known as AirAsia), Gojek, and other regional players (e.g. InDriver) is expected to put more pressure on Grab to maintain or even up its incentive programs to maintain market share.
Given that overall incentive expenditure has been growing QoQ and the happenings in 2022Q2, we do not expect it to normalize in the near term.
So the question now turns to the effectiveness of Grab’s incentive programs.
Grab’s incentive programs are indeed losing momentum. This is reflected by the GMV growing slower than incentive expenditure (Table 5). We think that investors should be too concerned because this is to be expected since Grab has the majority market share and is leading by large margins.
On the other hand, when we compare the incentive-to-revenue ratio from 2021Q1 to 2022Q1, Grab’s revenue is about the same while incentive expenditure increased 72%. The quarters in between did not fare well in this department as well.
When we consider revenue as a function of the number of users and time spent on the platform (Fig 4), and that Grab has a supply-side shortage, Grab’s incentive program can still be considered effective.
The number of users (MTU) grew 30% since 2021Q1. Over time, revenue is expected to catch up. As the supply of drivers/riders recovers, we expect Grab to quickly realize revenues from the newly acquired users.
Table 4. Growing Incentive Expenditures
| QR | Revenue ($mil) | GMV ($bn) | Consumer Incentives ($mil) | Partner Incentive ($mil) | Total Incentives | Incentive: Revenue Ratio | Net Loss |
| 2022Q1 | 228 | 4.8 | 344 | 216 | 560 | 2.45614 | 435 |
| 2021Q4 | 122 | 4.5 | 365 | 218 | 583 | 4.778689 | 1103 or 464 |
| 2021Q3 | 157 | 4.038 | 271.1 | 187.4 | 458.5 | 2.920382 | 1,000 |
| 2021Q1 | 216 | 3.644 | 186 | 139 | 325 | 1.50463 | 652 |
Table 5. Growing Proportion of Incentive Expenditure over GMV reflects Diminishing Return
| QR | GMV ($bn) | Consumer Incentives ($mil) | Partner Incentive ($mil) | Total Incentives ($mil) | Proportion of Incentives over GMV |
| 2022Q1 | 4.8 | 344 | 216 | 560 | 12% |
| 2021Q4 | 4.5 | 365 | 218 | 583 | 13% |
| 2021Q3 | 4.038 | 271.1 | 187.4 | 458.5 | 11% |
| 2021Q1 | 3.644 | 186 | 139 | 325 | 9% |
Source: Author (2021Q2 omitted due to lack of data)
Other Positive Takeaways and Grab’s Road to Profitability
There is a chance for consumer incentive expenditure to normalize sooner than expected because of overwhelming demand relative to supply in 2022Q2. This is supported by the 10% dip in consumer incentives in 2022Q1. It could, but we do not expect it nor do we price it in at this point.
This is a big deal because the clear path for Grab to achieve profitability is to normalize incentive expenditure. Aside from 2021Q3, there’s a clear trend of narrowing losses since 2021Q1. Grab’s losses are now less than incentive expenditures. Hypothetically speaking, if Grab can reduce its incentive expenditure by 77% in 2022Q1, Grab would’ve already achieved profitability.
We perceive Grab’s game plan as outcompeting competitors for market share and then lower incentives to boost profitability. According to Euromonitor, Grab is already leading the market with good margins. Should Grab continue its growth trajectory while consumer incentive shows signs of normalization in 2022Q2, profitability is in sight.
Another positive takeaway is Grab’s healthy liquidity. As of 2022Q1, Grab has $8.2bn of cash while cash flow from operating activities is negative $0.465bn. This provides Grab with about 17 quarters or 4 years’ worth of runway. Operating cash flow is expected to improve as Grab captures more opportunity in the mobility segment (assuming the supply of drivers/riders recovers).
Valuation
Grab is currently priced at $9.14bn. Since we expect improving performance from the recovery of demand and supply for mobility, we annualize Grab’s 2022Q1 performance to be conservative. Grab’s 2022Q1 revenue stands at $0.228bn which is annualized to become 0.912bn. This means that Grab is trading at 10x revenue.
Using Uber Technologies (UBER) as comp, UBER is trading at about 6x 2022Q1 annualized revenue. By this standard, Grab is priced 50% higher than UBER.
However, this doesn’t mean that Grab is overpriced. Grab has net cash liquidity of $6bn. Net cash liquidity is defined as cash liquidity (includes cash on hand, time deposits, marketable securities, and restricted cash) less debt (loans and borrowings). This implies Grab is trading at only 1.5x cash. On the other hand, UBER has $7.8bn of cash liquidity but $9.2bn of long-term debt.
Hence, on net of net cash liquidity basis (market cap less net cash liquidity), Grab is priced at only 3.4x revenue while UBER is priced at about 6x revenue. On this basis, Grab is priced almost 50% lower. This is a great investment value proposition for investors amid a recovering mobility segment.
Verdict
In this article, we showed that Grab is leading by its willingness to spend. This view is supported by the disproportional growth between GMV and revenue and growing incentive expenditures.
We expect partner incentive expenditures to increase in 2022Q2 and 2022Q3 as Grab tries to capitalize on mobility opportunities amid the reopening of economies in Southeast Asia by building its supply of drivers and riders.
Although we expect consumer incentives to also increase, we expect revenue to outpace consumer incentive expenditure. This is because Grab’s current problem is a supply problem while demand is picking up. Furthermore, 2022Q1’s consumer incentive dipped 10% while revenue almost doubled.
According to the valuation net of net cash liquidity, Grab is priced 50% lower than UBER. Despite inflationary pressure and recession, any attempt to dollar-cost average into Grab can be justified at this valuation.
Be the first to comment