

Gold Price Forecast Talking Points:
- Last week was two very different themes in Gold, coalescing around the Q1 close/Q2 open with initial weakness clawed back at the end of the week.
- That scenario is a micronized version of the bigger picture, where Gold was aggressively bullish from March into August last year, after which the yellow metal became aggressively bearish through the end of 2020 and Q1 of 2021.
- Gold price action has set up a potential double bottom formation, which can be confirmed by price action this week if bulls are able to push the matter, and this could open the door to further topside in Gold in Q2.
- The analysis contained in article relies on price action and chart formations. To learn more about price action or chart patterns, check out our DailyFX Education section.
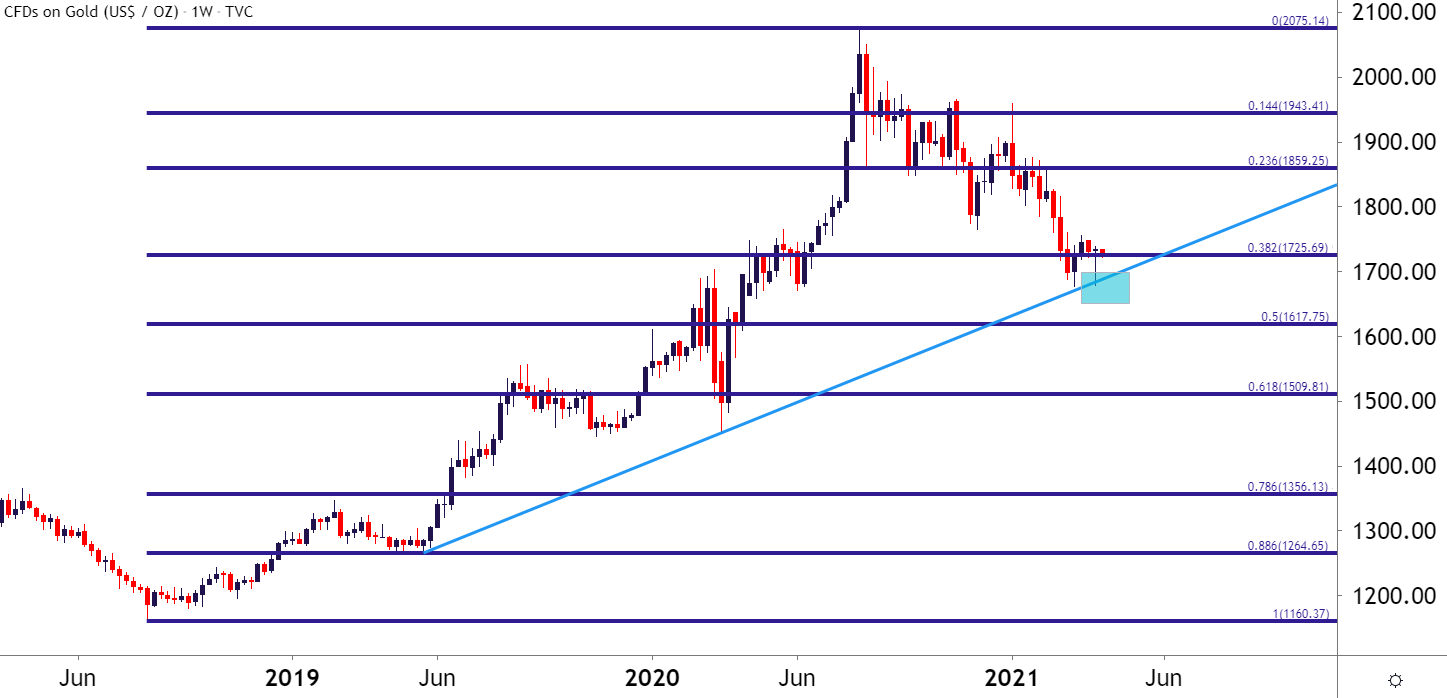
Gold prices lost as much as 14.4% during Q1, taking the high from January 6th to the low on March the 8th. And last week as the door closed on Q1 and opened into Q2, Gold prices remained on the move, plummeting in the first couple days of the week only to claw back those losses to finish the week with a small gain ahead of the Friday close.
Coming in to assist with that bounce last week was a trendline projection that can be found by connecting swing lows from the prior two years. This also plots very near the 38.2% Fibonacci retracement of the recent major move, a key level that was looked at ahead of last week.
To learn more about Trendlines or Fibonacci, check out DailyFX Education
Gold Weekly Price Chart
Chart prepared by James Stanley; Gold on Tradingview
Also of issue to near-term price dynamics in Gold is the bigger-picture look, and whether what we’ve seen in Q1 has been an extension of a pullback that began last August – or whether we’re seeing an entirely new theme in the yellow metal. And to be sure – there are starkly different pictures in Gold depending on the time frame being looked at: The daily chart shows what’s become a pretty nasty downtrend while the weekly and monthly chart make that downtrend look more like a pullback in a longer-term bigger-picture theme.
So, on the monthly chart, we can see where prices are still hovering around the 38.2% retracement of the recent major move, starting in 2018 and running into last year’s August high.
Gold Monthly Price Chart
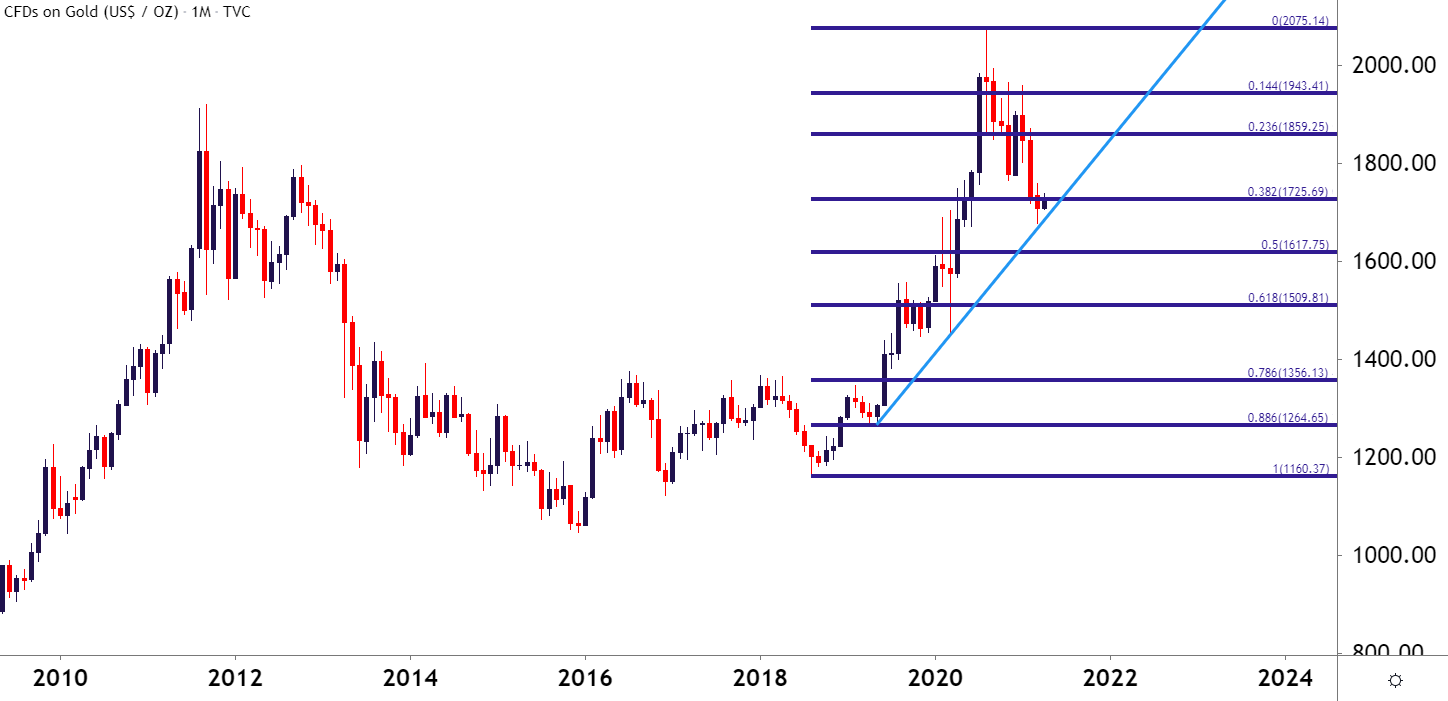
Chart prepared by James Stanley; Gold on Tradingview

Recommended by James Stanley
Access the DailyFX Gold Forecast
Going down to the Daily chart and we can start to focus-in on that recent bearish behavior. Prices have continued to notch fresh lower-lows and lower-highs so far through the early year, and the 1676 level has become interesting as this is the prices that’s helped to mark the March lows.
But what makes it even more interesting is how last week, buyers stepped in right around this same price which, at the time, was confluent with the trendline projection.
This highlights a possible double bottom pattern, which can be confirmed by a bullish breach of the neckline; and this could open the door for continued topside themes in Gold. What makes this exciting is that such patterns will often show up around changes in trends; and given the bigger picture backdrop around Gold combined with the open of a new quarter, the potential for change is in the air, particularly if this pattern can fill-in this week.
To learn more about double bottom patterns and how to work with them, join us in DailyFX Education
Gold Daily Price Chart
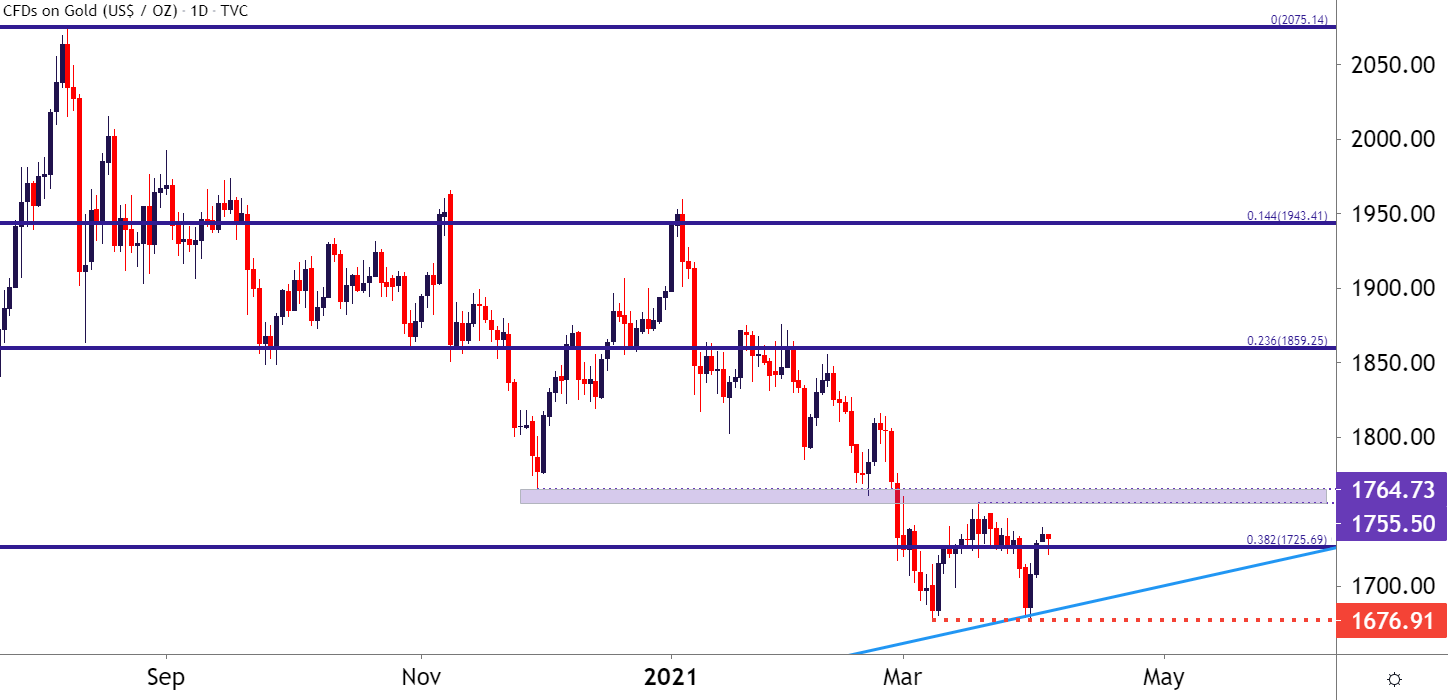
Chart prepared by James Stanley; Gold on Tradingview
— Written by James Stanley, Strategist for DailyFX.com
Contact and follow James on Twitter: @JStanleyFX
Be the first to comment