

- XAU/USD Awaits NFP Data to Provide a Catalyst for its Next Move.
- Potential End of China’s Covid Flight Suspension Assisted Gold Rally.
- Range Between $1614-$1670 Still in Play.
Trade Smarter – Sign up for the DailyFX Newsletter
Receive timely and compelling market commentary from the DailyFX team
Subscribe to Newsletter
Gold (XAU/USD) Fundamental Backdrop
Gold continued its rally higher this morning following yesterday’s bounce of the YTD low. The rally coincided with a retracement in the dollar index as well as markets processing the aftermath of the FOMC meeting. Meanwhile, rumors returned in the Asian session that China are looking at the possibility of opening up air travel after a two-year covid ban which seemed to provide a further boost to market sentiment.
The slight shift in rhetoric by Fed Chair Powell has seen markets price in an extra 25bp to the peak Fed funds rate for 2023. This resulted in dollar strength which saw the YTD low on gold appear vulnerable. This coupled with strong US Treasury yields seemed to suggest a new YTD low and a possible test of $1600 level may be on the cards. As price continues to remain rangebound between $1614-$1670 bears will continue to show interest, which may halt any further upside move as we close out the week.
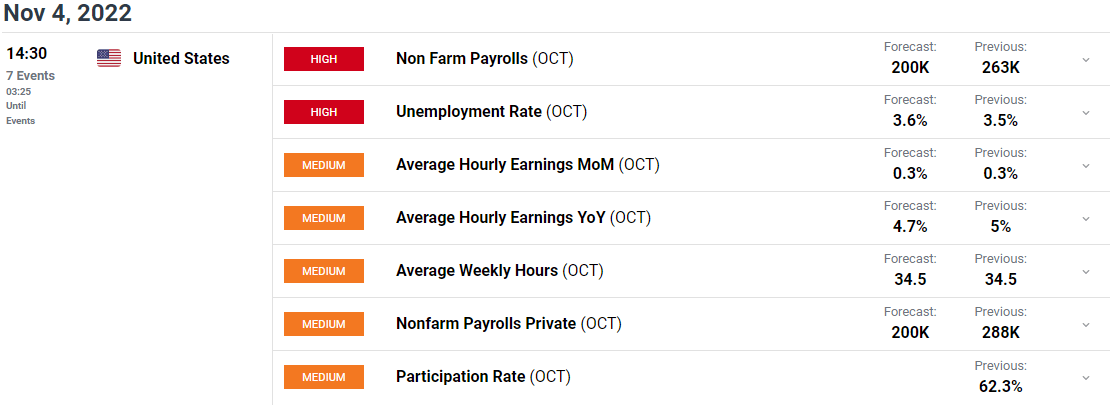
For all market-moving economic releases and events, see the DailyFX Calendar
Later in the day we have non-farm payrolls out of the US, which will be the first significant data release since the FOMC meeting on Wednesday. The current forecast is sitting at 200k new jobs added with the unemployment rate expected to tick slightly higher at 3.6%. A weaker than expected NFP print should see some dollar weakness as markets may price a smaller interest rate hike for December. Alternatively, a figure in excess of 200k could see the dollar rally dragging gold back down toward its YTD low.
Gold Daily Chart – November 4, 2022
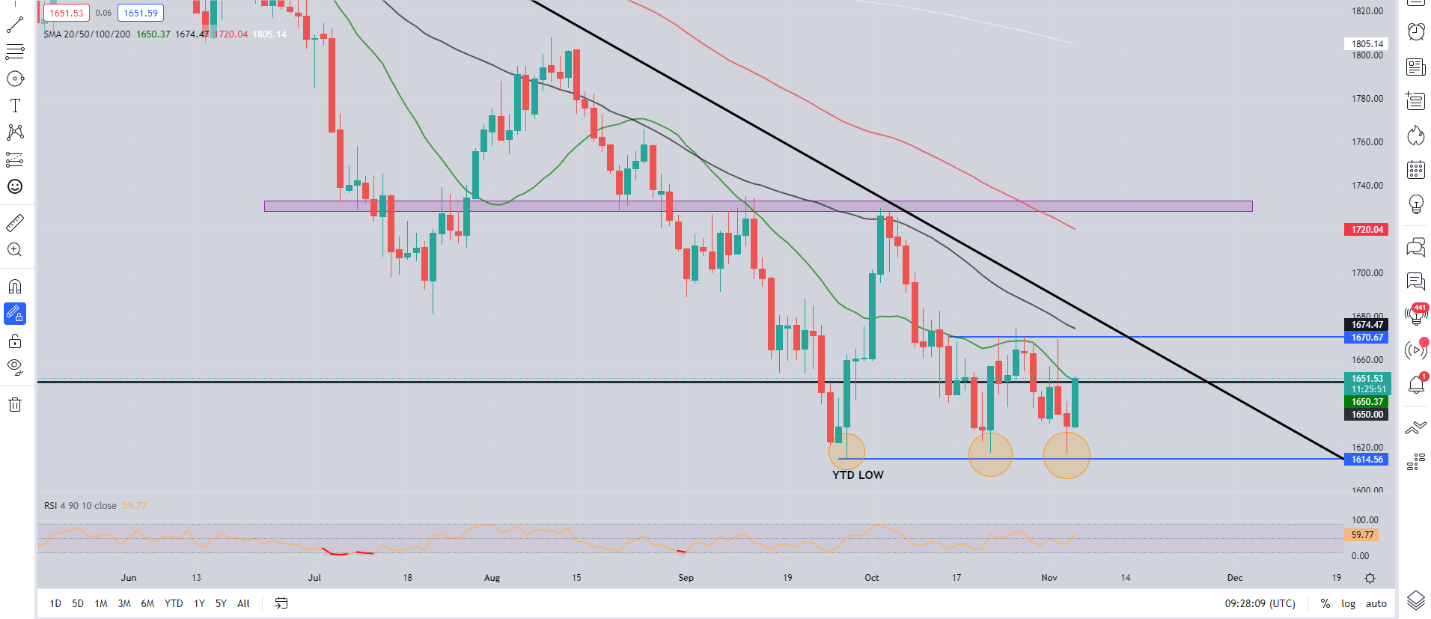
Source: TradingView
From a technical perspective, gold has seen multiple rejections of the $1670 area, with yesterday’s push down coming within a whisker of the lower end of the range around $1614. This resulted in a triple bottom formation which is strengthening the case for further upside.
The first hurdle to clear for bulls is the $1650 area which coincides with the 20-SMA with a break above taking the precious metal toward the $1670 area. This coincides with 50-SMA while the long-term descending trendline rests just above at around $1680.
Price is likely to consolidate as we approach the NFP release with bulls likely to remain on the sidelines following yesterday’s rally. As much as the technical picture hints at further upside, the next move rests upon the NFP data release later in the day.
Introduction to Technical Analysis
Technical Analysis Chart Patterns
Recommended by Zain Vawda
Key intraday levels that are worth watching:
Support Areas
•1630
•1614
•1600
Resistance Areas
•1661
•1670
•1685
| Change in | Longs | Shorts | OI |
| Daily | -7% | 27% | -2% |
| Weekly | -2% | 19% | 1% |
Resources For Traders
Whether you are a new or experienced trader, we have several resources available to help you; indicators for tracking trader sentiment, quarterly trading forecasts, analytical and educational webinars held daily, trading guides to help you improve trading performance, and one specifically for those who are new to forex.
Written by: Zain Vawda, Markets Writer for DailyFX.com
Contact and follow Zain on Twitter: @zvawda
Be the first to comment