

GOLD TALKING POINTS:
- Gold prices test key resistance as a would-be Double Bottom takes shape
- Treasury yields down despite upbeat US economic data, boosting bullion
- Upbeat UofM consumer confidence data may slow gold’s rise near-term

Recommended by Ilya Spivak
Get Your Free Gold Forecast
Gold prices shot higher alongside bellwether S&P 500 futures as Treasury bond yields fell, in a move that appears to reflect ebbing Fed tightening speculation. That understandably bolstered the relative appeal of the non-interest-bearing yellow metal.
Interestingly, the move came despite strong US retail sales and jobless claims data, which might have been expected to encourage reflation hopes and stoke stimulus withdrawal bets. Nevertheless, the rate on the benchmark 10-year note slipped below the closely-watched 1.6% handle to hit a one-month low.
Looking ahead, a relatively quiet economic data docket is headlined by April’s University of Michigan consumer confidence survey. It is expected to show that sentiment has returned to the highest level in a year, effectively recovering from losses sustained since the onset of the Covid-19 pandemic.
Besides a rosy view of consumers’ disposition, the report is also predicted to show that near-term inflation expectations jumped to match the seven-year high registered in February. That may at least slow the slide in yields for now, limiting gold’s scope for immediate upside follow-through.

Recommended by Ilya Spivak
How to Trade Gold
GOLD TECHNICAL ANALYSIS
Gold prices are retesting support-turned-resistance in the 1760-76 area attempting to establish a bullish Double Bottom pattern at 1676.91. A daily close above this barrier would go a long way toward confirming that a near-term trend reversal is afoot, opening the door for a test above the $1800/oz figure.
In the meantime, gains still appear to be corrective within the context of a longer-term decline, with price action since late February characterized as a consolidative pause. Near-term support is at 1721.39, with a turn back below that setting the stage for another challenge of 1676.91.
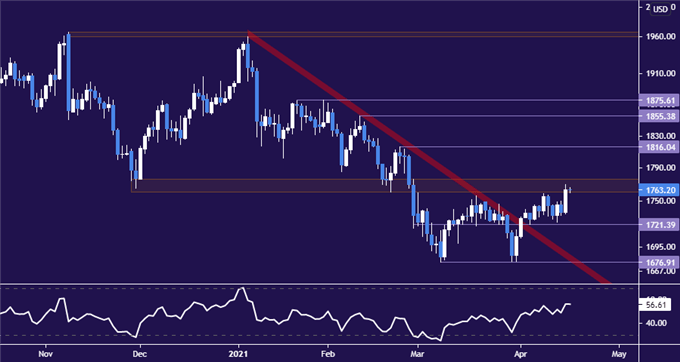
Gold price chart created using TradingView
GOLD TRADING RESOURCES
— Written by Ilya Spivak, Head Strategist, APAC for DailyFX
To contact Ilya, use the comments section below or @IlyaSpivak on Twitter

Be the first to comment