

GOLD PRICE OUTLOOK:
- Gold prices traded flat after rising 0.76% on Tuesday as bond yields fell alongside the US Dollar
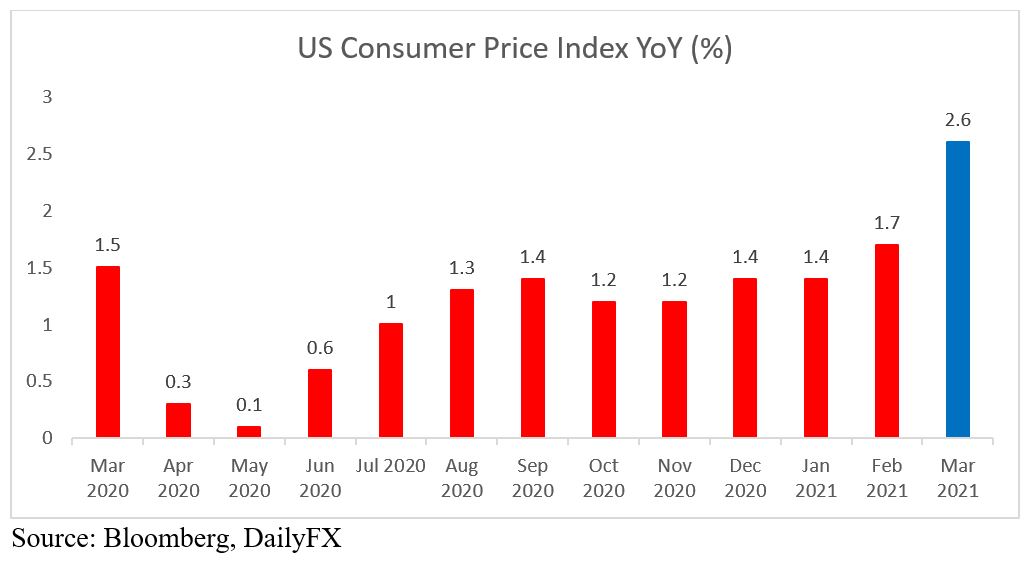
- US headline inflation advanced 2.6% YoY in March, showing an accelerated pace of economic activity
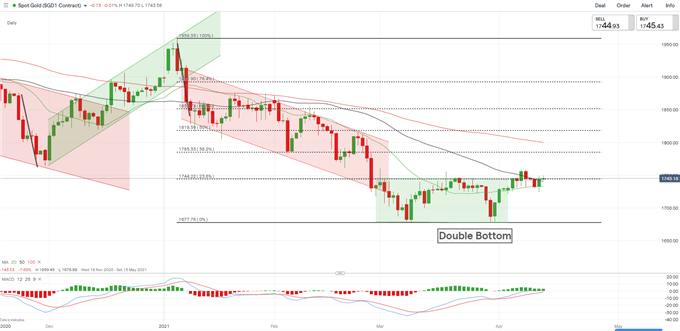
- Prices attempted to breach the 50-day SMA as a bullish “Double Bottom” chart pattern takes shape

Recommended by Margaret Yang, CFA
Get Your Free Gold Forecast
Gold prices traded flat during the APAC morning session after falling yields and a weaker US Dollar sent its price 0.76% higher in the prior session. US headline CPI hit 2.6% in March, marking a two-and-half year high as economic activity accelerates with rapid vaccine rollouts and fiscal stimulus. The US Dollar index retreated mildly however, suggesting that traders did not consider higher inflation readings as an imminent trigger for Fed tapering.
Nonetheless, market participants are anticipating elevated inflation readings in the months to come, partially due to the low-base effect. Rising price levels may boost the demand for gold as an inflation hedge, although higher real yields (nominal yield – inflation) may erode this prospect if nominal yields rise faster than inflation expectations.
US CPI YoY (%) – Past 12 months
The 30-year Treasury note received decent demand during Tuesday’s auction, pulling bond yields lower. The real yield, as represented by the 10-year inflation-indexed security, declined 4 bps to -0.71%. Falling yields buoyed precious metal prices as the opportunity cost of holding them decreased.
Looking ahead, a slew of Fed officials’ speeches on Wednesday evening will be closely monitored by gold traders alongside the US retail sales figures on Thursday. A stronger-than-expected reading may boost reflation optimism and encourage investors to shift away from precious metals into risk assets for yield and growth. Friday’s Chinese Q1 GDP data will also be in focus.
Gold Prices vs. 10-Year Treasury Inflation-Indexed Security
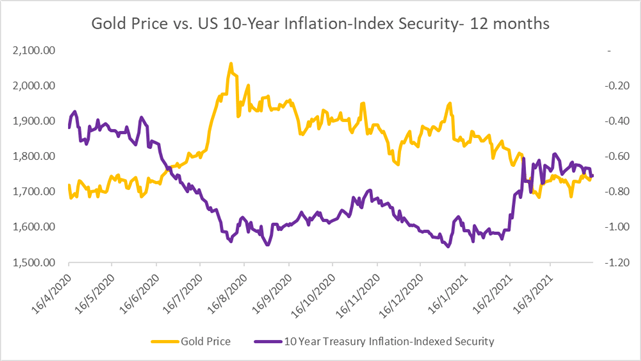
Source: Bloomberg, DailyFX
The world’s largest gold ETF – SPDR Gold Trust (GLD) – saw continuous net capital outflows over the past few weeks. But the pace of redemption appears to be slowing (chart below). The number of GLD shares outstanding declined 3.8 million month-to-date, compared to a 6.1-million decrease seen in the last two weeks of March. It suggests that selling pressure on gold is probably fading. Gold prices and the number of outstanding GLD shares have exhibited a strong positive correlation of 0.87 over the past 12 months (chart below).
Gold Price vs. GLD ETF Shares Outstanding – 12 Months
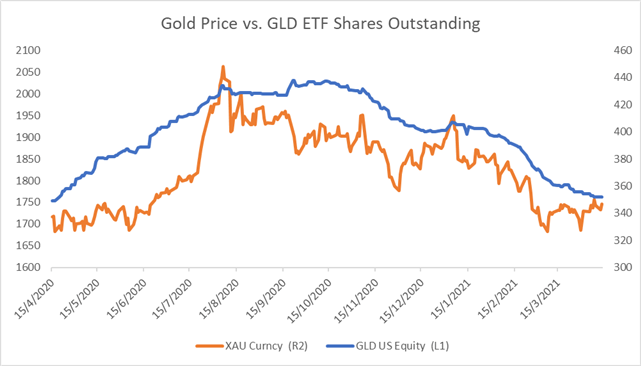
Source: Bloomberg, DailyFX
Technically, gold has likely formed a “Double Bottom” chart pattern after hitting US$ 1,677 twice. The “Double Bottom” pattern usually appears at the end of a downtrend and signals potential trend reversal. Prices are facing an immediate resistance level at US$ 1,744, where the 23.6% Fibonacci retracement and the 50-day SMA line intersect. A successful attempt to breach this level may open the door for further upside potential with an eye on US$ 1,785 – the 38.2% Fibonacci retracement. A swing lower however, may bring the next support level of US$ 1,677 (previous low) into focus.
Gold Price – Daily Chart
| Change in | Longs | Shorts | OI |
| Daily | -2% | 12% | 1% |
| Weekly | 3% | 2% | 3% |
— Written by Margaret Yang, Strategist for DailyFX.com
To contact Margaret, use the Comments section below or @margaretyjy on Twitter
Be the first to comment