

Gold Talking Points:
- Gold prices fall into another tight range of support and resistance below $1,900
- Fed expectations remain the prominent driver of price action
- Psychological resistance holds XAU/USD hostage at $1,900.
Recommended by Tammy Da Costa
Get Your Free Gold Forecast
Gold futures have recovered a portion of recent losses which drove XAU/USD below $1,900. After climbing to a nine-month high of $1975.2 last week, the release of strong US economic data restricted further gains.
Visit DailyFX education to learn more about gold trading and factors influencing gold prices
In response to the robust job data and positive ISM figures, recession fears were overshadowed by prospects of further rate hikes. As the 22% rally from the October lows fizzled out, both technical and fundamental factors contributed to Gold’s decline.
DailyFX Economic Calendar
Although gold and silver are safe-haven assets that are often used as a hedge against inflation, the non-yielding commodities are sensitive to rising interest rates.
After the Federal Reserve announced a softer 25 basis-point rate hike at the FOMC meeting earlier this month (1 Feb), gold prices temporarily surged before peaking at $1975.2. With investors interpreting the slower rate hike as a sign that the Federal Reserve could continue to slow down the pace of tightening, the announcement did not catch markets off-guard.
Gold (XAU/USD) Technical Analysis
Since market participants had already priced in a 99% probability of a 25-basis point rate hike, gold’s upside was limited. As gold futures rose above the March 4th 2022 high of $1974.9, a series of doji candles appeared on the four-hour chart, indicative of indecision.
With the 24 February 2022 (the onset of the war in Ukraine) high holding at $1976.5, the firm barrier of resistance held firm, allowing bulls to go no further than $1975.2.
Gold (XAU/USD) four-hour chart
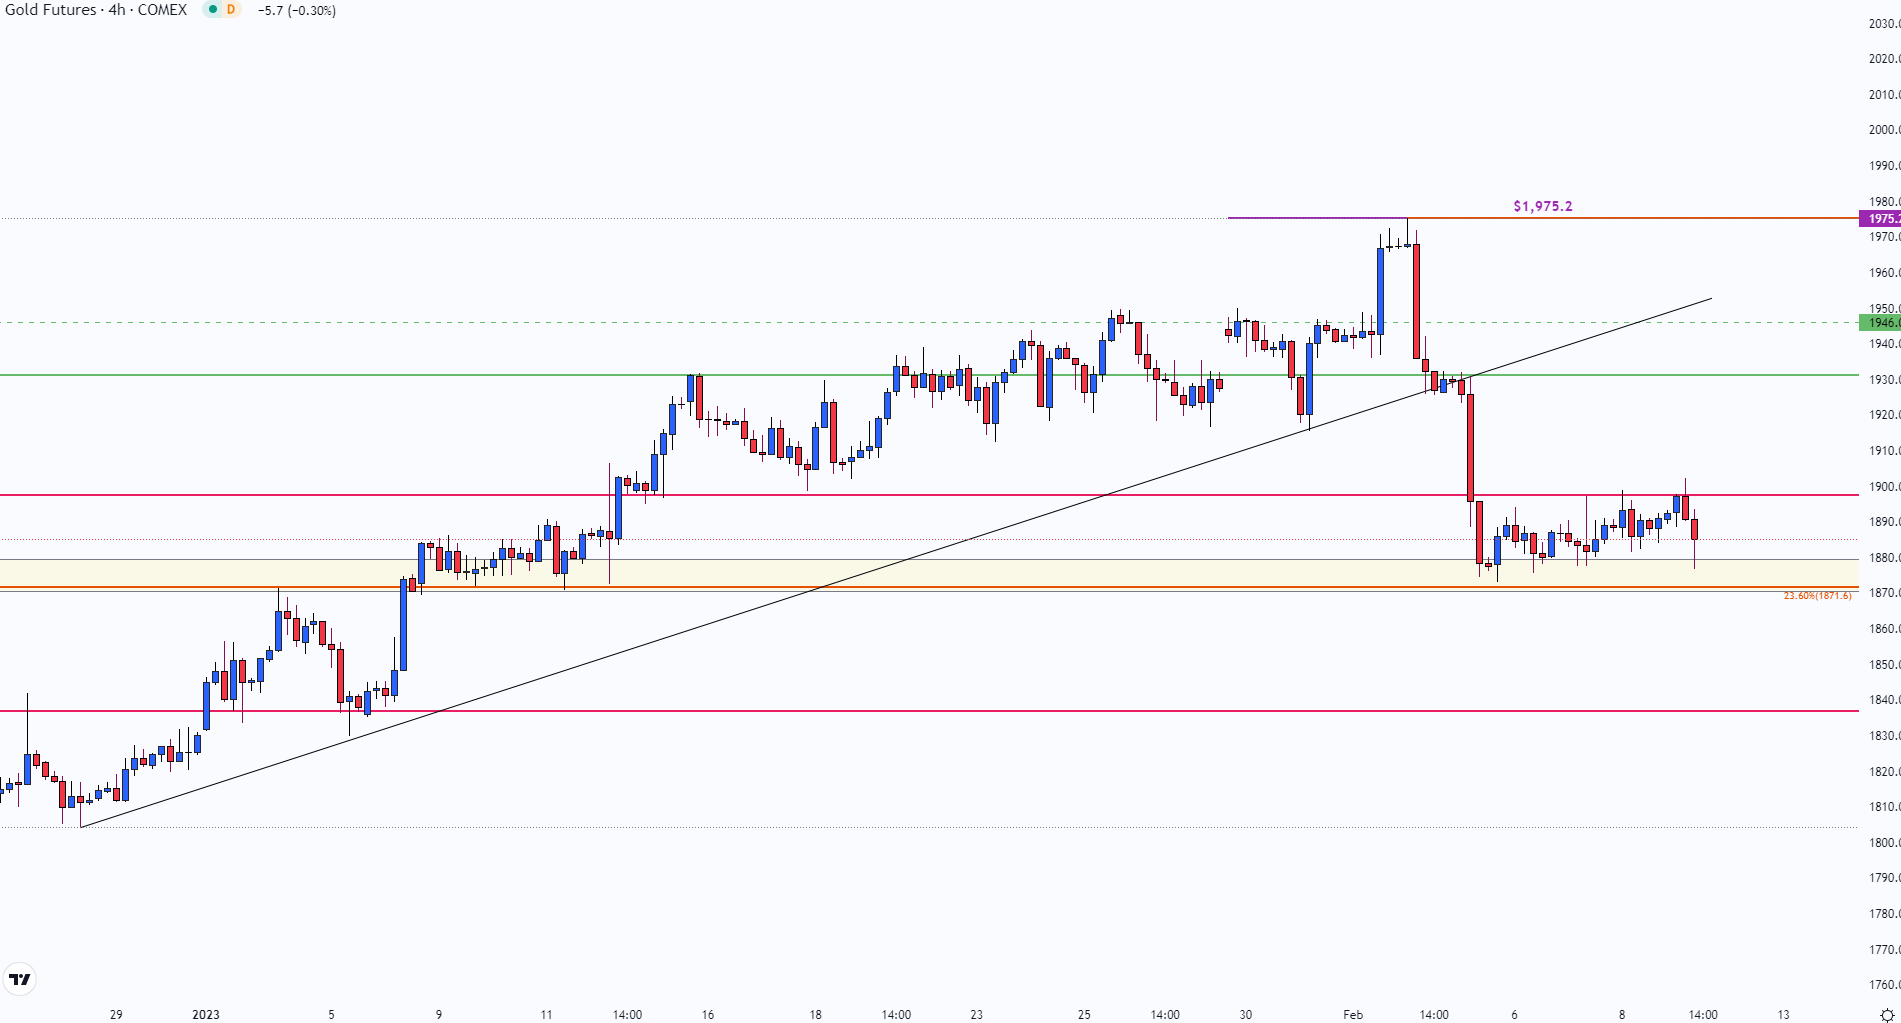
Chart prepared by Tammy Da Costa using TradingView
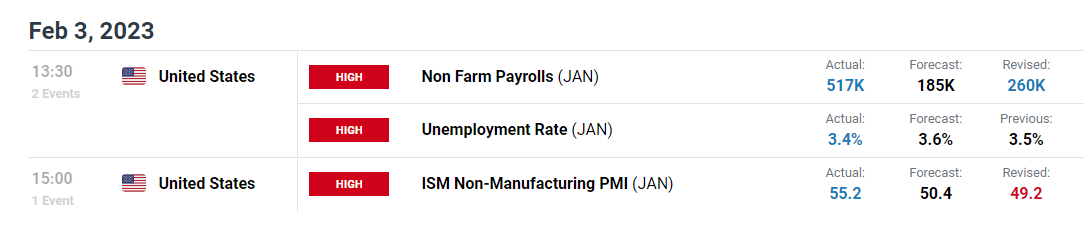
As sellers forced prices lower, a break of prior trendline support (from the October low) drove XAU/USD back below $1930. Then, there was the release of the US NFP report which came in well-above estimates. With 517,000 jobs being added to the US economy in January, Gold prices continued to decline before stabilizing around $1880.
Gold Daily Chart
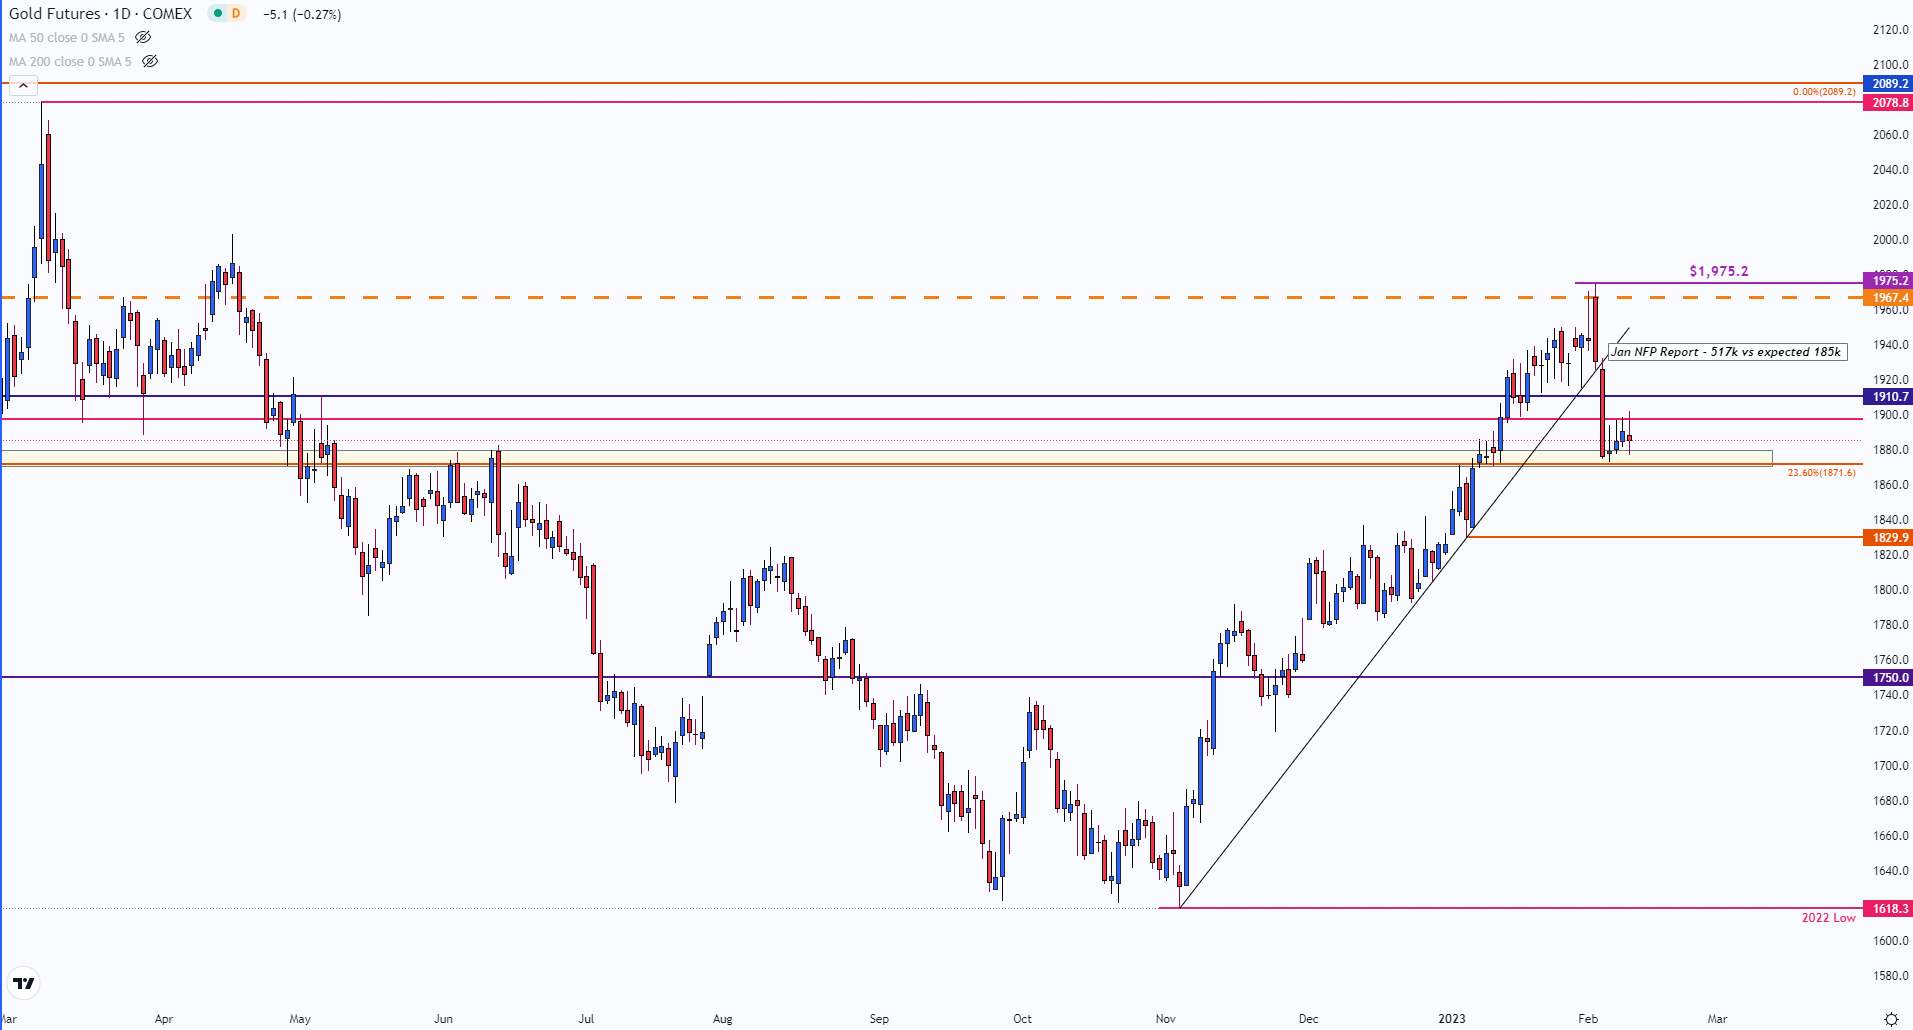
Chart prepared by Tammy Da Costa using TradingView
On the weekly chart below, a rejection of the upper wick at the current monthly high was accompanied by a sharp pullback and a retest of $1873.2. Simultaneously, the weekly CCI (commodity channel index) eased back from overbought territory suggesting that bulls had run out of steam. With the current weekly candle showing little movement, a tight range has formed between $1873 and $1880. Just below that, the 23.6% Fibonacci of the 2018 – 2020 move has formed an additional zone of support at $1871.6. If prices fall below this level, prices could continue to decline, towards the next support target of $1836.6.
Gold (XAU/USD) Weekly Chart
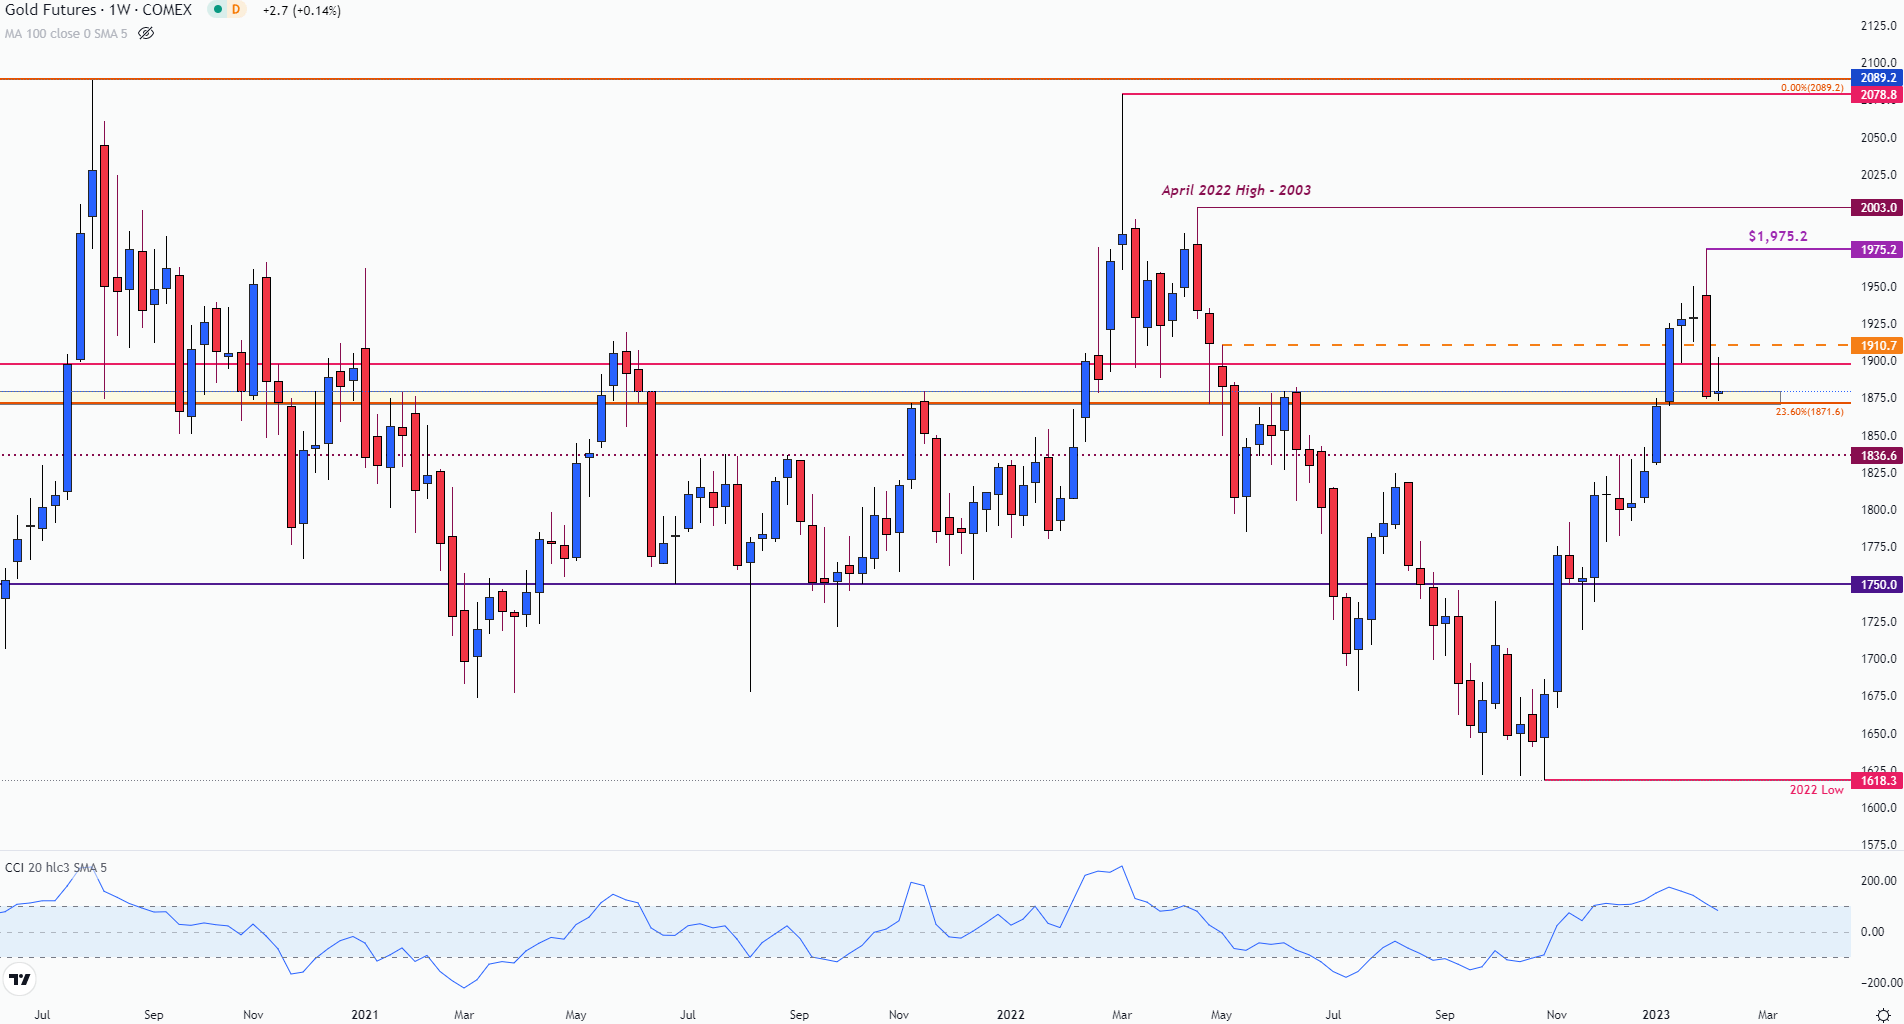
Chart prepared by Tammy Da Costa using TradingView
— Written by Tammy Da Costa, Analyst for DailyFX.com
Contact and follow Tammy on Twitter: @Tams707
Be the first to comment