

Gold Price Talking Points
The price of gold trades back below the 50-Day SMA ($1718) after failing to test the September high ($1735), and bullion may face a further decline over the coming days if it fails to defend the opening range for October.
Gold Price Weakness to Persist on Failure to Defend Monthly Opening Range
The price of gold remains under pressure following the US Non-Farm Payrolls (NFP) report as longer-dated Treasury yields climb to fresh monthly highs, with the precious metal on track to test the monthly low ($1660) as it carves a series of lower highs and lows.
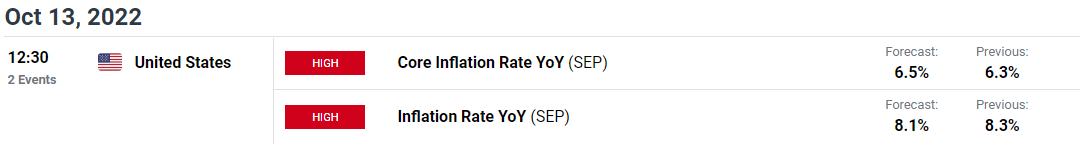
Looking ahead, developments coming out of the US may continue to sway gold prices as the update to the Consumer Price Index (CPI) is anticipated to show the core rate increasing to 6.5% in September from 6.3% per annum the month prior, and evidence of persistent price growth may keep the Federal Reserve on track to carry out a restrictive policy as the Summary of Economic Projections (SEP) reflect a steeper path for US interest rates.
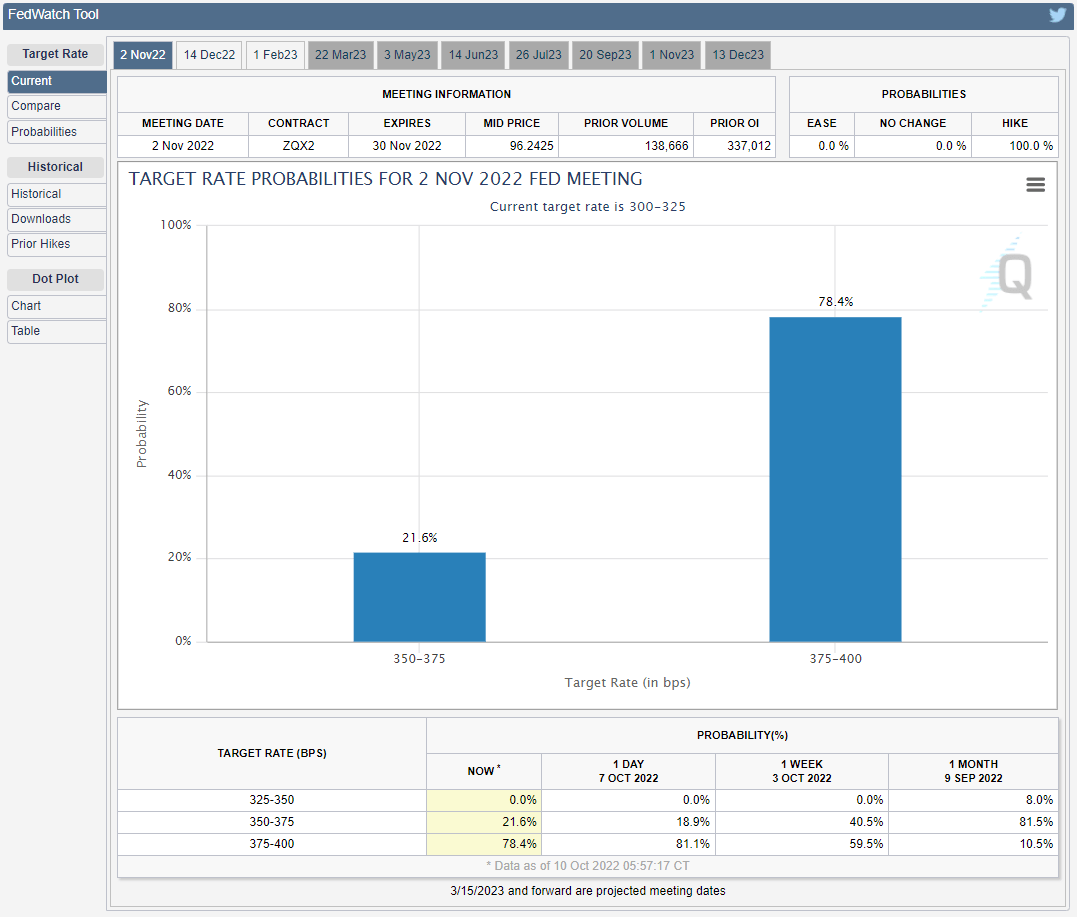
Source: CME
In turn, the price of gold may face headwinds ahead of the next Federal Open Market Committee (FOMC) interest rate decision on November 2 as the CME FedWatch Tool highlights a greater than 70% probability for another 75bp rate hike, and bullion may largely mirror the price action from August as it struggles to hold above the 50-Day SMA ($1718).
With that said, the price of gold may track the negative slope in the moving average as it reverses ahead of the September high ($1735), and bullion may continue to give back the rebound from the yearly low ($1615) if it fails to defend the opening range for October.
Gold Price Daily Chart
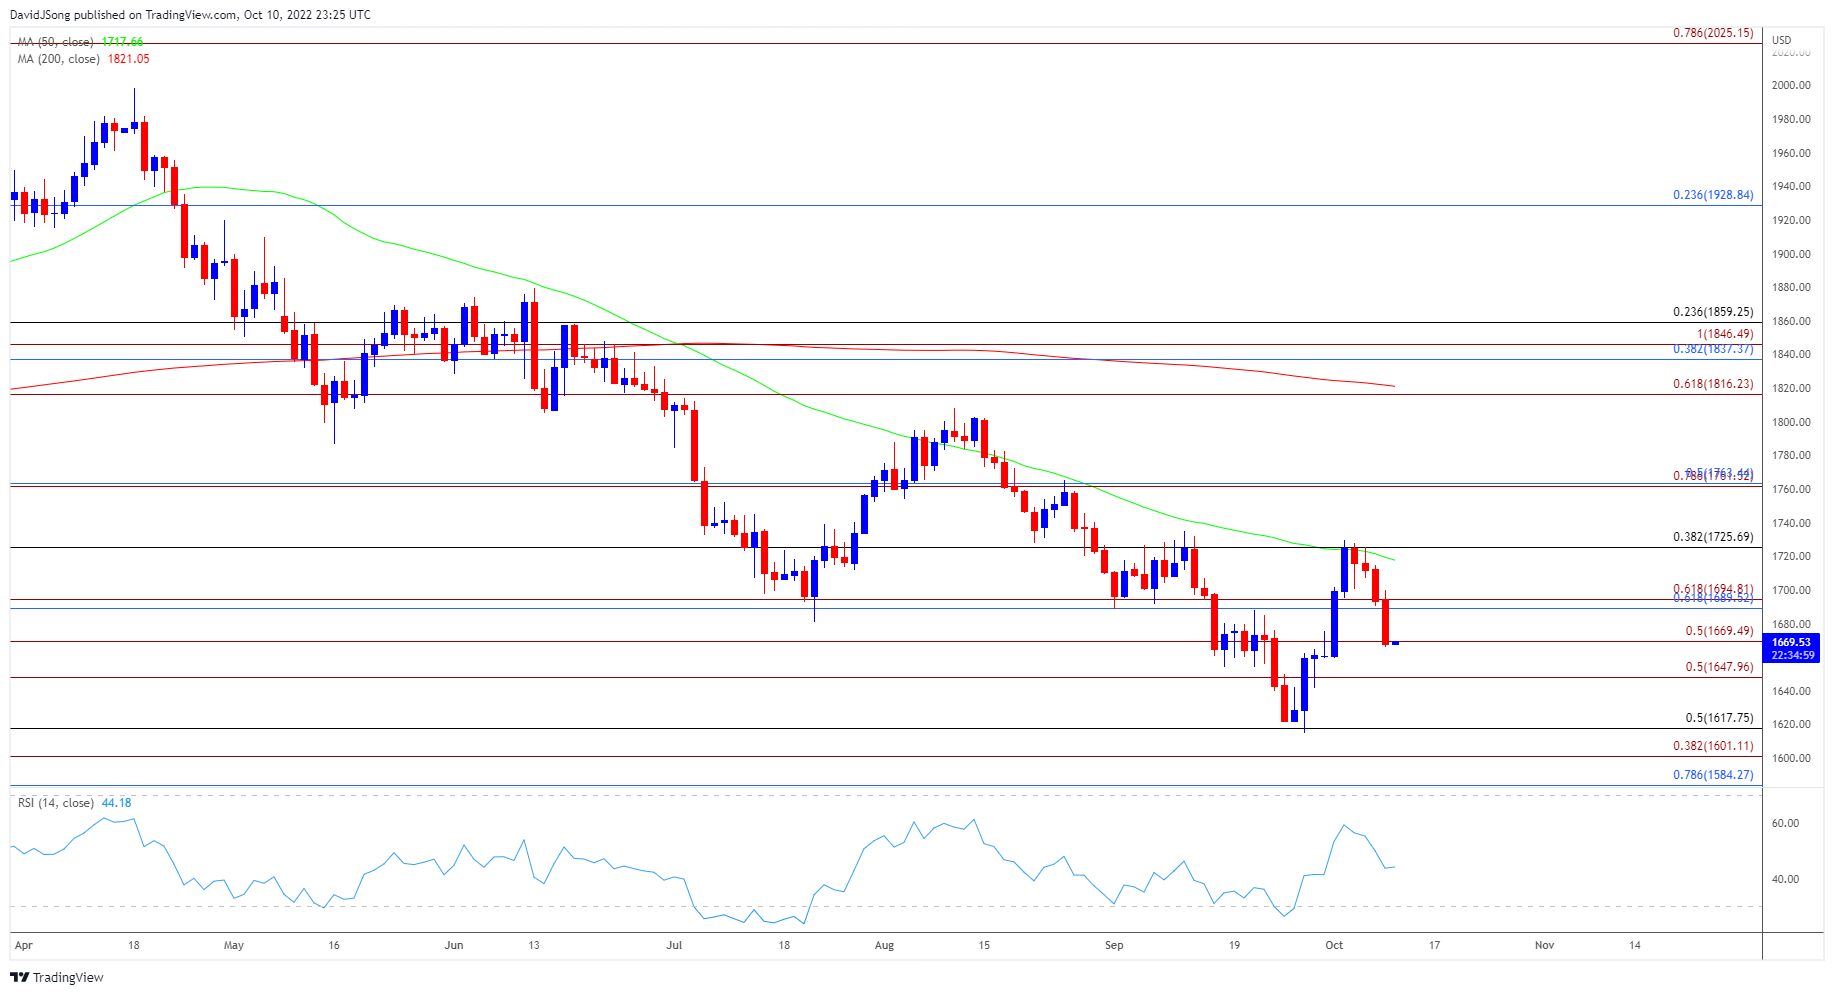
Source: Trading View
- The price of gold trades back below the 50-Day SMA ($1718) amid the failed attempt to test the September high ($1735), with the recent series of lower highs and lows pushing the precious metal back below the $1670 (50% expansion) region.
- Bullion may mirror the price action from August as it appears to be tracking the negative slope in the moving average, and failure to defend the monthly low ($1660) may push the price of gold back towards $1648 (50% expansion) as it gives back the rebound from the yearly low ($1615).
- A break/close below the Fibonacci overlap around $1601 (38.2% expansion) to $1618 (50% retracement) opens up the $1584 (78.6% retracement) region, with the next area of interest coming in around the April 2020 low ($1568).
Trading Strategies and Risk Management
Becoming a Better Trader
Recommended by David Song
— Written by David Song, Currency Strategist
Follow me on Twitter at @DavidJSong
Be the first to comment