

Gold Price Talking Points
The price of gold struggles to retain the rebound from the start of the week as longer-dated US Treasury yields hold above pre-pandemic levels, and looming developments in the Relative Strength Index (RSI) may indicate a further decline in gold prices as the indicator flirts with oversold territory for the first time since November.
Gold Price Rebound Vulnerable as RSI Flirts with Oversold Territory
The price of gold attempts to recover from a five-day losing streak as it bounces back from a fresh yearly low ($1717), but the break below the November low ($1765) provides further indication that the decline from the record high ($2075) is a potential shift in market behavior as a ‘death cross’ takes shape in 2021.
In turn, the price of gold may continue to give back the advance from the June 2020 low ($1671) as the 50-Day SMA ($1842) now reflects a negative slope, and the RSI may show the bearish momentum gathering pace as it appears to be pushing into oversold territory. The break below 30 in the RSI is likely to be accompanied by a further decline in the price of gold especially if the oscillator reflects the extreme readings (22) last seen in 2018, and the precious metal may continue to exhibit a bearish behavior ahead of the next Federal Open Market Committee (FOMC) interest rate decision on March 17 even though the Fed’s balance sheet climbs to a fresh record high of $7.590 trillion.
With that said, the recent rebound in the price of gold may end up being short lived as the rise in longer-dated US Treasury yields look poised to persist, and the Relative Strength Index (RSI) may indicate a further decline in gold prices as the indicator flirts with oversold territory for the first time since November.
Gold Price Daily Chart
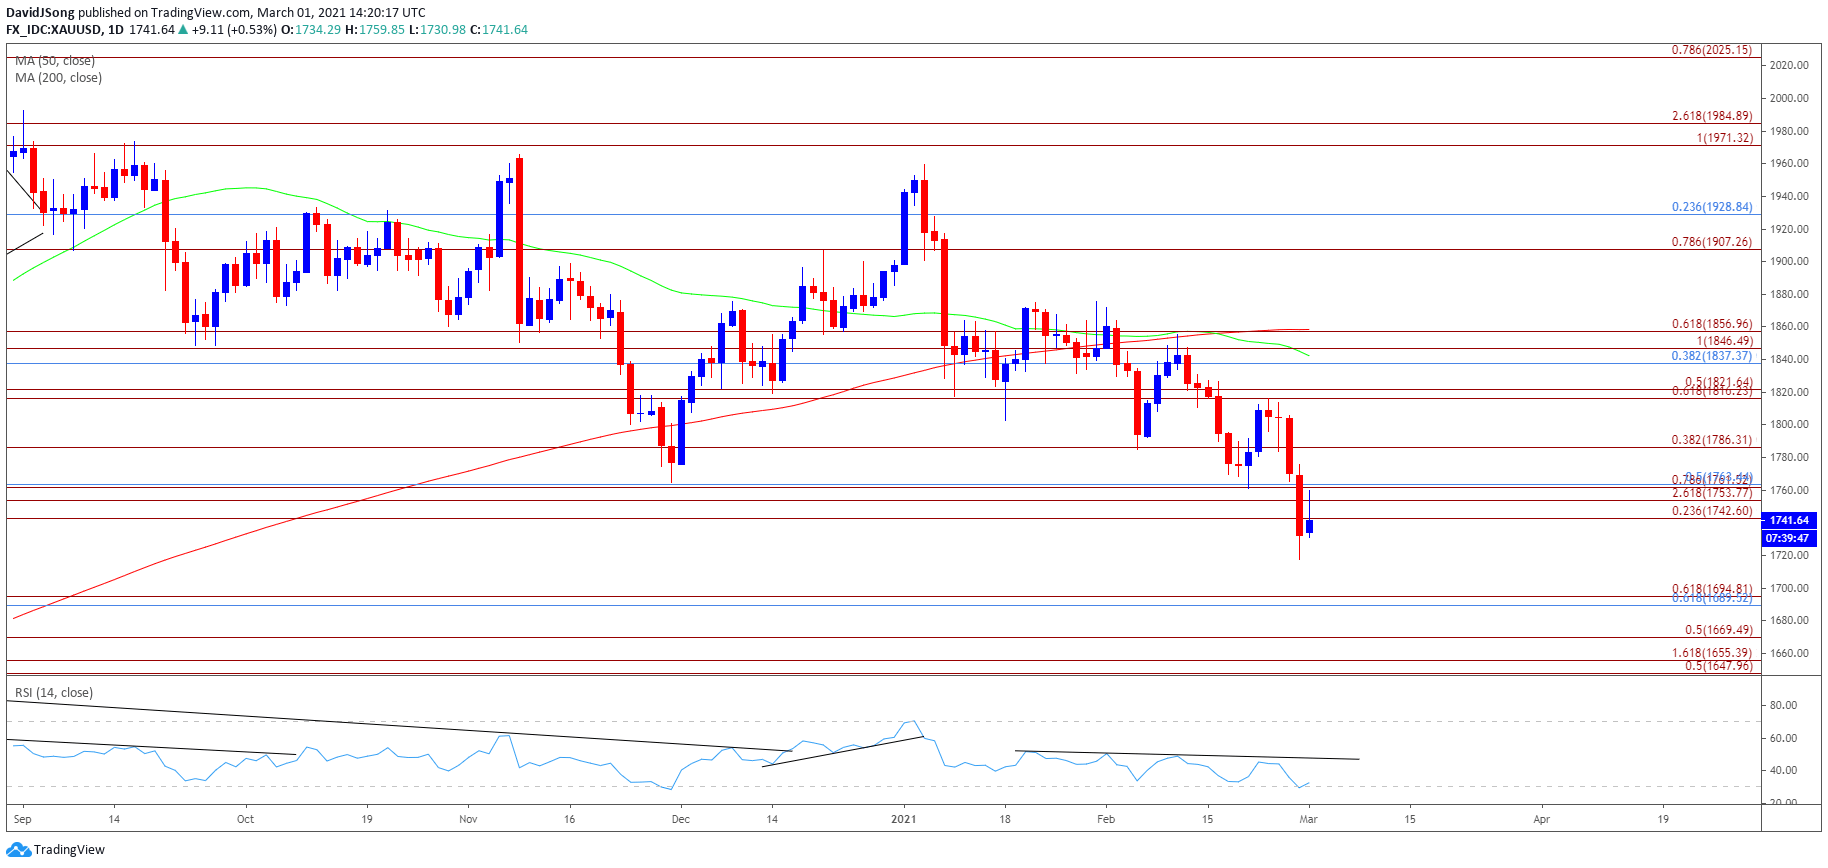
Source: Trading View
- Keep in mind, the price of gold pushed to fresh yearly highs throughout the first half 2020, with the bullish price action also taking shape in August as the precious metal tagged a new record high ($2075).
- However, the bullish behavior failed to materialize in September as the price of gold traded below the 50-Day SMA ($1842) for the first time since June, with developments in the Relative Strength Index (RSI) negating the wedge/triangle formation established in August as the oscillator slipped to its lowest level since March.
- The RSI dipped into oversold territory in November for the first time since 2018, with the correction from the record high ($2075) indicating a potential shift in market behavior as the price of gold takes out the November low ($1765).
- In turn, the price of gold may continue to give back the advance from the June 2020 low ($1671) as a ‘death cross’ formation takes shape in 2021, and the RSI may show the bearish momentum gathering pace if the oscillator crosses below 30 and reflects the extreme readings (22) last seen in 2018.
- The break/close below the Fibonacci overlap around $1743 (23.6% expansion) to $1763 (50% retracement) brings the $1690 (61.8% retracement) to $1695 (61.8% expansion) region on the radar, with the next area of interest coming in around $1670 (50% expansion), which largely lines up with the June 2020 low ($1671).

Recommended by David Song
Traits of Successful Traders
— Written by David Song, Currency Strategist
Follow me on Twitter at @DavidJSong
Be the first to comment