

Gold Price Action Analysis
- Gold prices have put in an aggressive bullish move over the past few weeks as fear has dominated global markets.
- As expectations continue to rise for softening and, perhaps even extraordinary accommodation out of the FOMC, Gold prices have remained relatively strong.
- As looked at in this week’s Gold forecast, support potential remained as taken from prior price action inflections.
Gold Gains as Potent Combo of Fear and Accommodation Dominate Headlines
Gold prices have continued to exhibit strength through 2020 as a potent combo of fear and Central Bank accommodation to address those fears remains in the headlines. The FOMC posed an emergency rate cut last week of 50 basis points, the first of its kind since the Financial Collapse; and expectations are high that the Fed is going to cut again at their meeting next week, perhaps even as much as 75 basis points in the effort of preparing the economy for a slowdown emanating from Coronavirus.
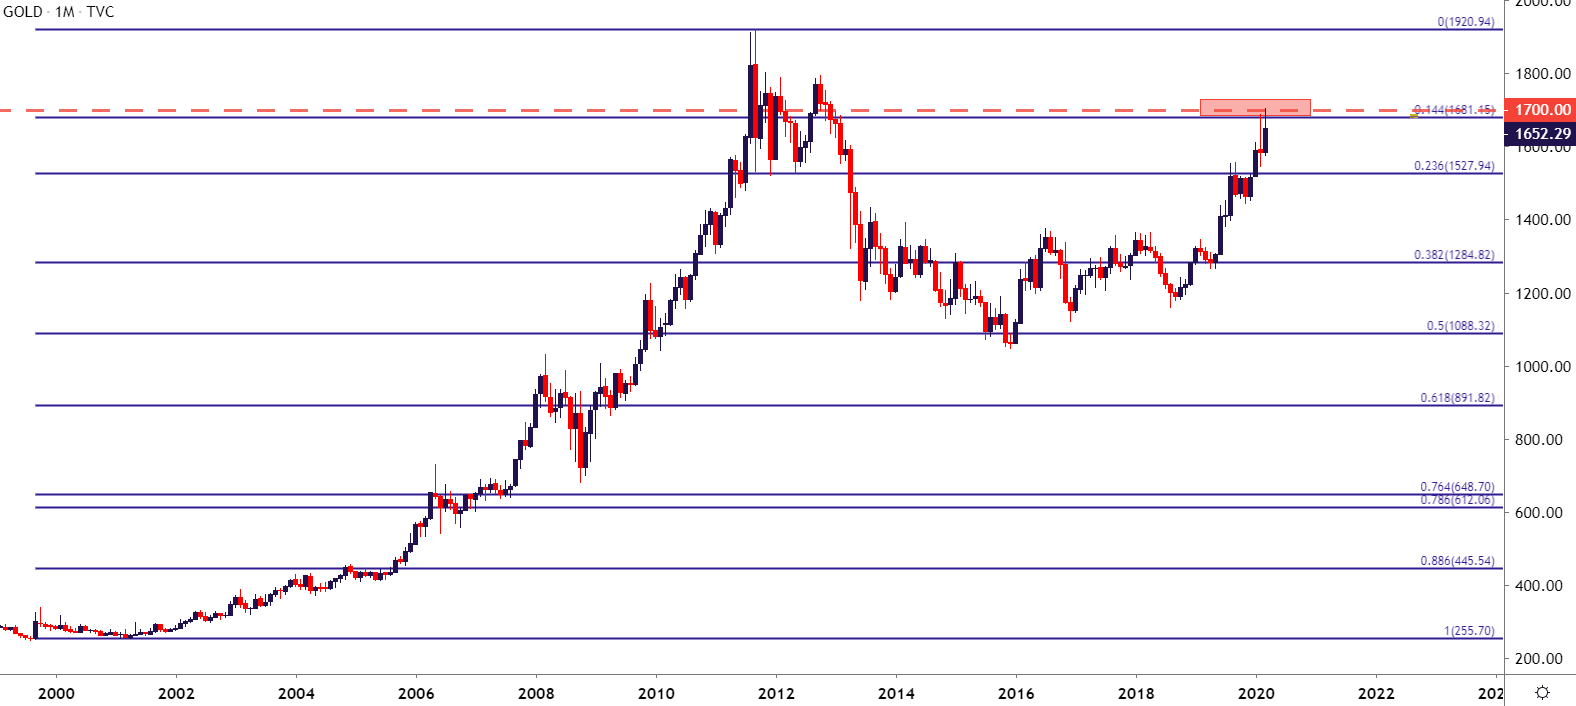
Gold prices have responded to this scenario with a continuation of strength as buyers pushed up to a fresh seven-year-high on Friday of last week; temporarily testing the 1700 level that hasn’t been traded at since 2013. Also in this vicinity and perhaps helping to elicit a bit of support is the 14.4% Fibonacci retracement of the 1999-2011 major move, residing around the 1681 level in Gold.
Gold Monthly Price Chart
Chart prepared by James Stanley; Gold on Tradingview
Gold Remains Overbought – But Fear May Obviate that Fact
As looked at in this week’s technical forecast, Gold markets remain overbought from a variety of perspectives and from the chart it can be difficult to justify any ‘value’ plays in the yellow metal. But, that overbought reading may matter little as fear dominates the backdrop with investors rushing into safe harbors like US Treasuries.

Recommended by James Stanley
Download our Gold Q1 Forecast
The primary challenge at this point is working with a bullish trend in an overbought market; and there are generally a couple of ways that traders may proceed in such a scenario. Either a) looking to play breakouts on pushes to fresh highs or b) try to exercise patience, and allow prices to pullback to a support level that may allow for re-entry.
The support zones identified in this week’s technical forecast have already started to come into play, with the nearby zone coming back into play after the secondary zone, running from the approximate 1632-1642 helped to set this week’s low.
Gold Four-Hour Price Chart
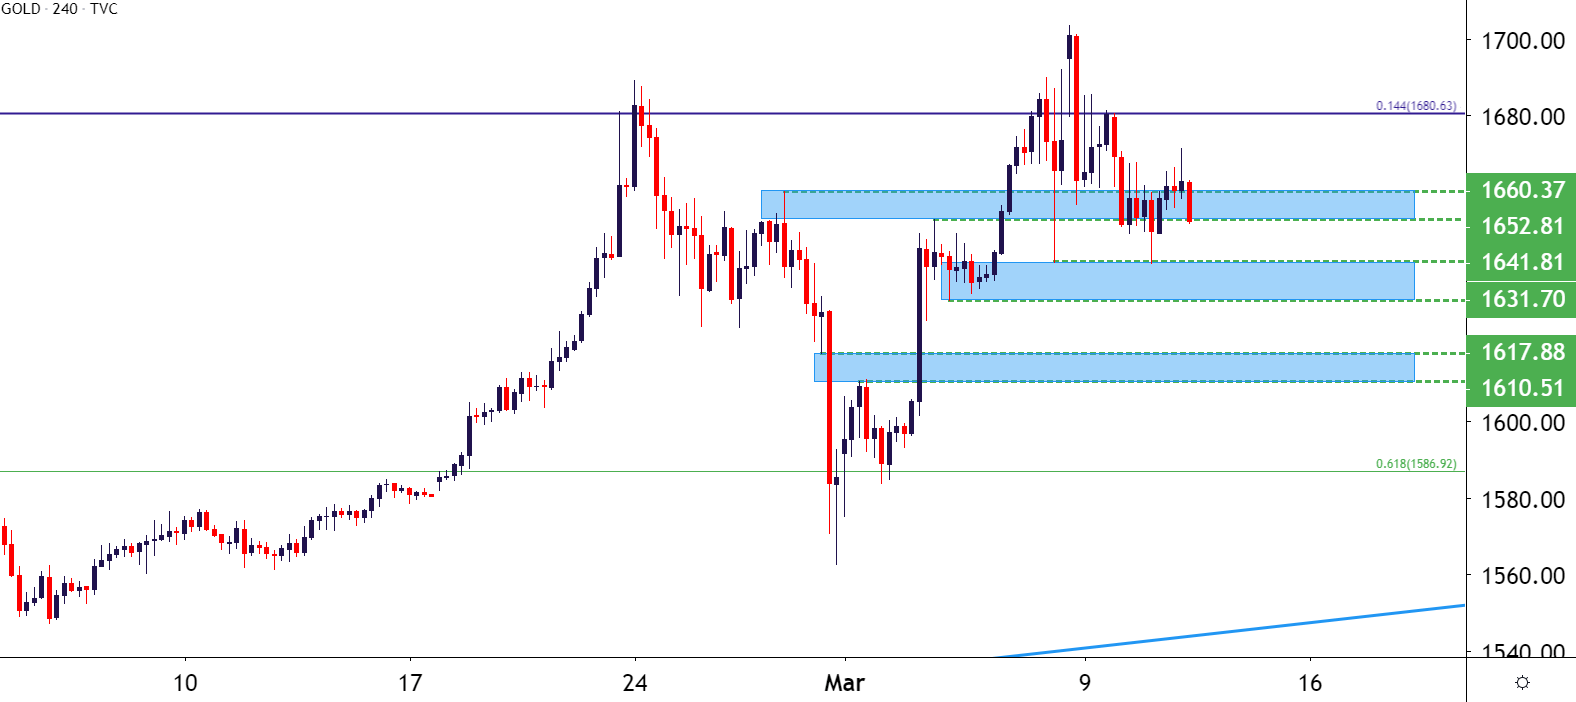
Chart prepared by James Stanley; Gold on Tradingview
Gold Price Strategy
Bigger picture, the bullish trend could remain as attractive given the widespread expectation for the FOMC and, perhaps even Congress in the United States to revert to stimulus options in the effort of heading-off slowdown emanating from Coronavirus.
Next week’s FOMC rate decision looms large, as does the 1700 level lurking above current prices; and given how overbought Gold has become over the past few weeks, the market may need a deeper pullback before buyers are finally able to take-out that psychological level.
| Change in | Longs | Shorts | OI |
| Daily | 9% | -9% | 3% |
| Weekly | 5% | -12% | -1% |
As such, this can bring another deeper support level into play around the 1586 level, which is the 61.8% retracement of the 2012-2015 major move. This price helped to temporarily hold the highs in early-January and soon came back into play in early-February. But, as yet, hasn’t shown much for support after previously showing as resistance.
Gold Daily Price Chart
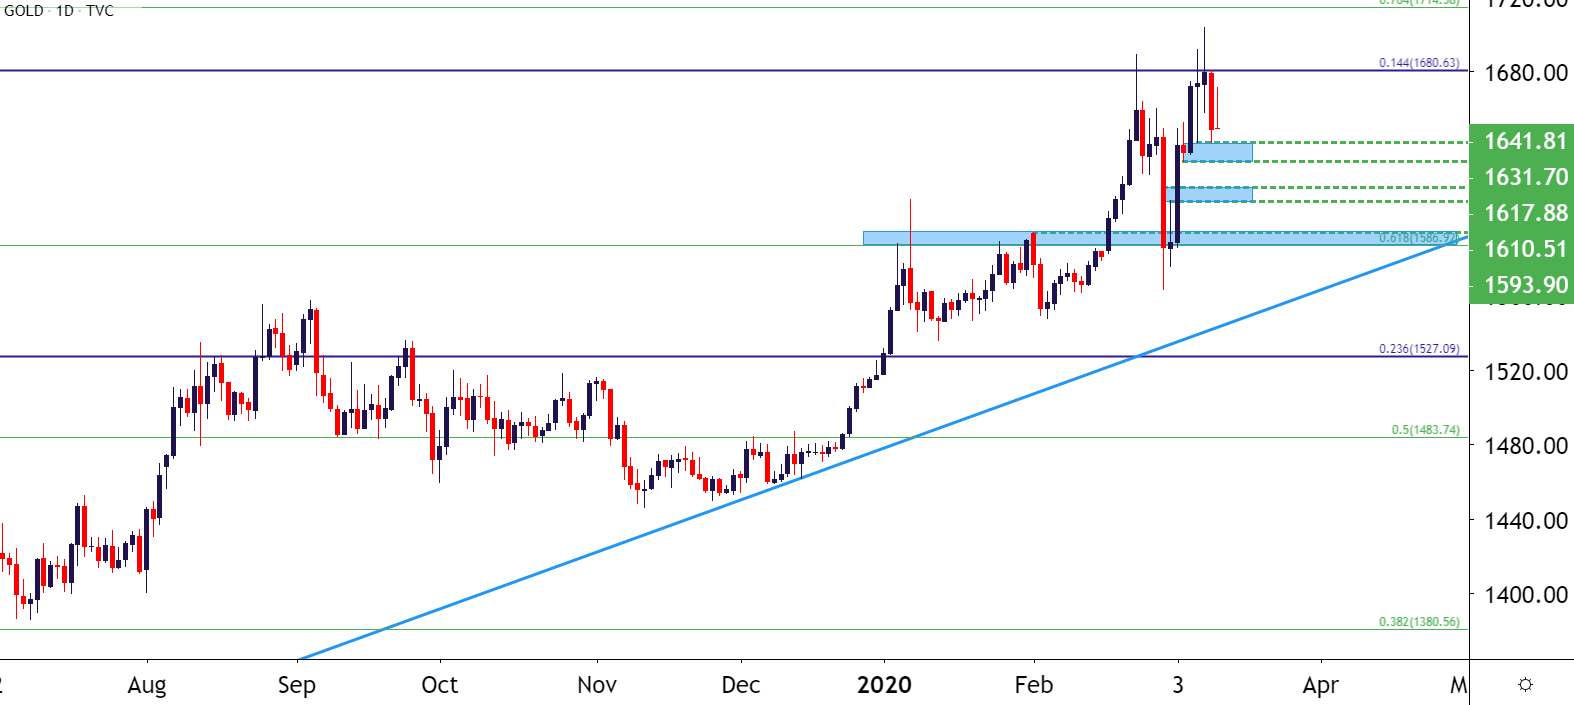
Chart prepared by James Stanley; Gold on Tradingview
— Written by James Stanley, Strategist for DailyFX.com
Contact and follow James on Twitter: @JStanleyFX
Be the first to comment