

Gold (XAU/USD) Analysis, Price and Chart
- Gold’s progress blocked for now.
- Inflation data, US Treasury auctions on deck.

Recommended by Nick Cawley
Get Your Free Gold Forecast
The price of gold continues to find its path to higher prices blocked by a cluster of resistance levels, and with important US sales and inflation data this, and a sizeable US Treasury auction on deck today, the precious may slip lower. The latest US core inflation reading will be released tomorrow, April 13, while the march retail sales figures will be released on Wednesday. Both are high-importance events and need to be closely followed. There are also speeches by Fed chair Jerome Powell and a range of Fed members throughout the week that need to be factored in.
Later today, a double US Treasury auction with the central bank selling a combined $96 billion of 3- and 10-year USTs, while tomorrow there are $24 billion UST 30-years up for grabs. Any reticence from the market towards these sales will push up yields, weighing on gold. Ten-year US Treasuries currently yield 1.665%, just eight basis points lower than its recent 14-month high print.
For all market–moving events and data releases, see the DailyFXCalendar
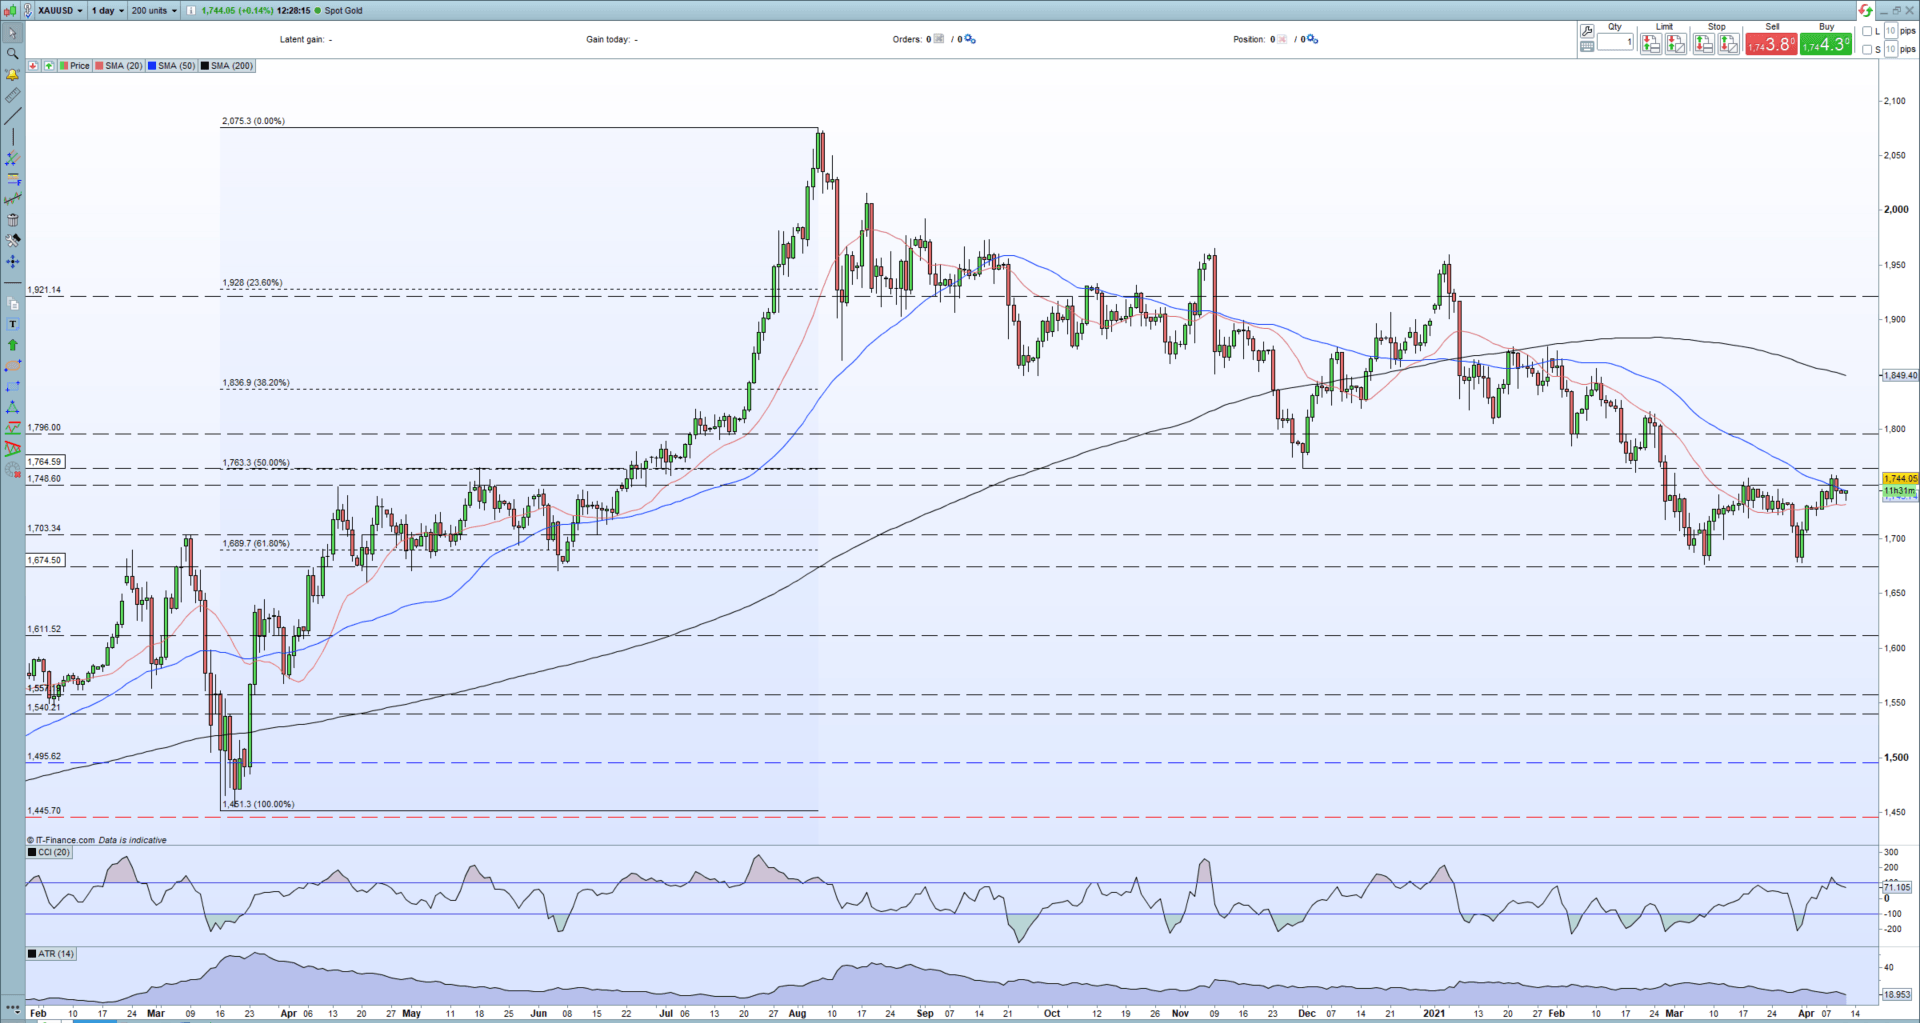
The daily chart shows gold trading around $1,742/oz. and near a cluster of resistance levels. The 50-day simple average is at $1,743.7/oz. before 4 prior highs between $1,757/oz. and $1,760/oz. come into play. And above here lies the 50% Fibonacci retracement of the March-August 2020 move at $1,763.5/oz. There is a reason for bulls to be optimistic however with the recent double-bottom formation suggesting positive sentiment is growing in the market.
Gold Daily Price Chart (February 2020 – April 12, 2021)
| Change in | Longs | Shorts | OI |
| Daily | 5% | 8% | 5% |
| Weekly | 5% | 13% | 7% |
Client sentiment data show 81.17% of traders are net-long with the ratio of traders long to short at 4.31 to 1. We typically take a contrarian view to crowd sentiment, and the fact traders are net-long suggests Gold prices may continue to fall.
Yet traders are less net-long than yesterday and compared with last week. Recent changes in sentiment warn that the current Gold price trend may soon reverse higher despite the fact traders remain net-long.
What is Market Sentiment and How Does it Work?
What is your view on Gold – are you bullish or bearish?? You can let us know via the form at the end of this piece or you can contact the author via Twitter @nickcawley1.
Be the first to comment