

Gold Price Forecast Talking Points:
- Despite the enthralling backdrop around recent moves in Silver, Gold prices have been relatively tame and subdued, spending much of the past two weeks in a range.
- Price action has pushed below a support trendline making up a symmetrical triangle, which may put more pressure on recent range support.
- The analysis contained in article relies on price action and chart formations. To learn more about price action or chart patterns, check out our DailyFX Education section.
After an enthralling bullish theme took over in Gold prices last summer, the yellow metal has now spent almost six full months digesting those gains. And more recently, price action has been even quieter, as near-term Gold prices have built into what’s been a rather consistent range.
From the two-hour chart below we can focus in on that dynamic. Support has had a tendency to hold from around the 1825-1836 levels, with each of those prices coming from a Fibonacci study. And resistance has shown from around 1859 up to 1873, again, with each price represented by a Fibonacci level.

Recommended by James Stanley
Download our Q1 Gold Forecast
Gold Two-Hour Price Chart

Chart prepared by James Stanley; Gold on Tradingview
The outer bounds of this range, 1825.31 support and 1873.01 resistance, are each derived from the June-August major move in Gold. These are the 50 and 61.8% markers from that major move. And taking a step back, there’s another item of digestion that needs to be addressed, and that’s the symmetrical wedge that’s build over the past year. Prices are currently trading below the support side of that formation, although that’s happened previously as of a few weeks ago when prices hurriedly pushed down to the 1801.47 level.
This could possibly load the argument around support breaks: If buyers are unable to hold range support in the 1825-1836 area, and prices push down to another test around the 1800-handle, there could be deeper breakdown potential as both range and symmetrical triangle support would have been tested through.
To learn more about the symmetrical triangle, check out DailyFX Education
Gold Daily Price Chart
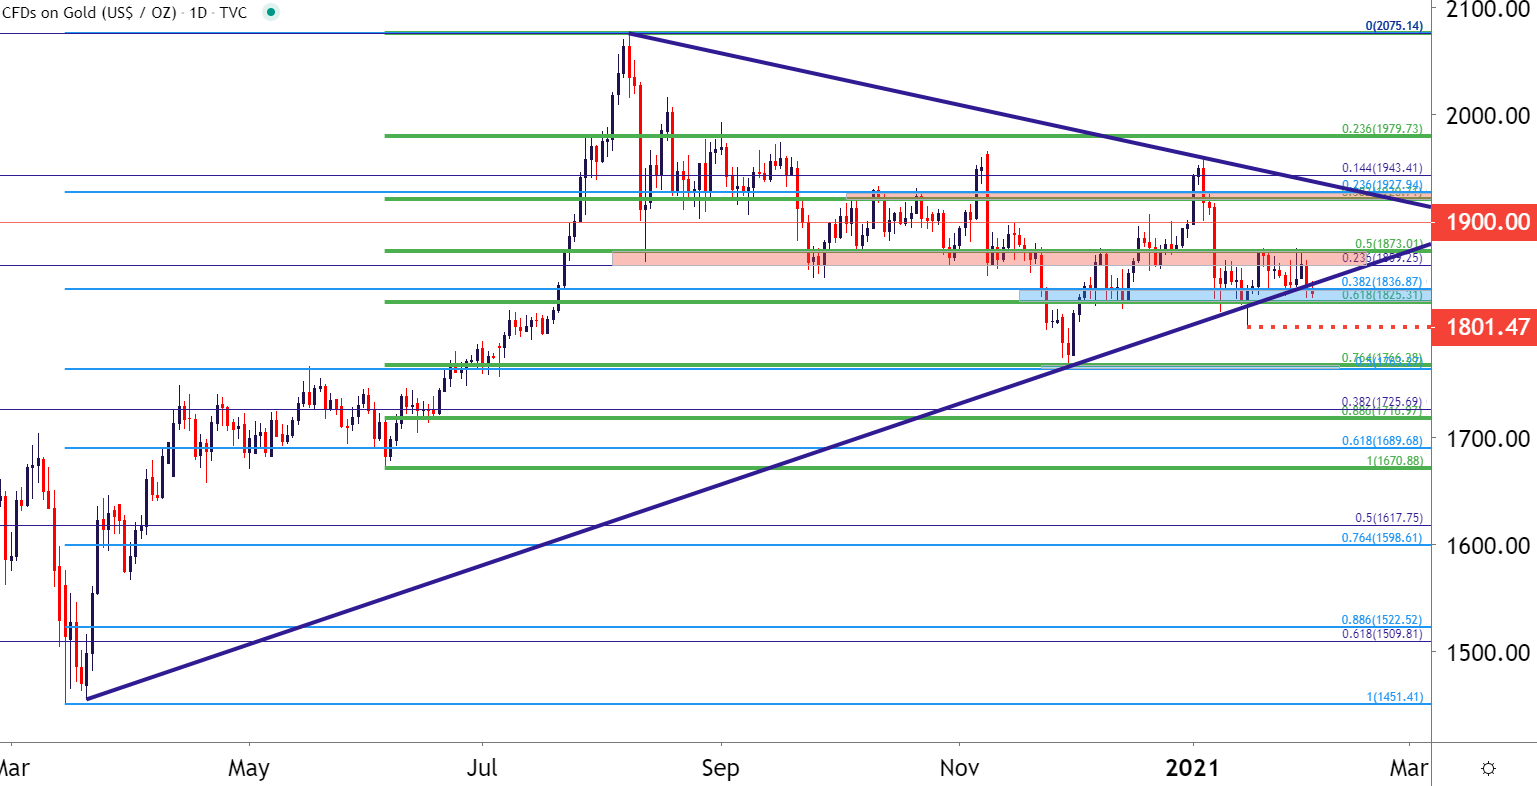
Chart prepared by James Stanley; Gold on Tradingview
Gold Strategy Near-Term
When traders find a range, there’s really just a few ways of addressing it. Avoiding it and looking for a trend is certainly one route; but as far as action is concerned, traders can either look for the range to continue or wait for the range to break.
Given that prices are testing below the support side of the symmetrical triangle, there could be enhanced hopes for some breakdown potential. If this shows up, the 1800-1801 area becomes another item of possible support, after which the confluent zone around the 1763-1766 comes into the picture.
For those that are looking for range continuation, a hold of support is key, with focus on the range resistance zone that’s already held a few different tests over the past few weeks.
Gold Four-Hour Price Chart

Chart prepared by James Stanley; Gold on Tradingview
— Written by James Stanley, Senior Strategist for DailyFX.com
Contact and follow James on Twitter: @JStanleyFX
Be the first to comment