

Gold Price Forecast Talking Points:
Gold prices have spent more than nine months in a retracement. After topping-out in August of last year, what initially seemed like a pullback took on a different tone. Gold prices were in varying stages of pullback whilst sticking within a bearish trend channel.
A lot has happened over the past nine months. To put this into relative scope, when Gold topped on August 7th, Bitcoin was trading below $12,000. Ethereum was below $400, and Dogecoin was still a joke of a meme coin that few took seriously.
But as inflation numbers have started to tick-up with the Fed still saying that they’re not overly worried about higher prices, buyers have started to re-appear in Gold and the yellow metal is now trading at a fresh three-month-high while testing through a major spot of resistance around the $1860 handle.
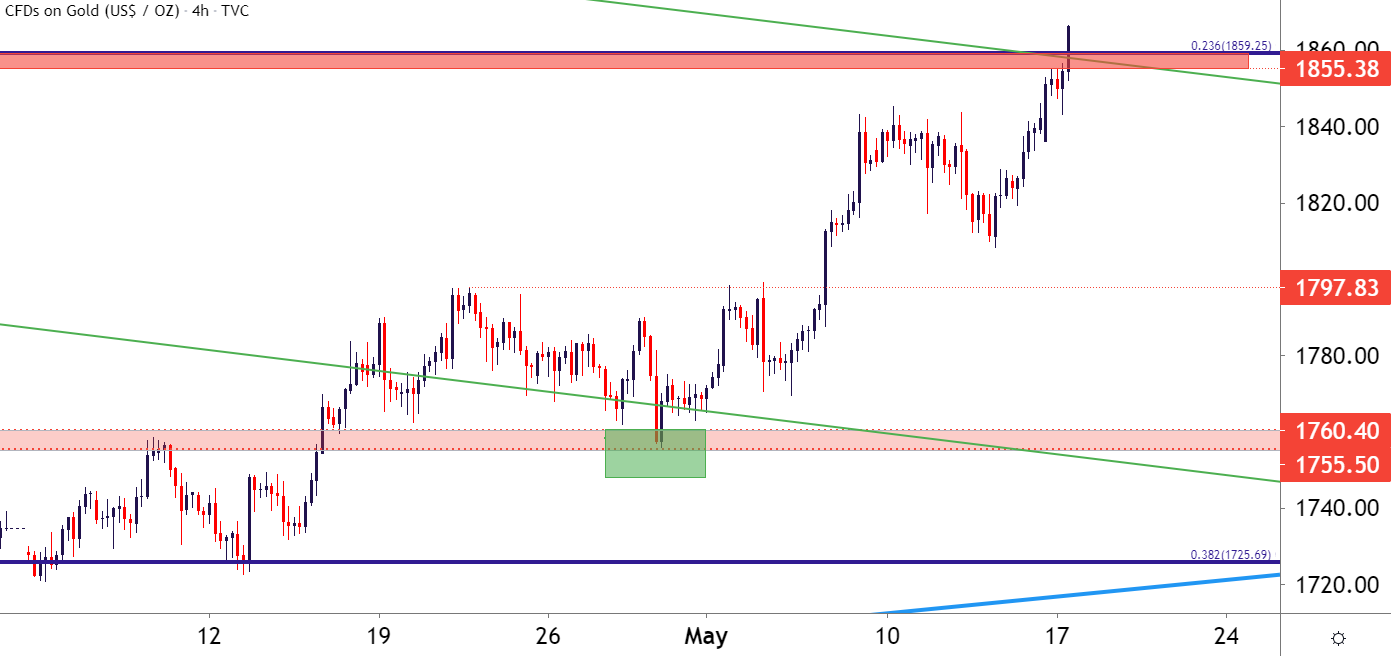
Gold Four-Hour Price Chart
Chart prepared by James Stanley; Gold on Tradingview
Gold Prices: The Big and Small Pictures Converge
Taking a step back and the past nine months of pullback becomes a bit less daunting. I’ve been following this throughout the move, but it was the month of March when matters appeared to be shifting back into the direction of bulls.
In the middle of the month, I noted a critical support test taking place at a confluent spot on the chart. Gold prices had just started to test a trend-line projection, and that projection landed very near the 38.2% retracement of the 2018-2020 major move.
A couple of weeks later, a secondary support test at that same spot opened the door for a double bottom formation in the early-days of Q2. A double bottom showing up was likely an item of excitement for bulls, as this is often looked to for bullish reversal potential. For the formation to fill-in, a break of the ‘neckline’ is needed, and that happened a couple of weeks into April.
Gold prices were even so courteous as to offer bulls another shot at re-entry, pulling back to support at that neckline of resistance just a couple of weeks later. And since then, prices have been flying-higher.
To learn more about the double bottom formation, check out DailyFX Education
Gold Daily Price Chart
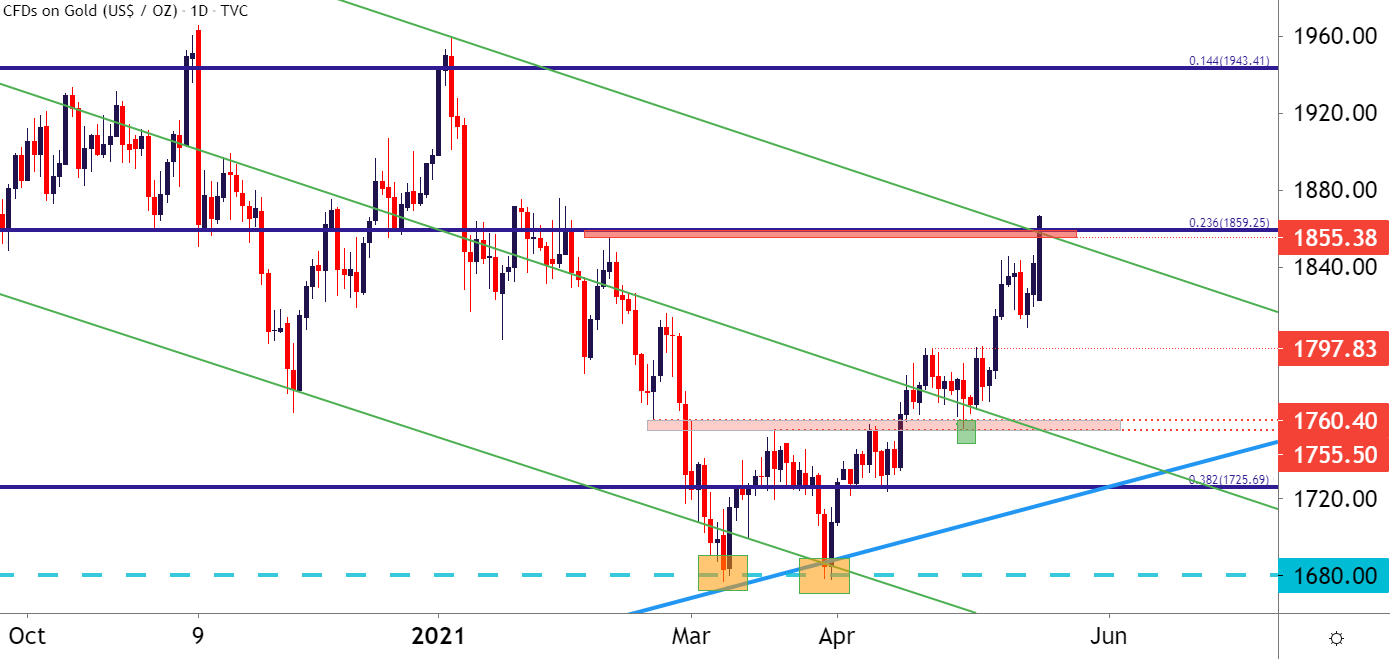
Chart prepared by James Stanley; Gold on Tradingview
Gold Big Picture: Is the Next Wave of the Bullish Cycle Already Starting?
It’s the longer-term chart that’s most compelling here, at least in my opinion.
When the Fed was responding to Covid in February and March of last year, Gold was the area that started to really rally in the aftermath, jumping throughout the summer to finally set that all-time-high in August. But, along the way, Gold prices became very overbought from a number of vantage points and it was surprising, at least to me, that it rallied as aggressively as it did for as long as it could.
Well, the corresponding pullback/retracement has been similarly elongated, taking a full nine months before buyers were able to test above the bull flag formation. But, if this is, in fact, the big picture bullish trend coming back in order, there could be considerable room for bulls to run.
On the below weekly chart, I’m looking at a couple areas of interest for the next spot of resistance. The first is around the 1900 psychological level, and the second is around the 14.4% Fibonacci retracement of the 2018-2020 major move, plotted around the 1943 area. Beyond that, the 2k level remains key, and after that the all-time-high comes into the equation, which is currently around 11% away from current spot Gold prices.
Gold Weekly Price Chart
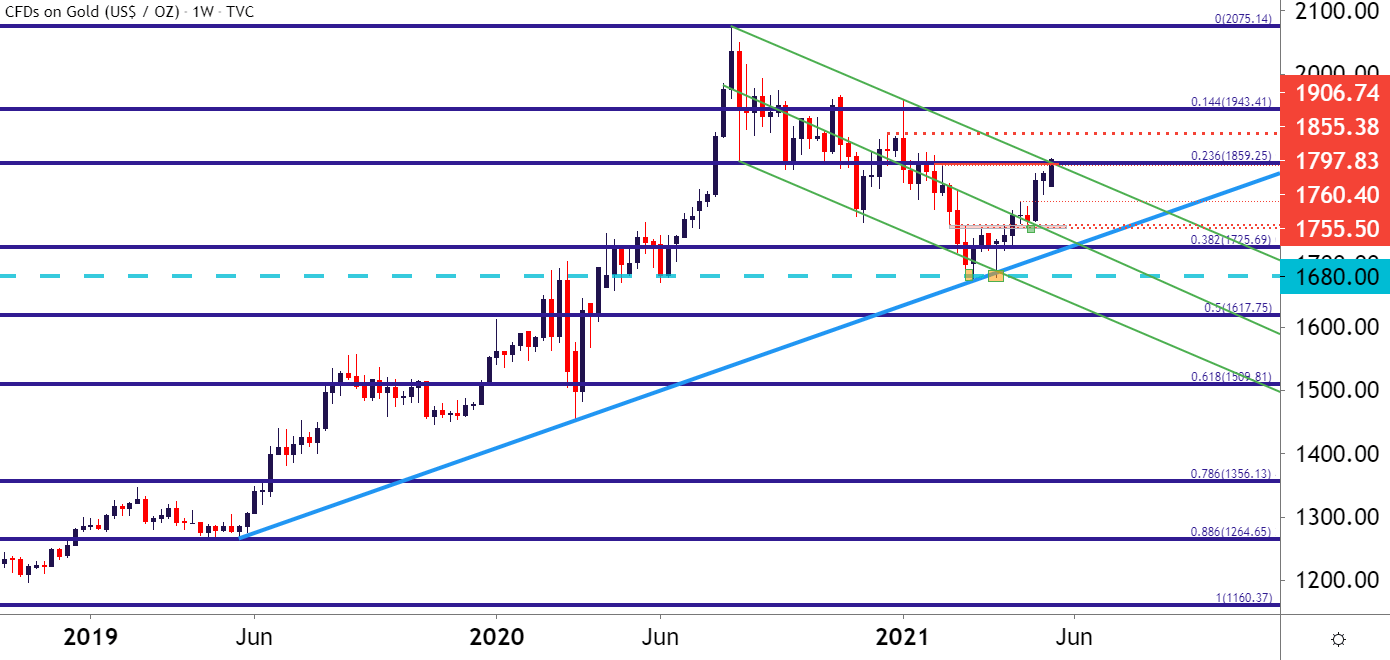
Chart prepared by James Stanley; Gold on Tradingview
— Written by James Stanley, Strategist for DailyFX.com
Contact and follow James on Twitter: @JStanleyFX
Be the first to comment