

Gold Price Talking Points
The price of gold continues to defend the November low ($1759) as it bounces back from a fresh weekly low ($1767), but the Federal Reserve’s last interest rate decision for 2021 may produce headwinds for bullion if the central bank shows a greater willingness to normalize monetary policy sooner rather than later.
Gold Price Continues to Defend November Low Ahead of Fed Rate Decision
The price of gold appears to be reversing ahead of the monthly low ($1762) as it attempts to retrace the bearish reaction to the larger-than-expected rise in the US Producer Price Index (PPI), and the precious metal may consolidate ahead of the Fed rate decision as states across the country reimpose social restrictions in response to the Omicron variant.
It remains to be seen if the Fed will respond to the new strain of COVID-19 as the central bank carries out its exit strategy by “reducing the monthly pace of its net asset purchases by $10 billion for Treasury securities and $5 billion for agency mortgage-backed securities,” but evidence of higher inflation may keep the Federal Open Market Committee (FOMC) on track to implement higher interest rates in 2022 as Chairman Jerome Powell strikes a hawkish tone in front of US lawmakers.
As a result, bullion may face headwinds if the FOMC decides to winddown its quantitative easing (QE) program at a faster pace, and the price of gold may threaten the opening range for December if the update to the Fed’s Summary of Economic Projections (SEP) may reveals a steeper path for the Fed Funds rate.
Meanwhile, more of the same from Chairman Powell and Co. may generate a larger rebound in the price of gold as market participants push out bets for higher US interest rates, and the precious metal may trade within a defined range over the remainder of the year as long as it defends the November low ($1759).
With that said, the Fed’s last rate decision for 2021 may influence the near-term outlook for the price of gold if the central bank adjusts the forward guidance for monetary policy, but the precious metal may trade within a defined range over the remainder of the year if the FOMC sticks to the current exit strategy.
Gold Price Daily Chart
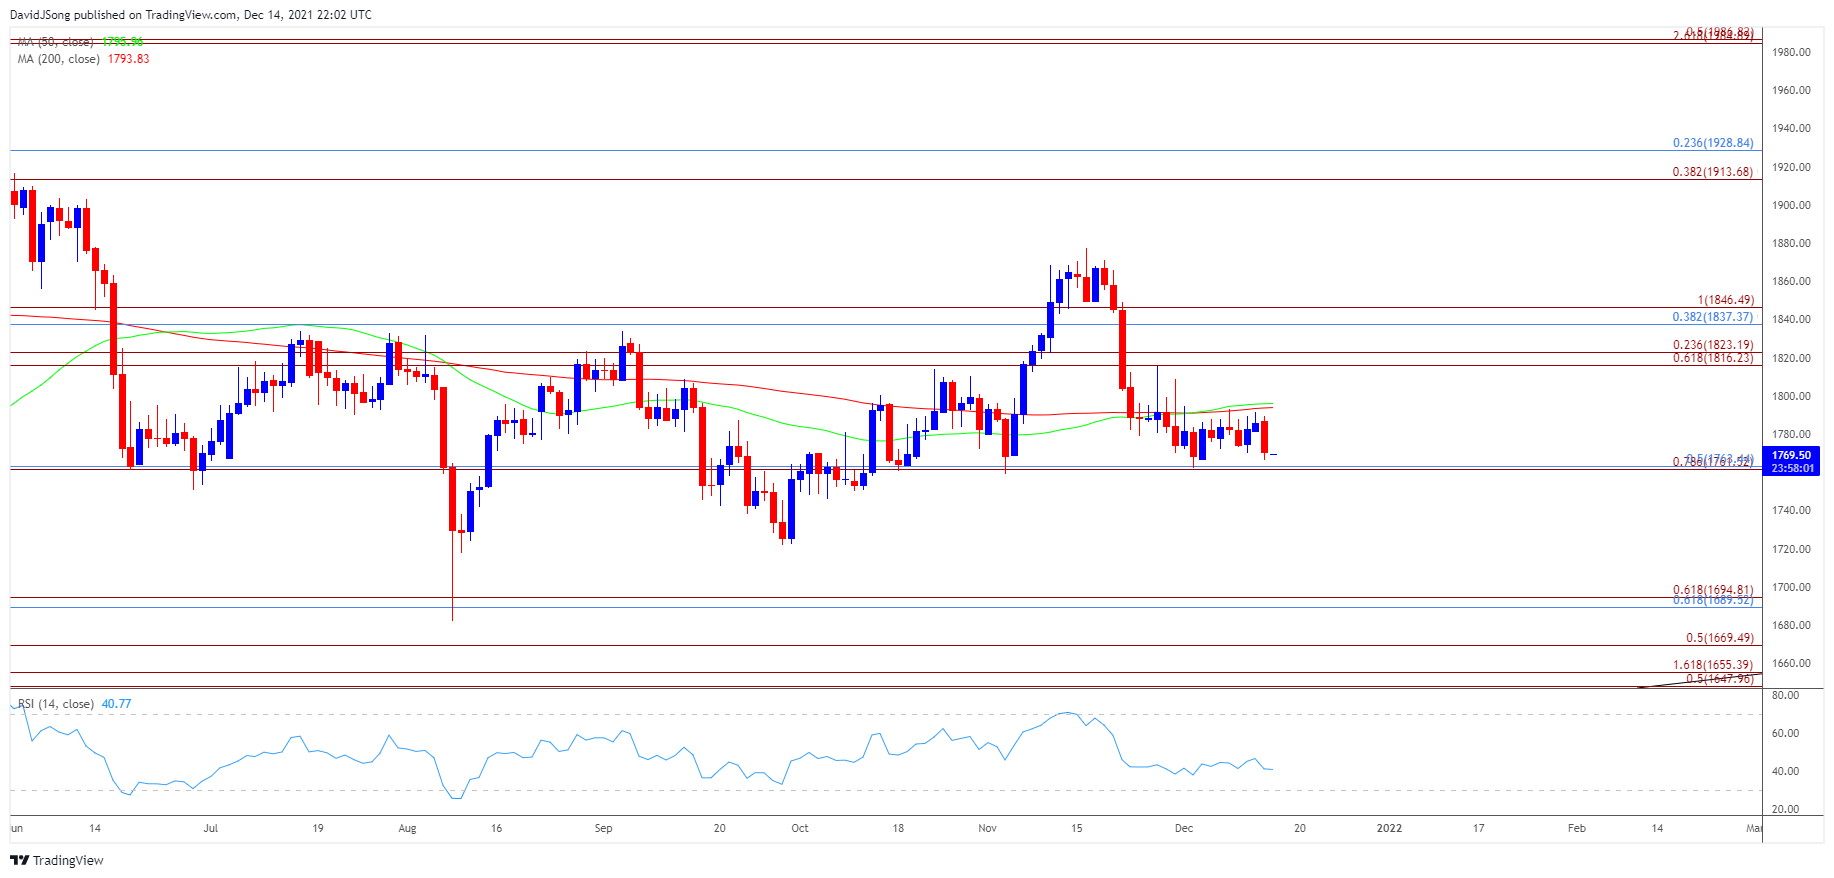
Source: Trading View
- The broader outlook for the price of gold has become flat as the 50-Day SMA ($1796) and 200-Day SMA ($1794) start to converge with one another, and the precious metal may trade within a defined range as it continues to defend the November low ($1759).
- The string of failed attempts to break/close below the $1762 (78.6% expansion) to $1763 (50% retracement) region may push the price of gold back toward the moving averages, with a break above the monthly high ($1795) opening up the $1816 (61.8% expansion) to $1823 (23.6% expansion) area.
- Next area of interest comes in around $1837 (38.2% retracement) to $1847 (100% expansion), with a break above the November high ($1877) opening up the Fibonacci overlap around $1914 (38.2% expansion) to $1929 (23.6% retracement).
- However, a break/close below the $1762 (78.6% expansion) to $1763 (50% retracement) region may push the price of gold towards the September low ($1722), with the next area of interest coming in around $1690 (61.8% retracement) to $1695(61.8% expansion), which sits just above the August low ($1682).
— Written by David Song, Currency Strategist
Follow me on Twitter at @DavidJSong
Be the first to comment