

Gold Price Talking Points
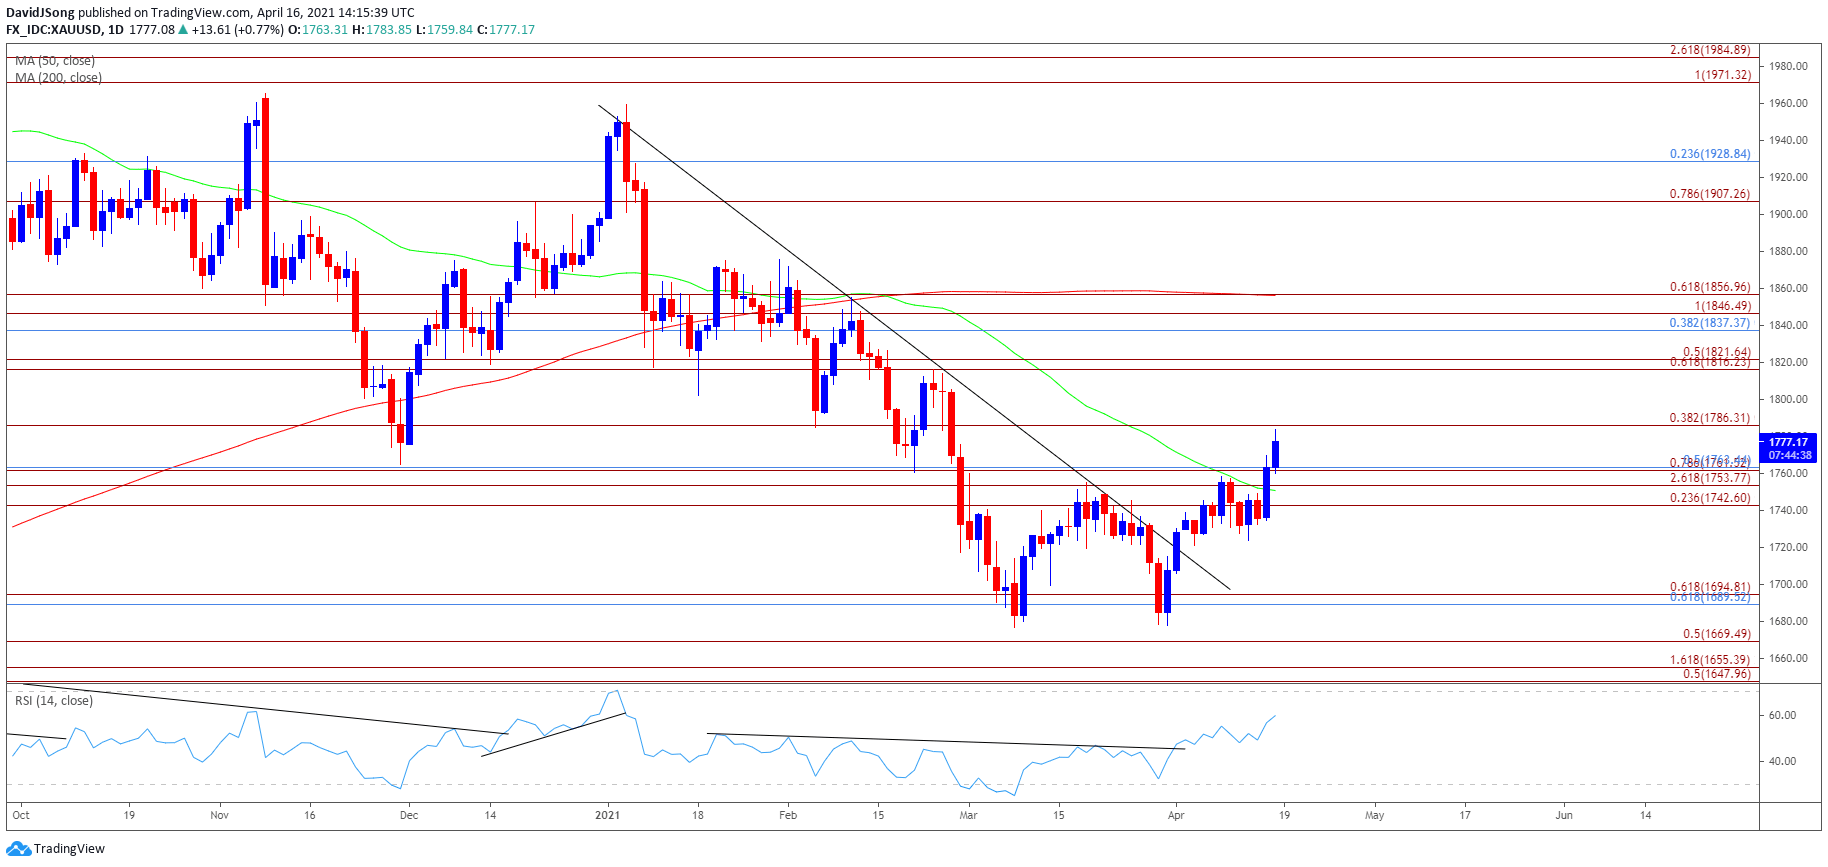
Gold breaks out of the range bound price action from earlier this week as the 10-Year US Treasury yield slips to a fresh monthly low (1.53%), and the break above the March high ($1760) may push bullion towards the February high ($1872) as key reversal appears to be unfolding in April.
Gold Price Clears March High as Dovish Fed Rhetoric Drags on US Yields
The price of gold appears to have reversed course after carving a double-bottom in March, with the precious metal trading above the 50-Day SMA ($1751) for the first time since February amid the ongoing weakness in longer-dated US Treasury yields.
The bullish price action in gold comes as Federal Reserve officials push a dovish forward guidance, with Vice Chair Richard Clarida warning that “the substantial decline in the neutral policy rate since 2012 has critical implications for monetary policy because it leaves the FOMC (Federal Open Market Committee) with less conventional policy space to cut rates to offset adverse shocks to aggregate demand” while speaking at a virtual event held by the Manhattan Institute’s Shadow Open Market Committee.
In turn, Vice Chair Clarida states that “the Committee expects to delay liftoff from the ELB (effective lower bound) until PCE (personal consumption expenditures) inflation has risen to 2 percent,” with the official going onto say that “the Committee will aim to achieve inflation moderately above 2 percent for some time in the service of keeping longer-term inflation expectations well anchored.”
The comments suggest the FOMC is in no rush to switch gears as “the Committee expects to delay liftoff until inflation is on track to moderately exceed 2 percent for some time,” and the FOMC may continue to endorse an outcome based approach as its next interest rate decision on April 28 as Vice Chair Clarida insists that “policy will not tighten solely because the unemployment rate has fallen below any particular econometric estimate of its long-run natural level.”
Until then, a further decline in US Treasury yields my keep the price of gold afloat as the FOMC appears to be on track to retain the current course for monetary policy, and the break above the March high ($1760) may push bullion towards the February high ($1872) as a double-bottom formation appears to be unfolding in April.
However, the decline from record high ($2075) may continue to underscore a change in trend as a ‘death cross’ formation takes shape in 2021, and the move back above the 50-Day SMA ($1751) may end up being short lived as the moving average still tracks the negative slope from earlier this year.
Gold Price Daily Chart
Source: Trading View
- Keep in mind, the price of gold pushed to fresh yearly highs throughout the first half 2020, with the bullish price action also taking shape in August as the precious metal tagged a new record high ($2075).
- However, the bullish behavior failed to materialize in September as the price of gold traded below the 50-Day SMA ($1772) for the first time since June, with developments in the Relative Strength Index (RSI) negating the wedge/triangle formation established in August as the oscillator slipped to its lowest level since March.
- Since then, the decline from the record high ($2075) indicates a potential shift in market behavior as the RSI dipped into oversold territory for the first time since 2018, with a ‘death cross’ formation taking shape earlier this year as the 50-Day SMA ($1751) developed a negative slope.
- However, a double bottom appears to have taken shape following the failed attempt to test the June 2020 low ($1671) as the price of gold breaks out of the downward trend from the start of the year, with the price of gold trading above the 50-Day SMA ($1751) for the first time since February.
- The RSI highlights a similar dynamic as it breaks out of a bearish formation, with the break/close above the Fibonacci overlap around $1743 (23.6% expansion) to $1763 (50% retracement) bringing the $1786 (38.2% expansion) region on the radar.
- Next area of interest comes in around $1816 (61.8% expansion) to $1822 (50% expansion) followed by the $1837 (38.2% retracement) to $1847 (100% expansion) region.

Recommended by David Song
Traits of Successful Traders
— Written by David Song, Currency Strategist
Follow me on Twitter at @DavidJSong
Be the first to comment