

Gold Price Talking Points
The price of gold trades to a fresh monthly low ($1805) as US Treasury yields push to fresh yearly highs, and the Federal Reserve interest rate decision may keep the precious metal under pressure as the central bank is expected to deliver another 50bp rate hike.
Gold Price Approaches May Low After Reversing Ahead of 50-Day SMA
The price of gold seems to have reversed course after failing to push back above the 50-Day SMA ($1878), and the precious metal may track the negative slope in the moving average as the Relative Strength Index (RSI) snaps the upward trend carried over from the previous month.
The weakness across precious metal prices may persist as major central banks normalize monetary policy throughout 2022, and the Federal Open Market Committee (FOMC) rate decision may produce headwinds for bullion as the central bank insists that “50 basis point increases in the target range would likely be appropriate at the next couple of meetings.”
As a result, the FOMC is likely signal a further rise in US interest rates as the central bank warns that “a restrictive stance of policy may well become appropriate,” and the committee may prepare US households and businesses for a tightening cycle as the US Consumer Price Index (CPI) climbs to its highest level since 1981.
In turn, the update to the Summary of Economic Projections (SEP) may reveal a shift in the forward guidance for monetary policy if Chairman Jerome Powell and Co. show a greater willingness to push the Fed Funds rate above neutral, and the efforts to curb inflation may continue to dampen the appeal of gold as US yields push to fresh yearly highs.
With that said, the price of gold may continue to carve a series of lower highs and lows as the RSI fails to retain the upward trend from last month, and the FOMC rate decision may push the price of gold toward the May low ($1787) if the central bank shows a greater willingness to carry out a restrictive policy.
Gold Price Daily Chart
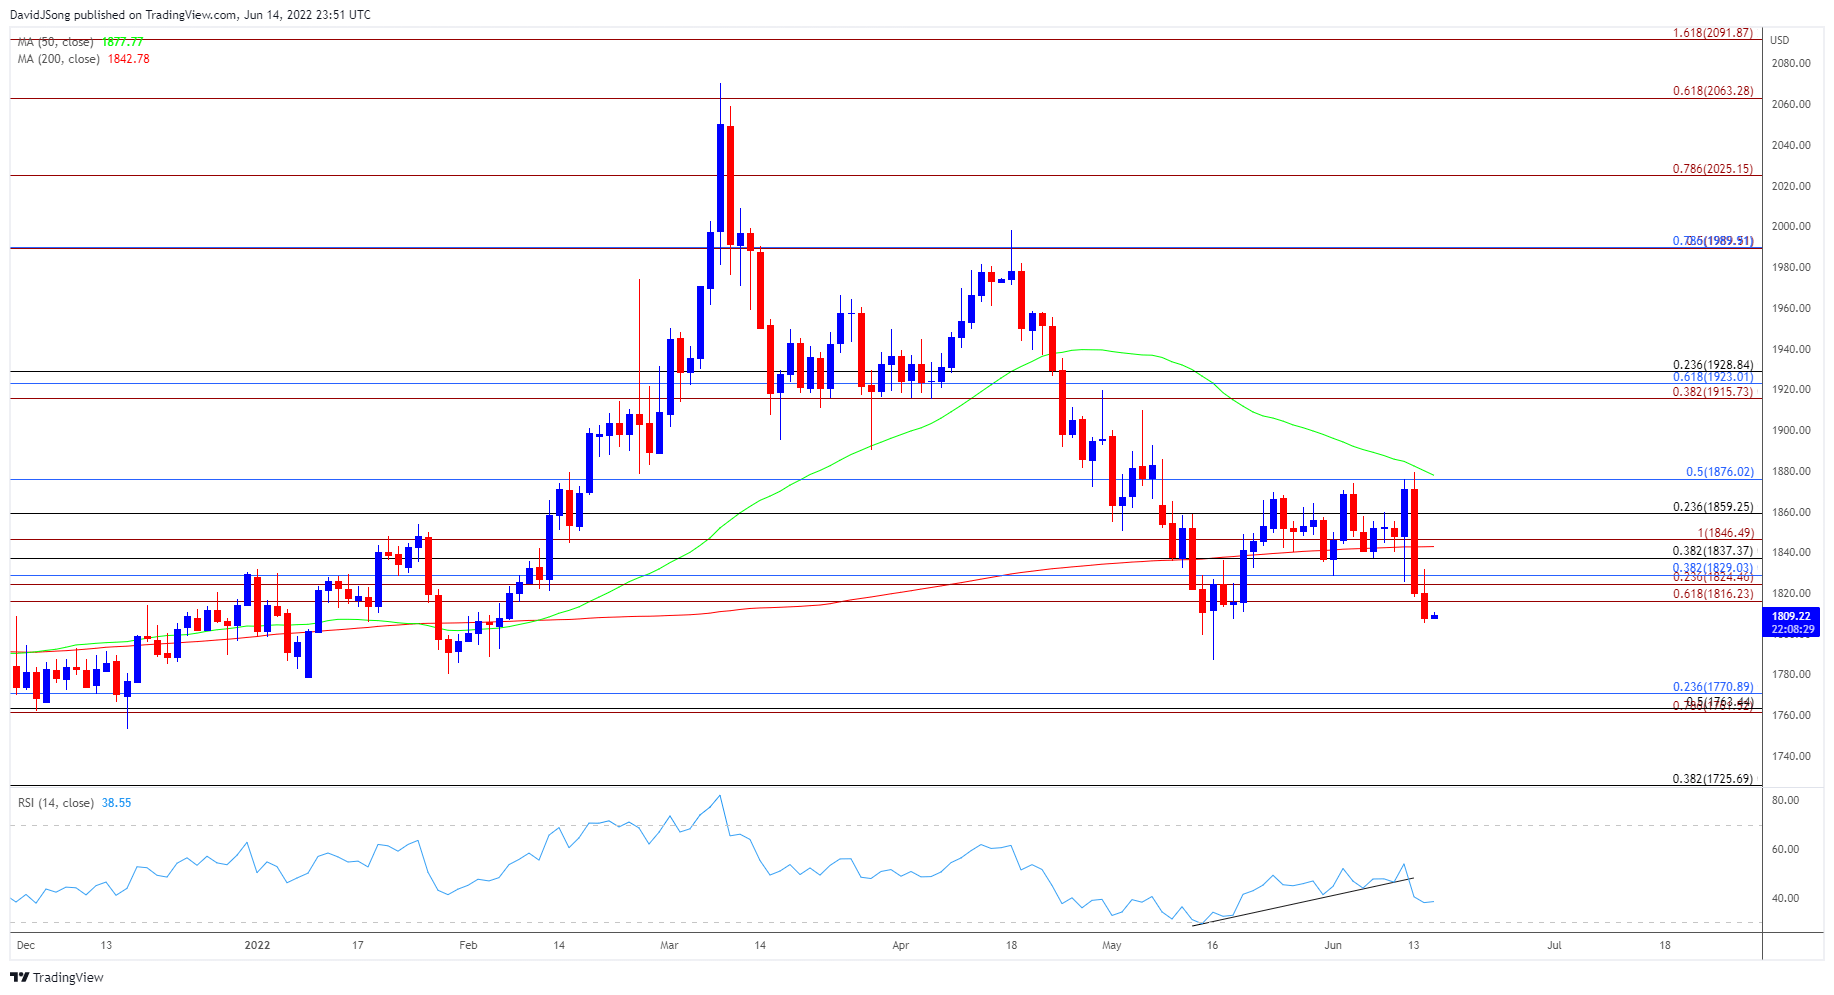
Source: Trading View
- Keep in mind, the price of gold appeared to be on track to test the yearly low ($1779) last month as it traded below the 200-Day SMA ($1843) for the first time since February, but the advance from the May low ($1787) pushed the precious metal back above the moving average as the Relative Strength Index (RSI) developed an upward trend.
- However, the RSI has snapped the upward trend as the 50-Day SMA ($1878) developed a negative slope, with the precious metal reversing ahead of the moving average after failing to close above the $1876 (50% retracement) region.
- The break/close below the $1816 (61.8% expansion) area raises the scope for a test of the May low ($1787), with a move below the yearly low ($1779) opening up Fibonacci overlap around $1762 (78.6% expansion) to $1771 (23.6% retracement).
— Written by David Song, Currency Strategist
Follow me on Twitter at @DavidJSong
Be the first to comment