

Gold price is trading above a major support near $1,850. Similarly, crude oil price must stay above $94.30 to remain in a positive zone.
Important Takeaways for Gold and Oil
· Gold price started a downside correction from the $2,070 high against the US Dollar.
· There is a major bullish trend line forming with support near $1,830 on the daily chart of gold.
· Crude oil price also started a downside correction from the $126.37 high.
· There is a key bullish trend line forming with support near $97.00 on the daily chart of XTI/USD.
Gold Price Technical Analysis
This past month, gold price started a strong increase from the $1,780 support zone against the US Dollar. There was a clear break above the $1,800 and $1,900 resistance levels.
The price accelerated its gains above the $2,000 level and settled well above the 50-day simple moving average. It traded to a new multi-year high at $2,070 on FXOpen. Recently, it started a downside correction below the $2,000 level.
There was a break below the 50% Fib retracement level of the upward move from the $1,780 low to $2,070 high. It even traded below $1,925 and the 50-day simple moving average.
An initial support on the downside is near the $1,872 level. The main support is near the $1,850 level and the 76.4% Fib retracement level of the upward move from the $1,780 low to $2,070 high. There is also a major bullish trend line forming with support near $1,830 on the daily chart of gold.
Any further losses may perhaps open the doors for a larger decline towards the $1,800 and $1,780 levels in the near term. On the upside, an initial resistance is near the $1,925 level.
The first major resistance is near the $1,935 level. A clear break above the $1,935 barrier might call for a move towards $2,000.
Oil Price Technical Analysis
Crude oil price started a strong upward move after it settled above the $94.00 level against the US Dollar. The price gained momentum and broke the $100.00 and $110.00 resistance levels.
It even climbed above the $120 level and the 50-day simple moving average. A new multi-year high was formed near $126.37 before there was a downside correction. The price declined sharply below the $110 level and the 50-day simple moving average.
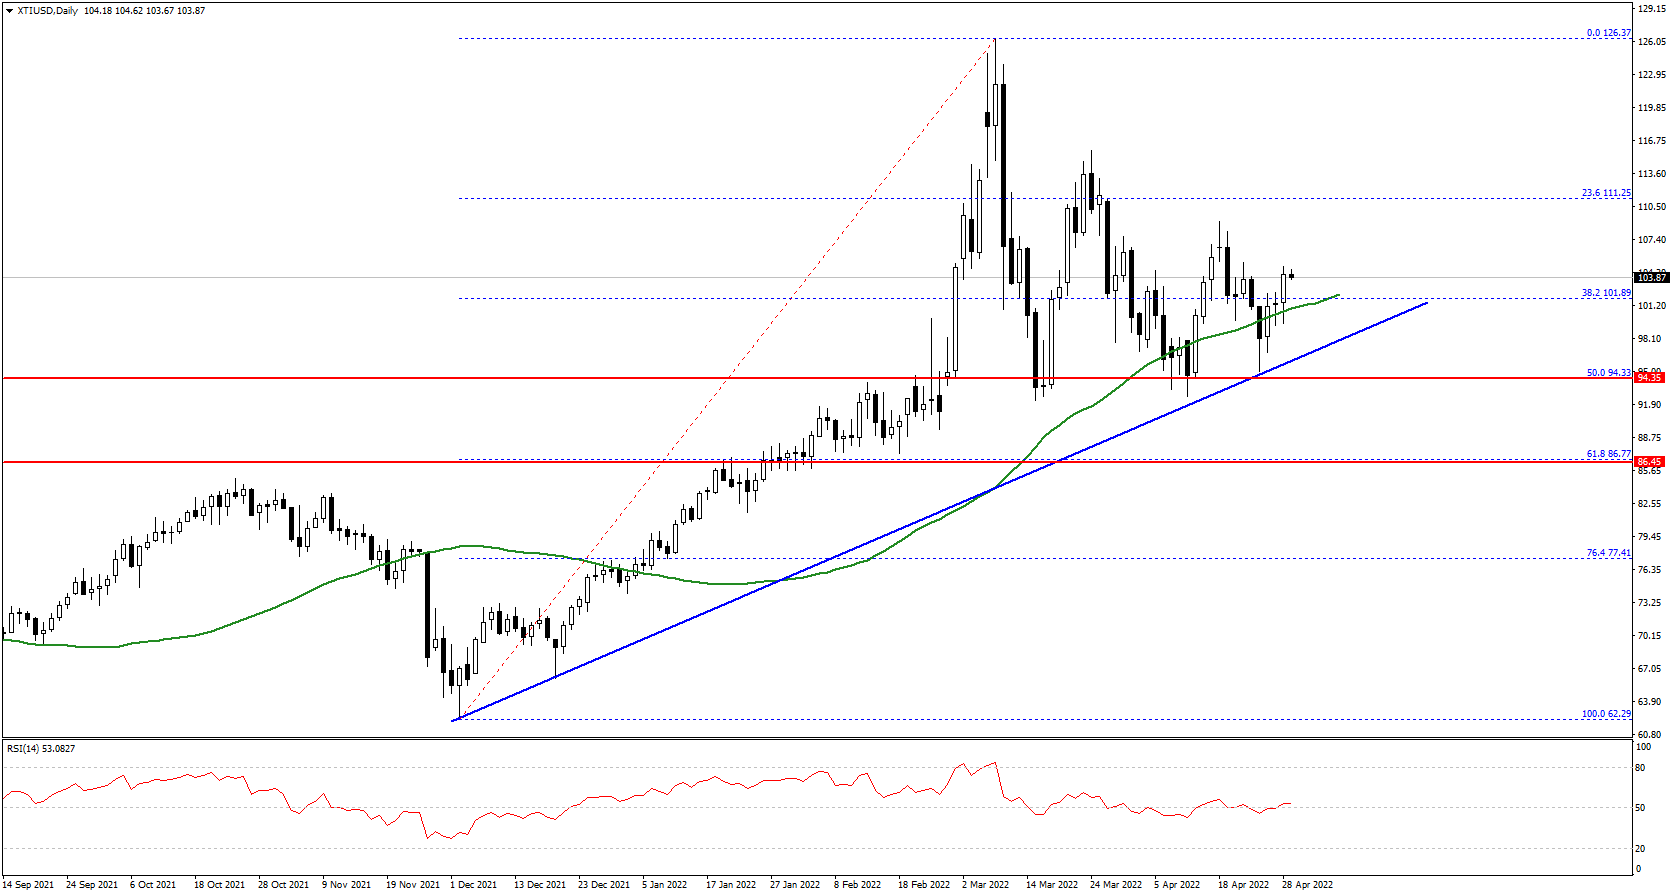
There was a move below the 38.2% Fib retracement level of the upward move from the $62.29 swing low to $126.37 high.
The bulls are now protecting the $95.00 support. There is also a key bullish trend line forming with support near $97.00 on the daily chart of XTI/USD. The trend line is near the 50% Fib retracement level of the upward move from the $62.29 swing low to $126.37 high.
Any further losses may perhaps start a strong decline below $90.00. The next target for the bears might be the $85.00 support zone.
On the upside, the first resistance is near the $105 and $106 levels. A successful break above the $106 level might call for a strong push towards the $115 resistance in the near term. Any further gains could lead the price towards the $120.00 level.
This forecast represents FXOpen Markets Limited opinion only, it should not be construed as an offer, invitation or recommendation in respect to FXOpen Markets Limited products and services or as financial advice.

Be the first to comment