

plastic_buddha
Part I – Introduction
In 2021, Johannesburg-based Gold Fields Ltd. (NYSE:GFI) released the H1 2022 financial year results on August 25, 2022.
Note: This article is an update of my article published on June 2, 2022. I have followed GFI on Seeking Alpha since April 2021. Below is a quick snapshot of the company’s producing assets worldwide.
GFI H1 2022 Assets map Presentation (GFI Presentation)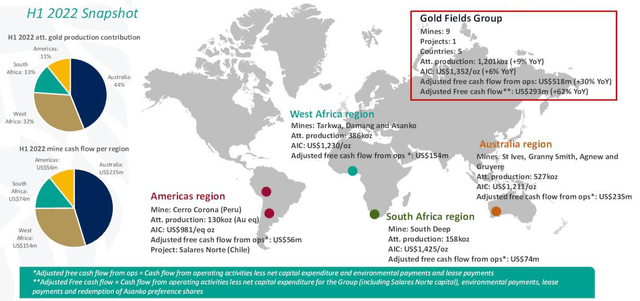
The South African gold miner had a better-than-expected production quarter of 621K Au Oz or 1,201K Au Oz for H1 2022. Revenues for H1 2022 were $2,235.3 million up 12.7% compared to H1 2021.
Revenues for H1 2022 were $2,235.3 million significantly up from 1,983.6 million in H1 2021.
1 – Yamana Gold Acquisition scheduled for mid-November
Gold Fields updated its pending acquisition of Yamana Gold Inc. (AUY). GFI expects to complete the purchase by mid-November (subject to shareholders’ approval).
GFI has significantly underperformed AUY since the deal was announced.
GFI Comparison chart between AUY, GFI, and GDX (Ycharts)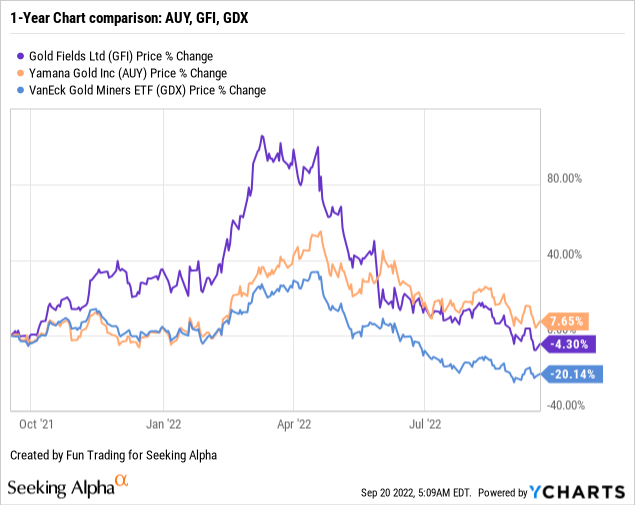
The deal is valued at $6.7 billion and will create a top-four global gold major. I recommend reading my article on this subject by clicking here.
I was not favorable of such a deal, and I wrote:
The problem is that this “good deal” has been sanctioned by a damaging selloff for GFI. It is a piece of news that shareholders generally fear the most. No matter how good the deal can be, the market reaction to a significant acquisition is always the same. A complete surprise that wipes out all the gains in a few hours. In short, investors shot first and asked questions later.
GFI: why acquire AUY? (GFI Presentation)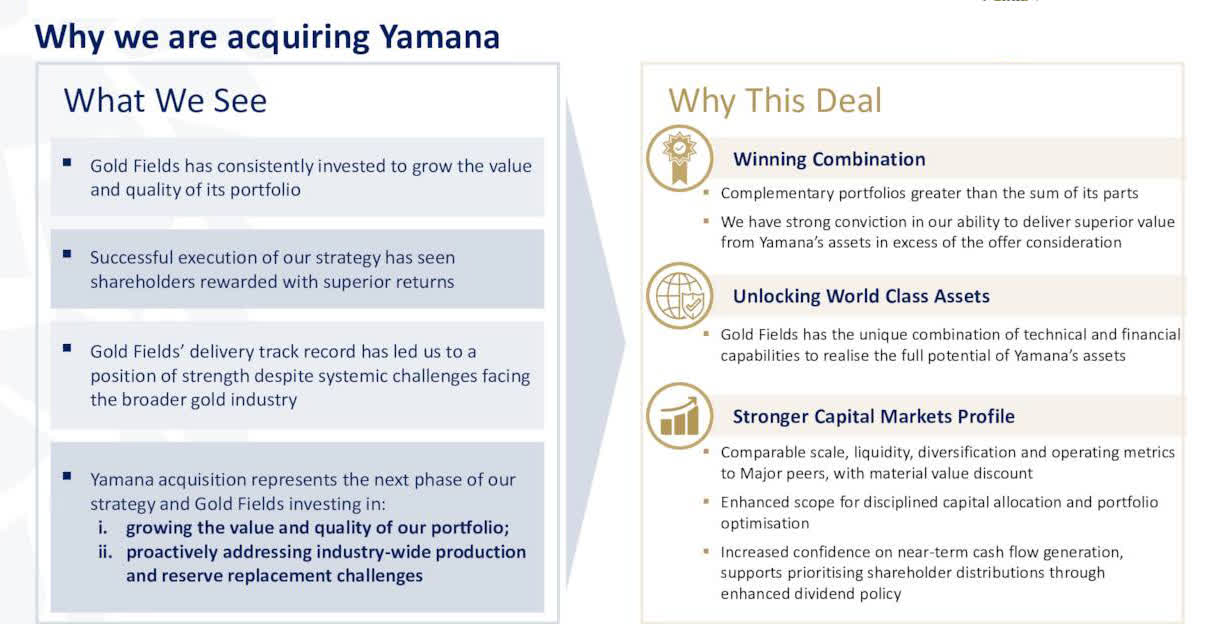
2 – The investment thesis
Gold Fields is an excellent choice for a long-term investment that I recommend in the gold sector. The stock price has dropped significantly over the past five months, and I see it as an opportunity.
The company is globally diversified (Africa, Australia, and South America) and presents a good growth potential with its Salares Norte project, completed at 77% as of June 30, 2021. Furthermore, GFI is about to get bigger with the acquisition of Yamana Gold.
However, Gold Fields Ltd is highly correlated to the gold price even if the company produces a little copper.
The outlook for gold has weakened significantly since the FED decided to fight aggressively concerning inflation. The FED is expected to hike interest rates by 75-point at the end of this week or even more, and we may experience further weakness in the gold sector with the US dollar going stronger.
Thus, it is even more imperative to trade short-term volatility, and I recommend using about 40-50% of your position to take advantage of the short-term ups and downs.
I recommend trading LIFO while keeping a core long-term position for a much higher level and enjoying a significant dividend yield of 4.50% while waiting.
3 – Stock performance
GFI has dropped significantly since April and is down 8% on a one-year basis. However, the stock performed better than most of its peers and the VanEck Vectors Gold Miners ETF (GDX).
GFI 1-Year Chart comparison (Ycharts)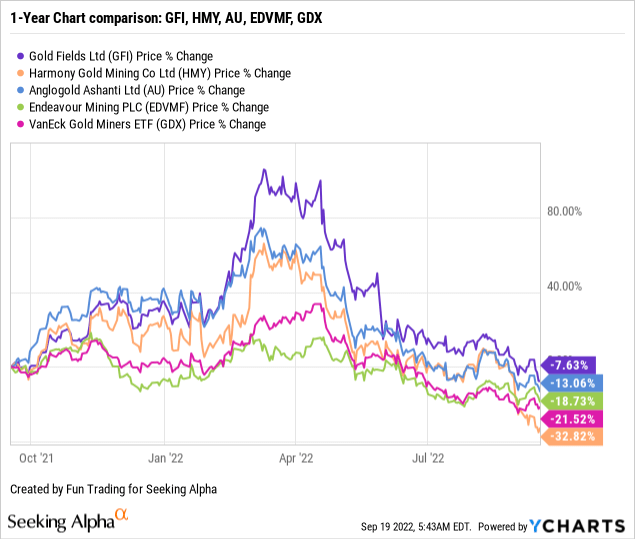
Part II – Gold Fields – Balance sheet and Production history H1 2022: The raw numbers (ADR ratio 1:1)
Note: As most are South African gold and PGM miners, results are posted every six months. However, production is indicated per quarter and six months which can create confusion.
| Gold Fields | H2 2020 | H1 2021 | H2 2021 | H1 2022 |
| Total Revenues in $ Million (6 months) | 2,137.8 | 1983.6 | 2211.6 | 2,235.3 |
| Net income in $ Million (6 months) | 567.5 | 387.4 | 401.9 | 509.7 |
| EBITDA $ Million (6 months) | 1,355.4 | 973.2 | 1077.3 | 1,223.1 |
| EPS diluted in $/share (6 months) | 0.63 | 0.43 | 0.45 | 0.56 |
| Cash from operating activities in $ Million (6 months) | 562.8 | 688.6 | 541.6 | 871.0 |
| Capital Expenditure in $ Million (6 months) | 352.1 | 469.3 | 590.7 | 519.8 |
| Free Cash Flow in $ Million (6 months) | 210.7 | 219.3 | -49.1 | 351.2 |
| Total cash $ Million (6 months) | 886.8 | 703.5 | 524.7 | 724.1 |
| LT Debt (incl. current) in $ Million (6 months) | 1,443.4 | 1,366.6 | 1,078.1 | 1,175.3 |
| Share outstanding diluted in millions | 905.83 | 895.35 | 887.72 | 894.67 |
| Dividend $/ share | 0.2134 | 0.1477 | 0.1720 | 0.1782 |
Source: Company booklet and Fun Trading
Gold Fields: Balance sheet details
1 – Revenues were $2,235.3 million in H1 2022
GFI 6 months Revenues history (Fun Trading)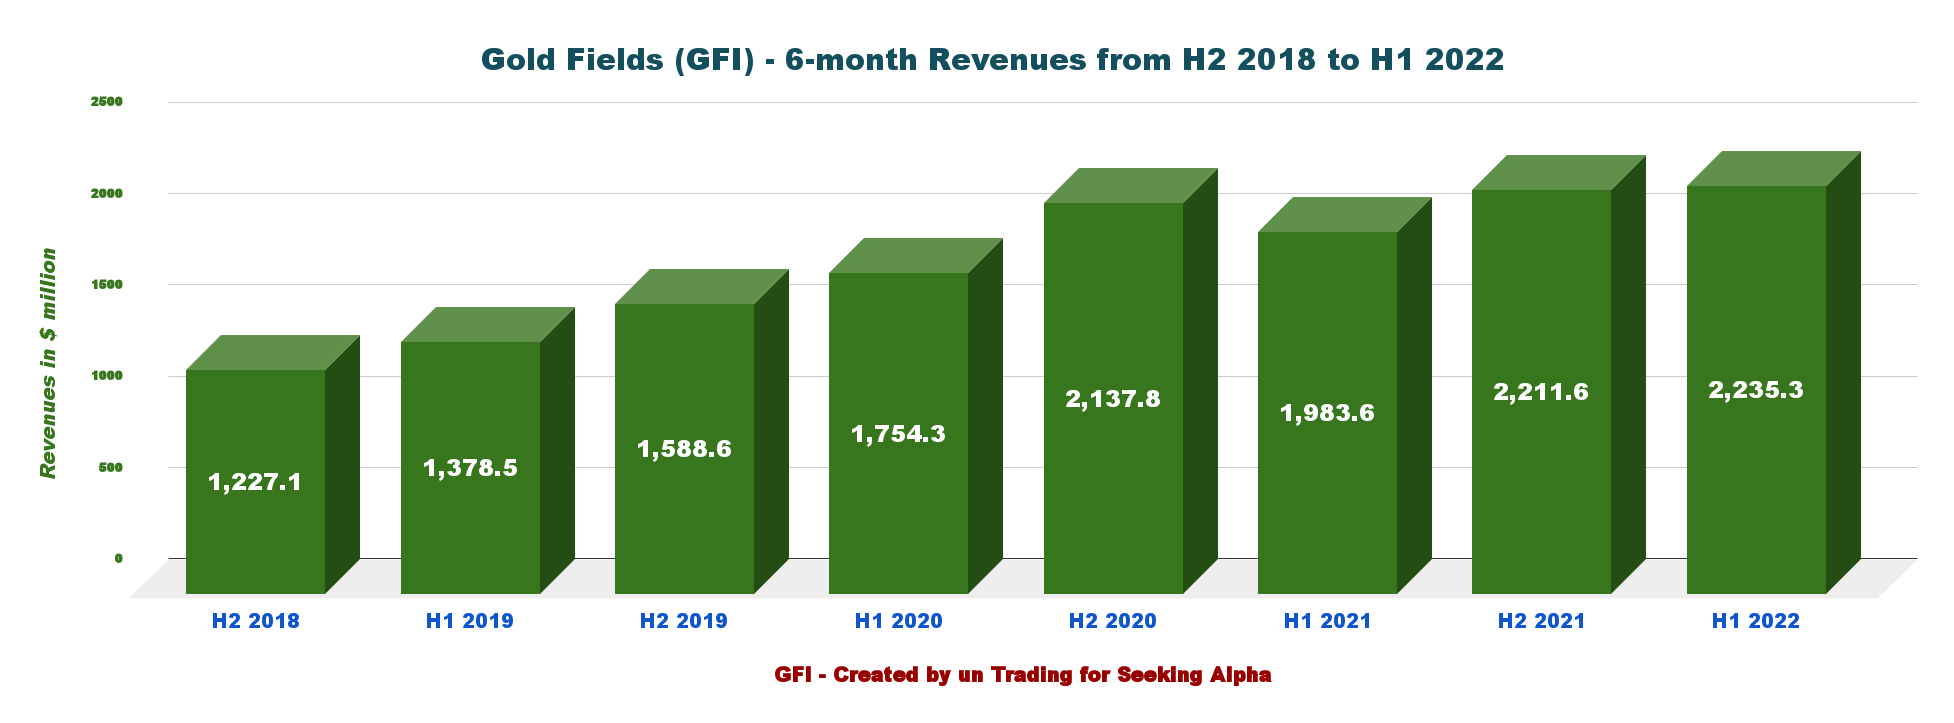
GFI announced revenues of $2,235.3 million for H1 2022, up 12.7% from H1 2021. Net income was $509.7 million or $0.56 per diluted share, up from $387.4 million or $0.44 in H1 2021. Higher production and gold prices were sufficient to offset the impact of rising costs.
The cost of sales before A&D was $923 million in the six months ended June 30, 2022, primarily due to inflationary increases across all regions, partially counterbalanced by the Australian Dollar and South African Rand decline.
2 – Free Cash Flow was $319.9 million in H1 2022
GFI 6 months Free cash flow history (Fun Trading)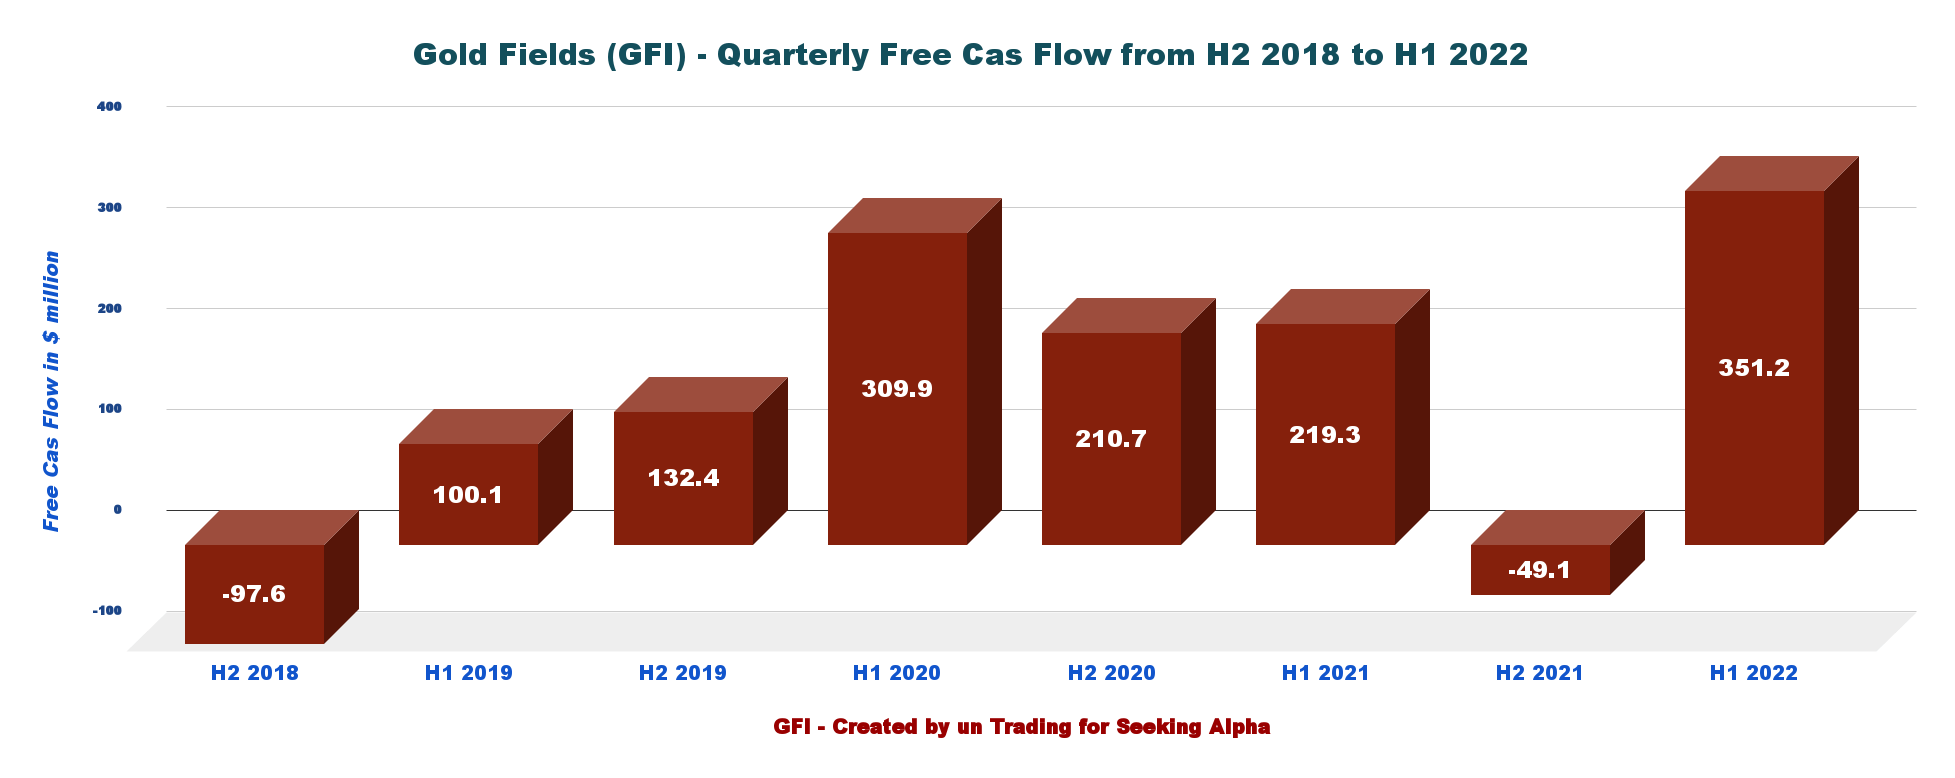
Note: Generic Free cash flow is the cash from operation minus CapEx. The company has a different way of calculating the Free cash flow. The company indicates an adjusted Free cash flow of $293 million.
Trailing 12-month generic free cash flow is $732.1 million, with $351.2 million in H1 2022.
The company said in the press release:
In line with our dividend policy of paying out between 25% and 35% of normalised profit as dividends, we have declared an interim dividend at the upper end of the payout ratio of 300 SA cents per share, which compared with the 2021 interim dividend of 210 SA cents per share. This represents a 43% increase YoY
The interim dividend for H1 2022 is ~$0.1782 per ADR or a yield of 4.50%.
3 – Net Debt is improving. Net debt was $451.2 million at the end of June 2022 (or $851 million, including lease liabilities)
GFI 6 months Cash versus debt history (Fun Trading)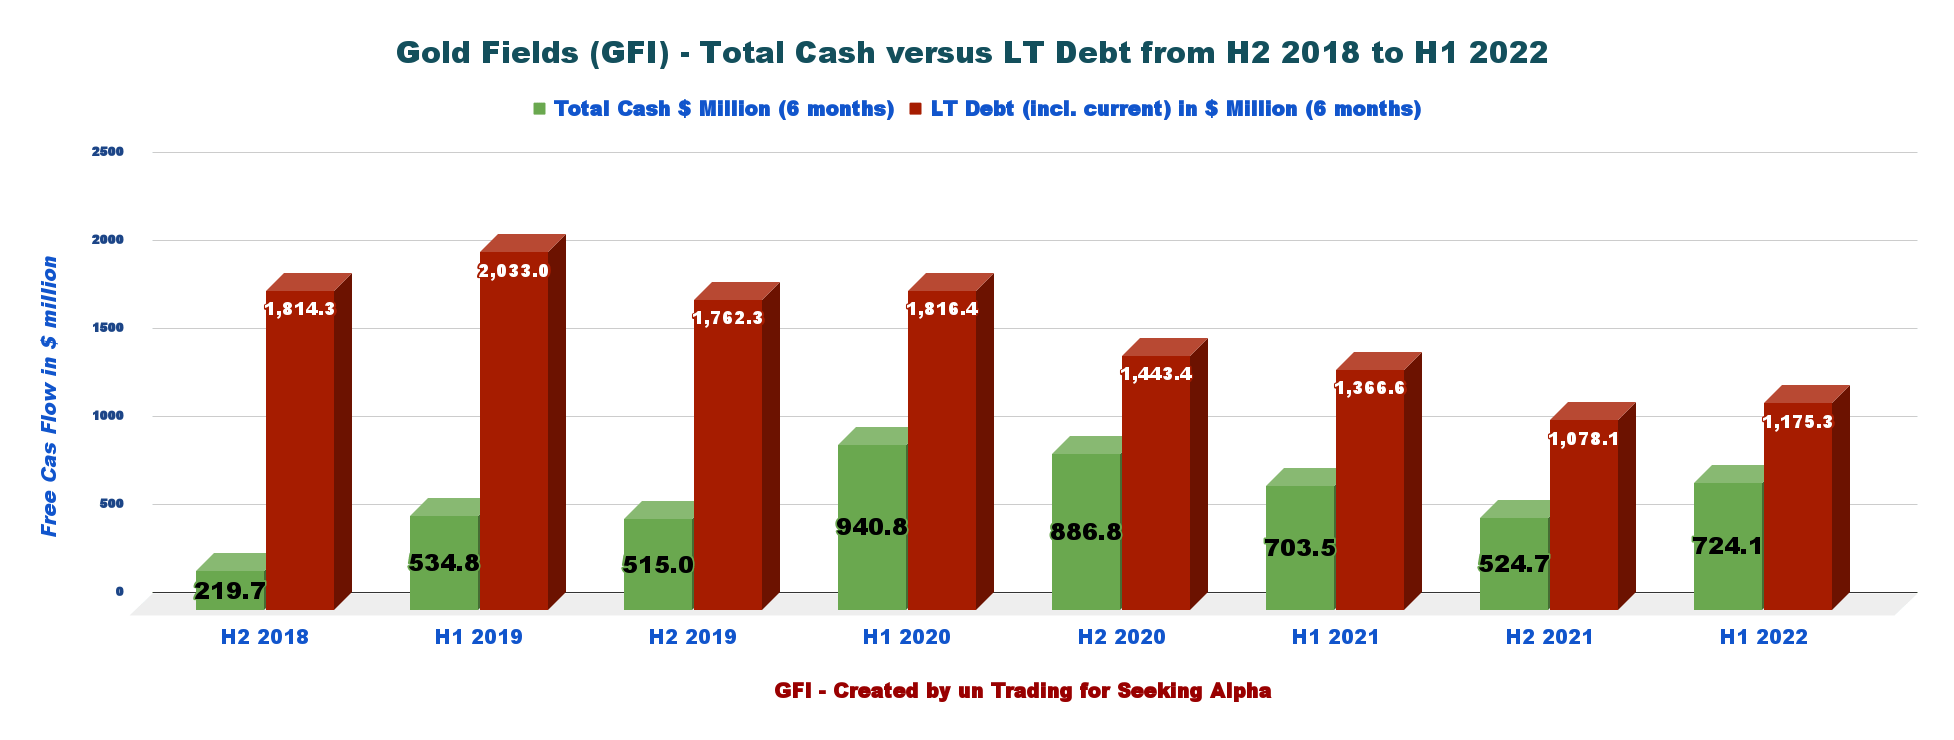
The net debt is now $451.2 million, with a net debt to adjusted EBITDA ratio of 0.33x. The net debt, including lease liabilities, is $851 million.
GFI Balance Sheet presentation (GFI Presentation)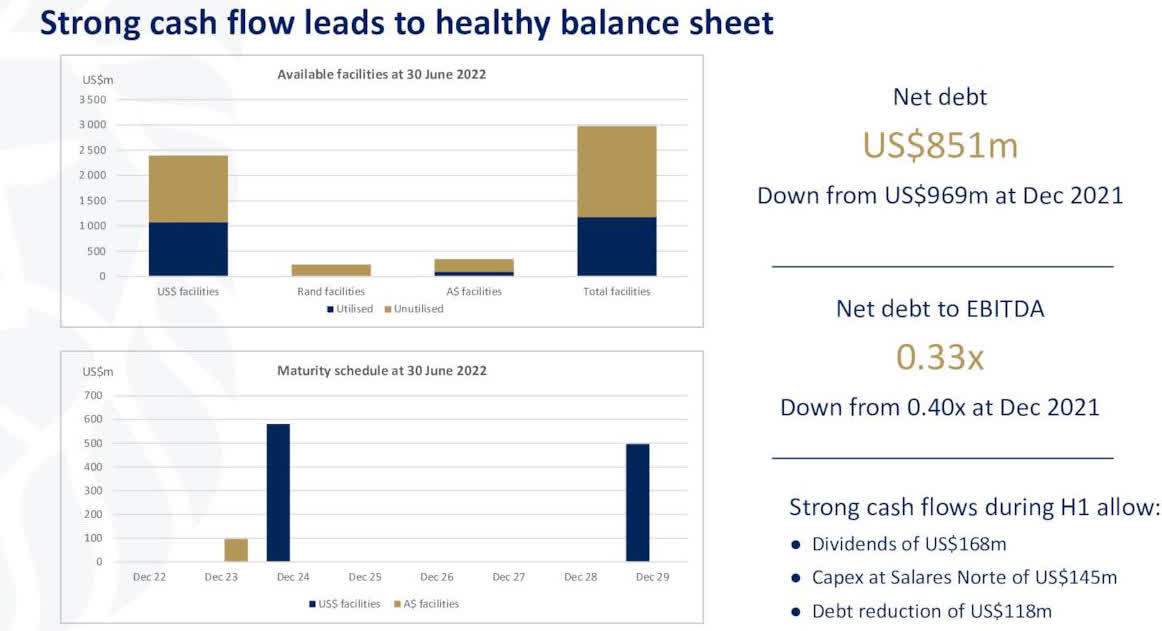
4 – H1 2022 gold equivalent production details
4.1 – Below is the details comparing H1 2022 to H1 2021
AISC went up in 2022 from $1,093 per ounce to $1,148 in H1 2022. However, attributable gold production was 1,200.7K Oz in H1 2022, against 1,104.2K Oz in H1 2021.
One confusing issue is that the company gives a quarterly production as well. Also, investors must differentiate between 100% production and attributable production.
GFI Group gold production (GFI Presentation)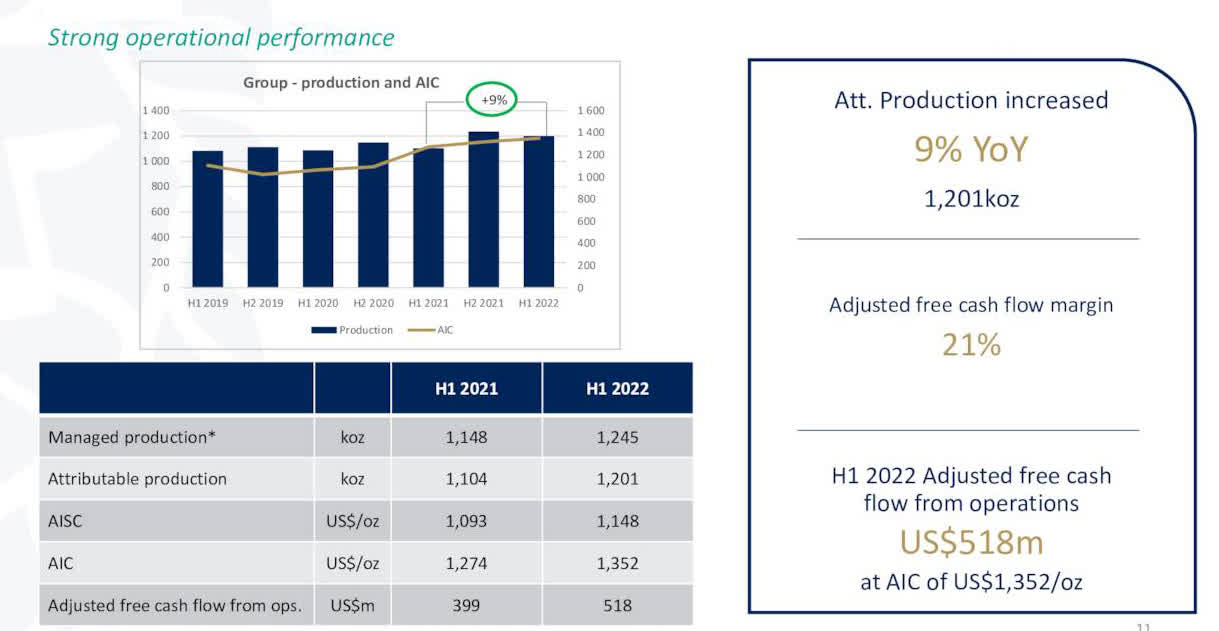
4.2 – The attributable gold equivalent produced in the second quarter of 2021 was 620.7K Au Oz, and Production for H1 2022 was 1,200.7K Au Oz.
Attributable production was 620.7K ounces in2Q22, compared to 580K ounces in 1Q22. To compare H1 2022 versus H1 2021, you add 1Q22 plus 2Q22 for H1 2022 and 1Q21 plus 2Q21 for H1 2021.
GFI Quarterly production history (Fun Trading)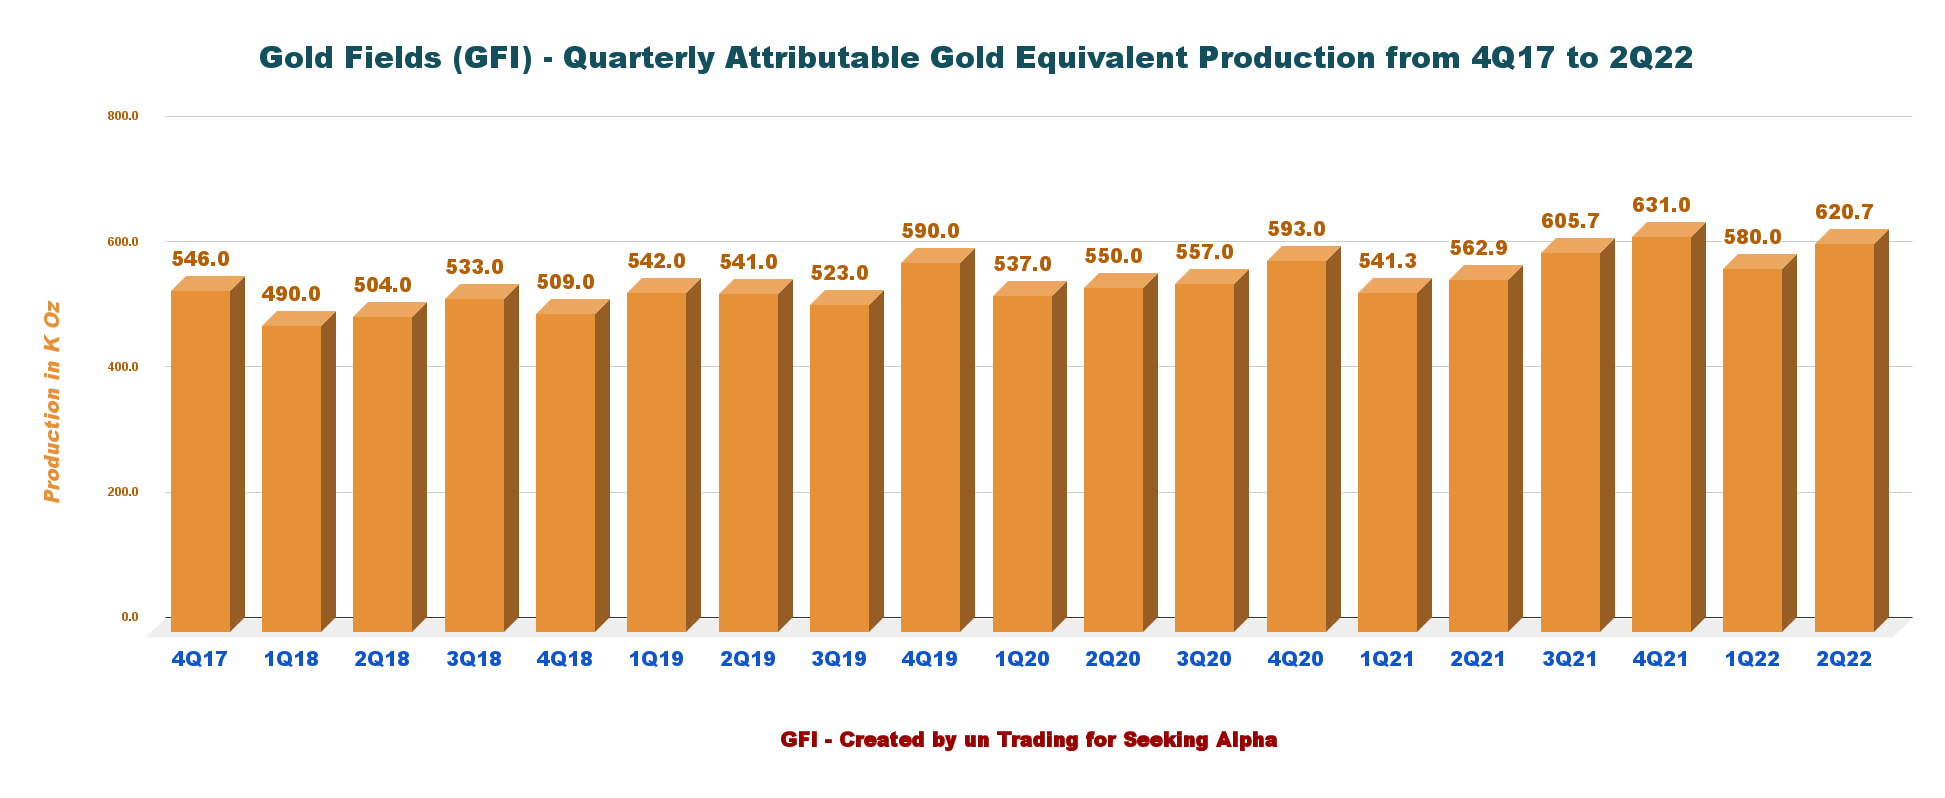
4.3 – Gold Fields operates nine mines and one project in five countries across the globe.
- West Africa generated 33.3% of the group’s earnings (consolidated basis)
- Australia 41.8%
- South Africa 13.4%
- And the Americas region, Cerro Corona in Peru of 11.5%.
A majority of the producing mines are partially owned, as you can see in the chart below:
GFI Production per mine H1 2022 (Fun Trading)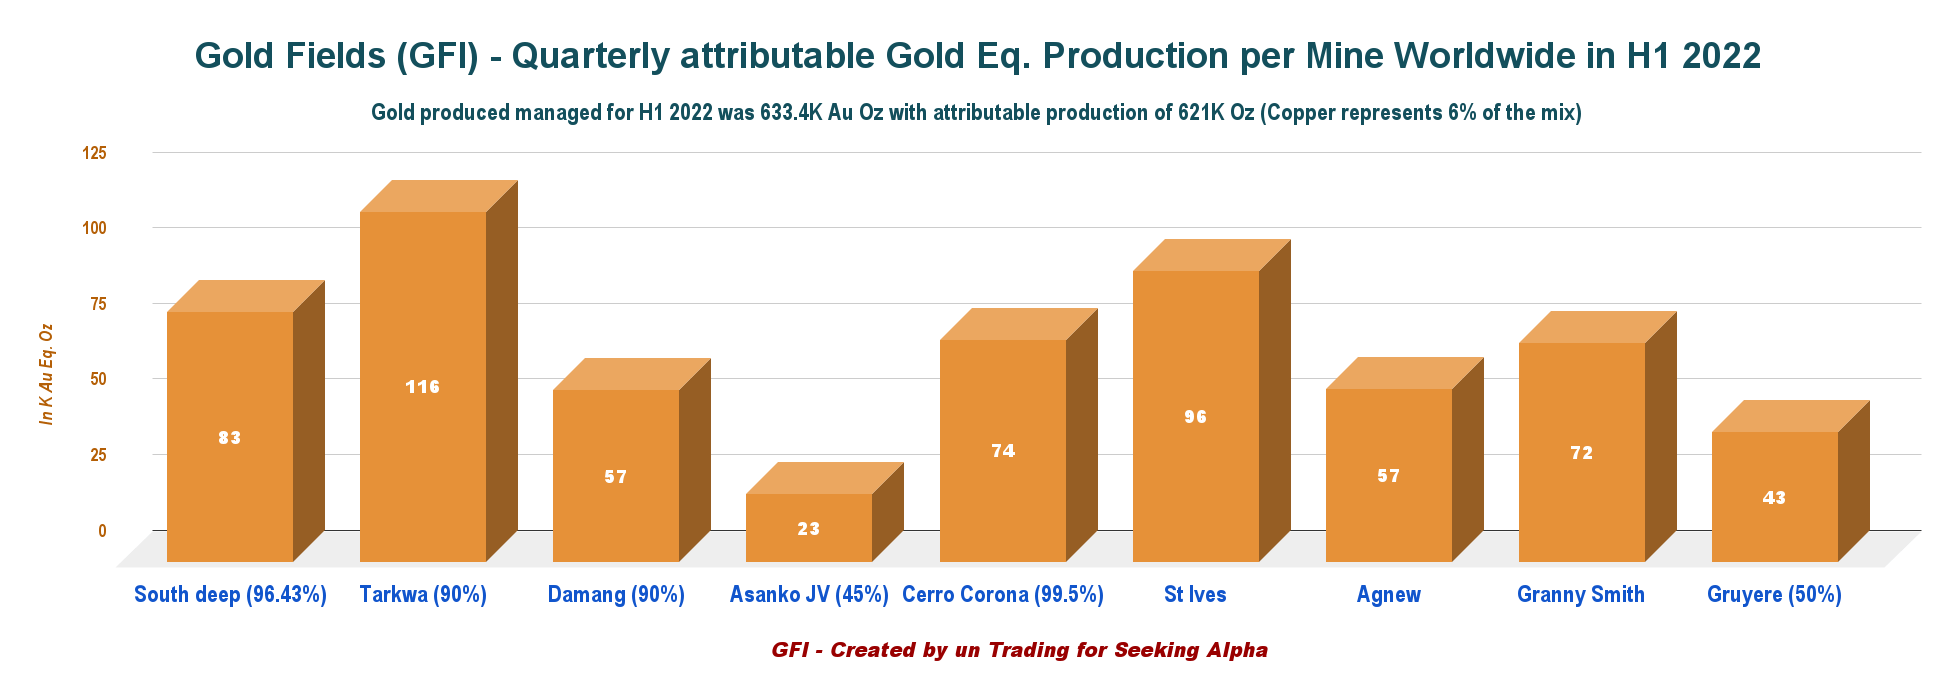
4.4 – AISC and Gold price history.
Inflationary pressures are hurting. Total CapEx was $519.8 million in H1 2022, up from $469.3 million the preceding semester. The gold price was $1,820 per ounce compared to $1,884 per ounce in 1Q22. AISC for 2Q22 is $1,146 per ounce.
GFI Quarterly Gold price and AISC history (Fun Trading)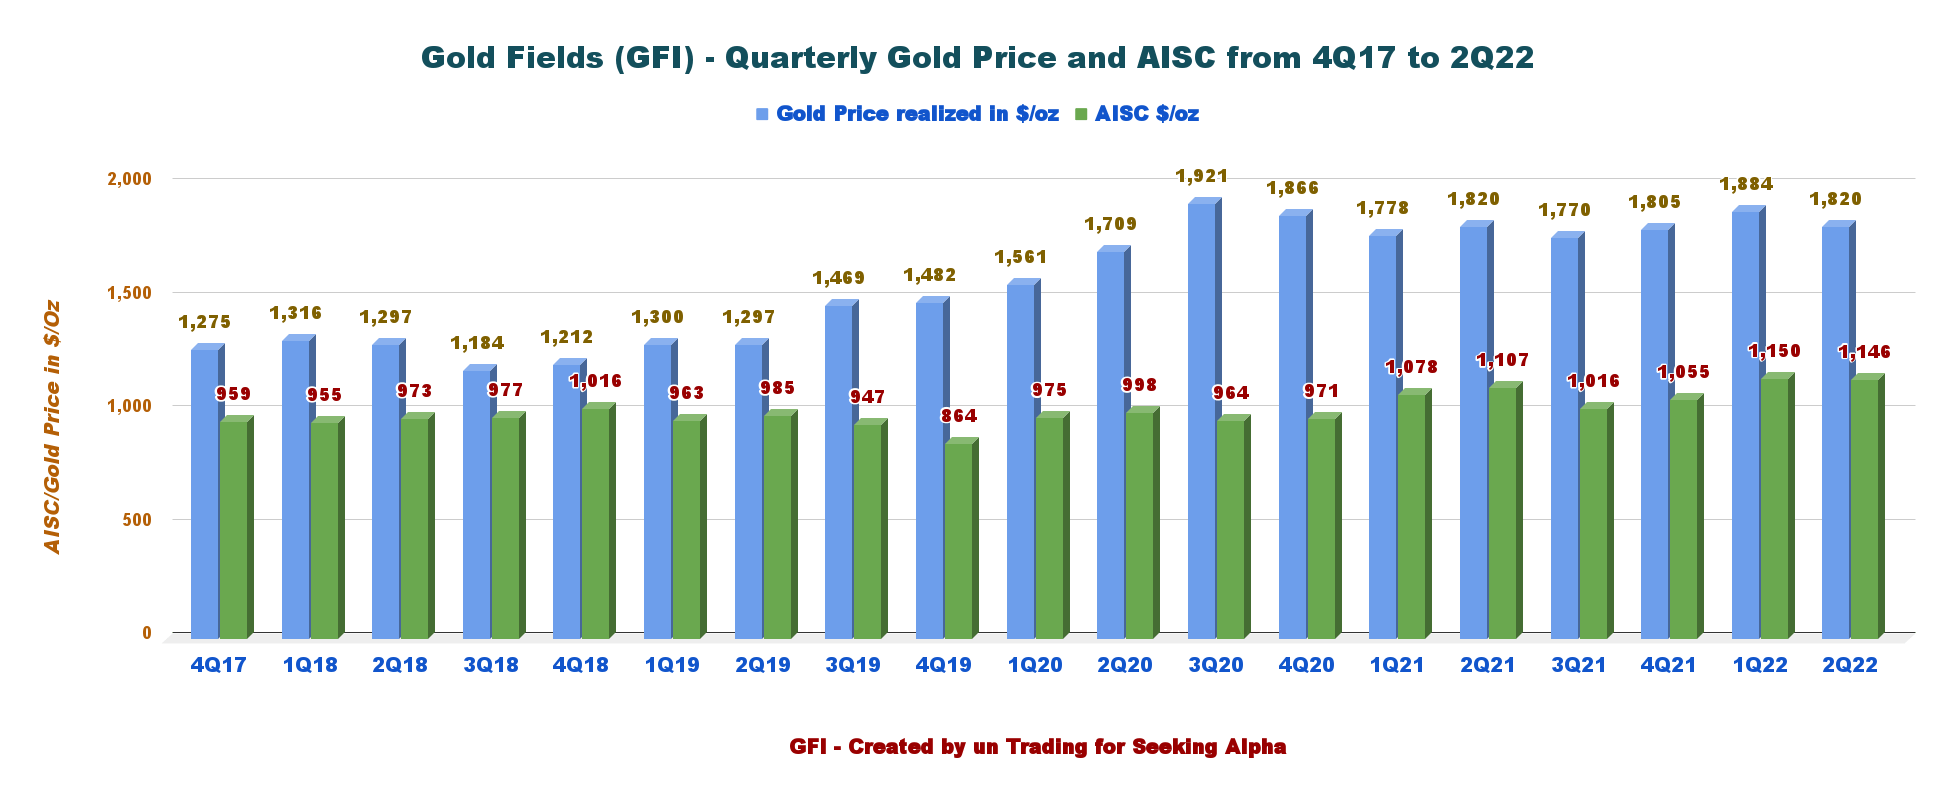
4.5 – Salares Norte project: Progress reached 77% at the end of June 2022.
The company announced that the project would experience some delays (one to three months) due to severe weather, impacting construction activities toward the end of 2Q22.
GFI Salares Norte update (GFI Presentation)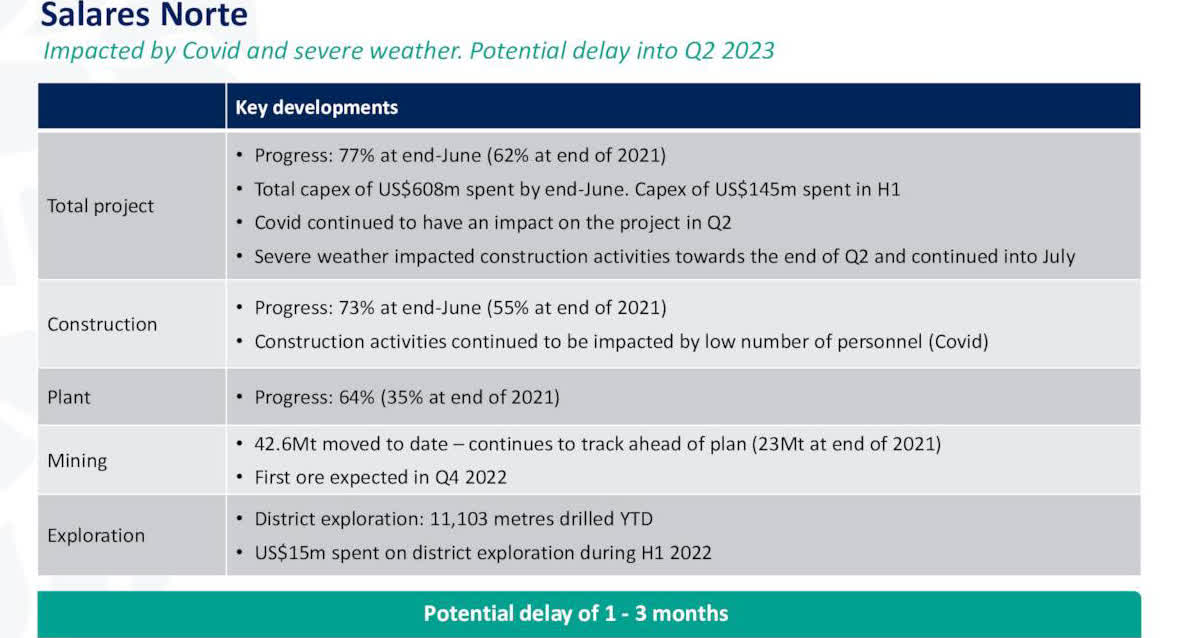
5 – 2022 guidance (excluding Asanko)
Gold equivalent production is expected to be 2.25 Moz to 2.29 Moz in 2022. Details are presented below:
GFI 2022 Guidance (GFI Presentation)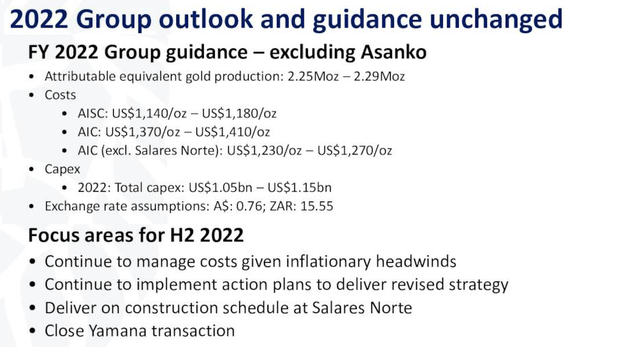
Part III – Technical Analysis (short-term) and Commentary
GFI TA Chart short-term (Fun Trading StockCharts)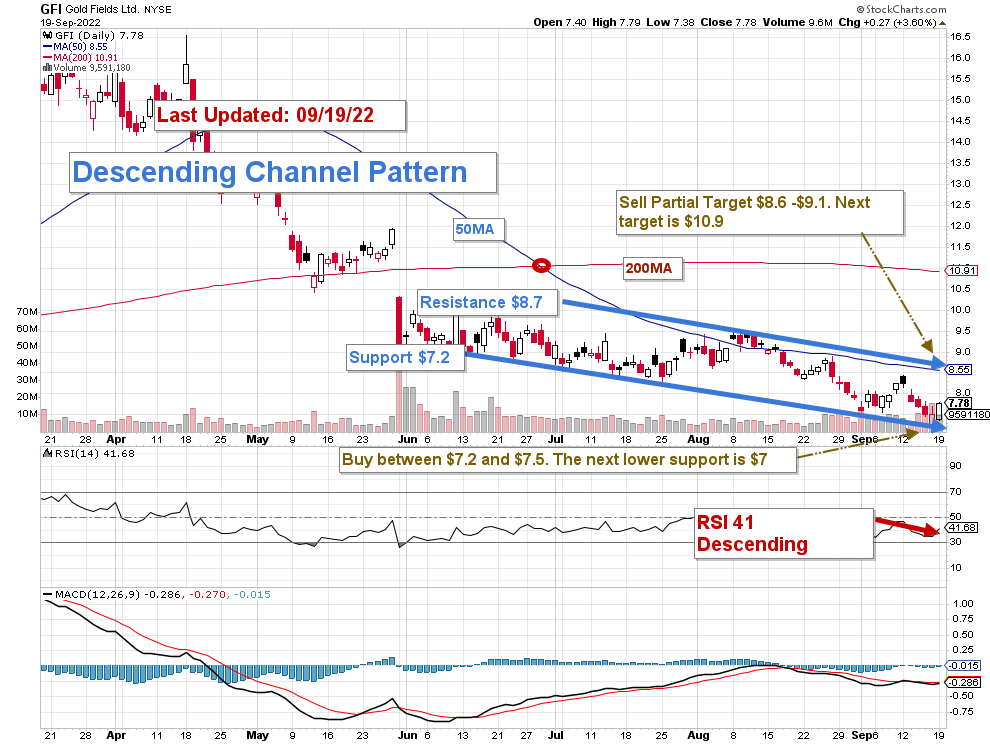
Note: The chart has been adjusted for dividends.
GFI forms a descending channel pattern with resistance at $8.7 and support at $7.2.
The trading strategy I recommend is to take LIFO profits between $8.6 and $9.1 (about 25%) and buy back below $7.5.
However, depending on the gold price strength and the action of the Fed, which is getting more hawkish by the day, GFI could cross the resistance and retest $10.90-$11 or go down below $7.
Watch Gold like a Hawk.
Warning: The TA chart must be updated frequently to be relevant. It is what I am doing in my stock tracker. The chart above has a possible validity of about a week. Remember, the TA chart is a tool only to help you adopt the right strategy. It is not a way to foresee the future. No one and nothing can.
Author’s note: If you find value in this article and would like to encourage such continued efforts, please click the “Like” button below as a vote of support.
Be the first to comment